Online trading opened a new era for retail traders. Before the Internet conquered the world, only a few retail traders had access to the FX market. Because of that, brokerage houses did not invest in infrastructure development, and conditions to access the market weren’t friendly.
Things changed with the rapid penetration of the Internet in our day-to-day lives. First in the developed world, then gradually into developing and emerging markets, the Internet made it possible for billions of people to have access to information and to be connected online.
We like to think of email, for example, and how it revolutionized the way people communicate. Just like email changed the way we deliver messages, online trading changed the way retail traders approached the FX market.
With Internet connectivity spreading faster and faster around the world, more and more retail traders discovered the currency market and online retail trading. Brokerage houses with visionary leadership invested in new technologies and the industry leaped forward.
At first, an FX trading account gave access to some basic currency pairs and the terms were terrible for the trader. To exemplify, think of the most popular currency pair today – the EURUSD exchange rate. Nowadays, an Electronic Communication Network (ECN) broker has the bid-ask spread as low as 0.0 pips during some moments in the trading day. Back in the day, the EURUSD exchange rate had a fixed 3 full pips spread.
In time, things changed. Brokerage houses took a step forward and extended their offering by providing access to new markets. So, an FX trading account today is tremendously different from an account twenty years ago. In this article we will have a look at what an FX trading account was, and what it is today.
FX Trading Accounts in the Early 2000s
Many of today’s retail traders do not know what an FX trading account looked like in the early 2000s. One of the striking differences between today’s FX accounts and the earlier ones is the number of pips or digits in a trading quote.
The transition from 4 to 5 digits sparked a revolution in the FX industry. It enabled brokers to offer more accurate prices, closer to the market, to the benefit of the trader.
It also marked the beginning of a new era in online trading. Before the “switch” from 4 to 5 digits, the spreads were wide, albeit stable. To exemplify, think of the EURUSD exchange rate. It is the most popular among retail traders today because it has the tightest spread of all FX pairs. Nowadays, the spread on ECN accounts is as low as 0.01 pips, and sometimes even zero.
Yet, at the start of the new century, the EURUSD spread was a hefty 3 full pips. I am sure that by now, our readers are familiar with the fact that a pip refers to the 4th digit (i.e., the 4th number) after the decimal point in a quotation – with the exception of the JPY pairs, where the second digit is the pip point.
Coming back to our example, a normal quote on the EURUSD pair was, say, 1.2145–1.2148, where the left quote was the bid and the right quote the ask price. Effectively, it meant that for a trading strategy that had a ten pip profit target, 30% of it went to the broker as a fee (spreads are a fee that the broker charges for offering its services).
Most brokerage houses that catered to the retail trader offered no other markets from the FX trading account. Some exceptions did exist, but that changed with the upcoming technological advances.
Technological Advances in the FX Industry
The more retail traders turned to the FX market, the bigger the technological breakthroughs the industry made. In the early 2000s, the FX brokerage houses that offered services to the retail trader were split into 2 categories. One category contained new entrants to the market – new brokerage houses that sensed the opportunities and recently opened up for business. They are the names that you may see today that advertise their fifteen or seventeen years of experience. Back in the day, they were start-ups.
Another category contained established brokers that already had many years of experience but in other markets (e.g., commodities, stocks, derivatives) and with other types of investors (e.g., institutional investors).
Both parties wanted something that the other party had. The newcomers wanted to offer the retail trader access to other markets than the FX one. The idea was that, by allowing the FX trader to access other markets from the same trading account, the retention rate (i.e., the rate of retaining the active traders – the higher the rate, the better for the broker) would increase significantly.
On the other hand, the established brokerage houses sensed the opportunity given by the retail segment and wanted to expand their services and customer base.
The combined interest of both parties led to a merger of their services to what we know today as a modern FX trading account. In the meantime, the small companies, the new entrants in the market a couple of decades ago, became large brokerage houses in the retail space, while the established houses restricted their services to become more exclusive. For example, they raised the minimum amount to open a trading account to tens of thousands of dollars, an amount not easy to come up with for a regular retail trader.
The Transition from 4 to 5 Digits
An exchange rate quote states both the bid and the ask price. These are the prices that the trader uses to buy (the ask price) or to sell (bid price) when trading. Both prices are used in any one transaction. For example, if a trader decides that a currency pair is bullish and wants to go long, or buy the pair, the trader will use the ask price.
After some time, the position will eventually be closed – either at the take-profit level, at the market, or at the stop-loss level. When it happens, the bid price is used. Thus, the bid and ask prices are both used in any transaction and the difference between the two represents the spread of a currency pair, which may be fixed or variable depending on the type of the trading account.
Nowadays, all currency pairs’ quotes, with the exception of the JPY pairs, have 5 digits. This means that after the decimal point, 5 numbers follow, each number representing 1 digit. In the case of the JPY pairs, 3 digits are shown by all pairs, and 1 pip refers to the movements in the 2nd digit.
The move was revolutionary for the retail FX market participants for 2 main reasons. First, it signaled the decline in the wide spreads. From the moment that the 5-digit accounts were introduced, the spreads began to tighten. Slowly at first, and more aggressively thereafter, as competition and new technological advances made it possible for brokers to offer better trading conditions to retail traders.
Second, the new 5-digit accounts led to the gradual disappearance of re-quotes. Today’s traders that use an ECN account or any other account with 5-digit quotations have no idea of the troubles created by re-quotes. To explain, when traders wanted to buy or sell at market, on a 4-digit account, some brokers, especially market-makers, re-quoted the entry. With the excuse that the market was moving too fast, brokers did not execute the order and offered a new price – always to the detriment of the trader.
For example, if the trader wanted to short a pair, the broker would offer a re-quote from a lower level. This may have happened multiple times until the trader entered a position, but always at unfavorable conditions.
The Transition from Fixed to Variable Spreads
The new technology brought a diversified offer from brokerage houses. One of the most important changes that followed shortly after the 5-digit account was introduced was the switch from fixed to variable spreads.
Even today, many brokers offer traders the option to choose from a type of account with a fixed or a variable spread. From the traders’ point of view, the temptation is to choose the account with the tightest spread possible. From the broker’s perspective, the type of spread signals the type of technology behind the trades’ execution.
If a trader chooses a fixed-spread trading account, the spreads are wider than those in a variable-spread trading account. However, conditions are easier for the trader to open a fixed-spread account. For example, on a fixed-spread account, you may have no limitations on the minimum amount to deposit and micro-lots would be available. It is not the same on a variable-spread account, where usually there is a requirement for a minimum deposit due to additional costs incurred by the broker for offering superior trading conditions.
ECN and Liquidity Pools
An ECN account is the ultimate technology available to retail traders today. When trading with an ECN account, traders can rest assured that the broker is routing all their orders to the market (i.e., the liquidity providers).
This is very important, because various types of brokerage houses exist. One type is a market-maker – a broker that does not route any order to the market, but instead trades against its own customers. In other words, when a trader sells, the broker takes the other side of the trade, and buys. Because the odds of winning are on the broker’s side, the broker stands to make a profit in the end.
An ECN broker is forced to route all orders to liquidity providers. The technological bridge to do so is so expensive that it makes no sense to do otherwise. Plus, the benefits for both the trader and the broker compensate for the efforts. On the one hand, the trader has access to the best available trading market conditions. On the other hand, the broker does what it is supposed to do – acts as a financial intermediary between the trader and the market. It charges a commission or a fee for doing so, but for the right reason.
A liquidity pool refers to the number of liquidity providers that a broker works with. The more providers, the better, because the orders that the broker routes to the liquidity pool are designed to be executed at the best available price. Hence, the more liquidity providers, the more available prices and the better the price at which the order would eventually be filled.
In many aspects, the Straight-Through Processing (STP) technology follows a similar path as the ECN. In other words, when trading from an STP account, the conditions are almost identical with trading from an ECN account. Some small differences exist in favor of the ECN technology, but they are so slim that they don’t deserve mention.
How to Make the Most of a Forex Account Today
Now that we have introduced the types of trading accounts and how the industry evolved over time, it is appropriate to discuss what a trader can actually do with an FX trading account. For some traders, the other markets available to trade are of no importance. Nevertheless, other traders venture into buying or selling other assets offered for trading in the FX account. Yet, traders should pay attention to ALL the markets available to trade, for the simple reason that they are interconnected.
Let me give you an example. Suppose you buy a USDCAD pair based on a top/down analysis you have made on the pair. According to the technical analysis, the USDCAD pair is bullish and should move to the upside, but before going long, you should at least check one other market – the WTI crude oil.
The Canadian dollar and the price of oil have a direct correlation. This means that when the price of oil rises, the Canadian dollar does the same. Or, when the price of oil declines, the Canadian dollar declines in value too.
The more important thing to remember from this correlation is that the price of oil leads the move in the Canadian dollar and not the other way around. Therefore, even if the trader has no intention of selling oil, a bearish perspective for the price of oil may be just the confirmation the trader needs to buy the USDCAD pair or to short the Canadian dollar. Naturally, the opposite is true – a bullish crude oil setup invalidates a bullish scenario on the USDCAD pair. So, the better the trader understands the correlations in a trading account, the more the account will perform.
FX Pairs
The Forex market is the largest and most liquid in the world. The quote of each currency pair represents the value of one currency expressed in terms of another. If we consider that there are over a hundred currencies in the world, combining them into pairs gives us an idea of the size of the FX dashboard.
The FX dashboard refers not only to the currency pairs offered in the trading account, but it is a general term that comprises all other markets. Most of the other markets are offered in the form of CFDs (Contracts for Difference), meaning that the moves in the underlying asset are the basis for the move in the contract.
Majors and Crosses
It all starts with the clear distinction between majors and crosses. By using the US dollar as a reference for the 2 categories, one can split the FX pairs into majors and crosses – majors are the pairs that have the dollar in their components (e.g., EURUSD), minors are the ones that don’t (e.g., EURJPY).
Majors are more liquid than crosses because they have the US dollar, the world’s reserve currency, in their components. As such, the first distinction to be made is between exchange rates themselves, considering the overwhelming role of the world’s reserve currency.
Another thing to consider is what moves the currency pairs and if there are other markets to consider that may affect the value of a currency, and thus the way an exchange rate performs. As such, we may look at commodities, which, like precious metals and energies, are fixed-income, but also the stock market – all of them represented on the trading account via CFDs.
Commodities – Gold and Other Precious Metals
Gold is the oldest form of money and it has outperformed major currencies for decades. In other words, gold has stood the test of time and protected investors’ portfolios from declining currencies.
Most countries in the world issue debt to pay for their rising budget deficit. Usually, that debt is issued in the local currency, especially in the developed world. In emerging markets and developing countries, the US dollar is the de facto leader in the world of debt issuance.
Countries prefer to issue debt in their local currency because they can debase the currency to pay down the debt faster. In other words, countries are in control, to the detriment of fiat currencies’ owners. By owning gold, investors protect themselves from the quick debasement of the local currency. More precisely, investors protect their portfolios from inflation.
The FX trader may do the same, provided the time horizon is long enough so that the benefits of owning gold pay off. Traditionally, professional investors allocate a few percentages of a portfolio to gold, roughly between 3% and 5%.
Other precious metals usually follow closely in the gold market’s footsteps. Think of silver, for instance, the “poor man’s gold,” which moves in a tight correlation with the price of gold.
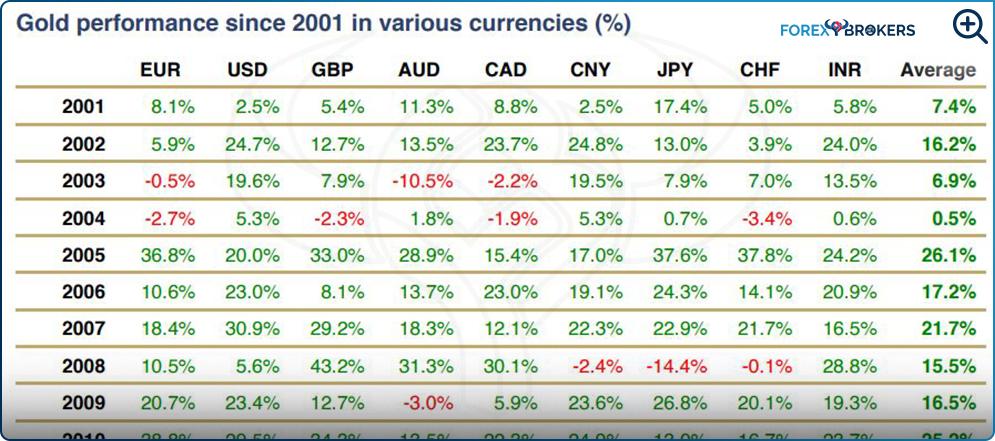
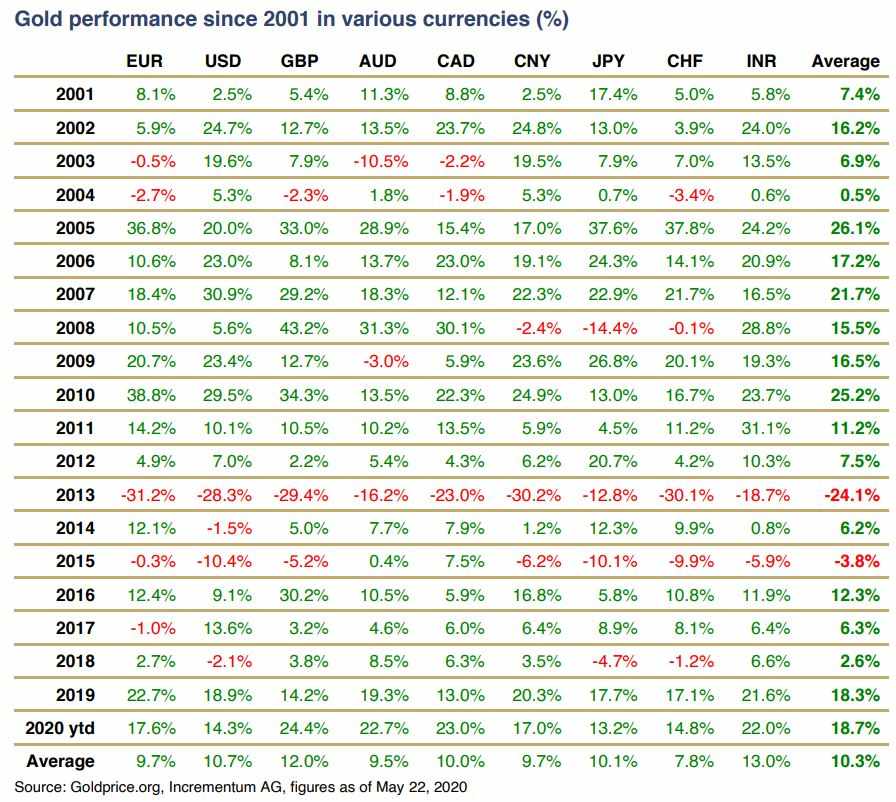
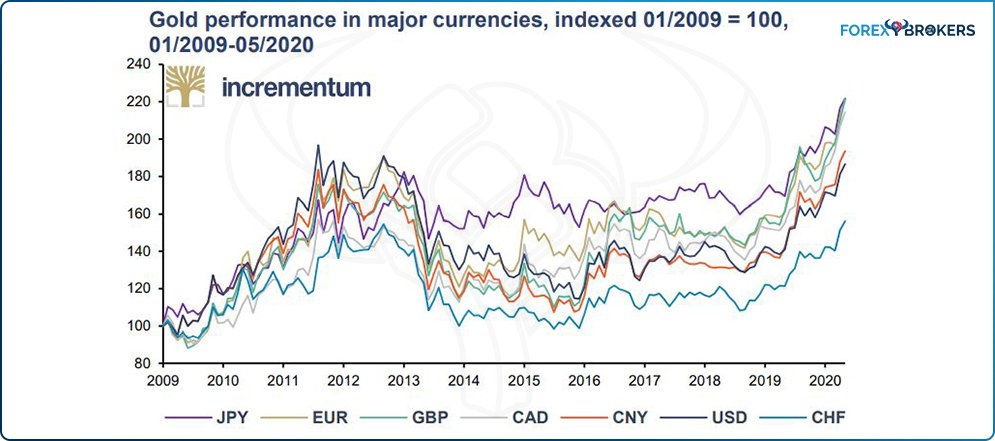
The table below shows how gold performed in the last 2 decades against most of the major currencies in the world. We have here both G10 currencies, like the EUR, USD, GBP, and the JPY, but also the Indian rupee. With the exception of 2013, gold outperformed all the fiat currencies, in many years delivering a double-digit return.
Because inflation is not easy to see and measure using the central banks’ traditional tools (e.g., core inflation), the best way to protect against it is to own gold. Later in this article we will present some other important characteristics of gold – its indirect correlation with the US 10-year yield.
Commodities – Oil and Energies
Still on the commodities front, oil prices are a major driver of inflation. Higher oil prices (e.g., WTI, Brent) drive inflation higher, while lower oil prices lead to disinflation; when inflation drops below zero, a deflationary spiral grips the economy.
Because central banks follow a mandate that aims toward price stability, or stable inflation, all the factors that cause inflation to rise or fall matter for the central banks and the FX traders. Hence, even if the trader does not actually have a long or short position on the price of oil, an analysis of this market is crucial.
The best example comes from 2020 and 2021. During the pandemic, the price of oil collapsed to negative $40, as the May 2020 futures contract settled below zero. However, ever since, the price of oil is in a strong recovery, a bullish trend that currently sent black gold over $68 before correcting. In other words, inflation is coming, because higher oil leads to higher inflation, although central banks argue that this is only temporary. Because oil is part of any brokerage house offering, having an eye on the price of oil is an absolute must for the FX trader.

CFDs on Indices
A CFD follows the movements in the underlying asset and is a cheaper way to gain exposure to the asset. Because a CFD is a derivate contract, it does not give ownership rights or benefits. Instead, it is used the same way a trader uses a currency pair – it can be bought or sold against a certain margin, against a fee (usually in the form of a spread), and likely against commissions, too.
As a rule of thumb, commissions and fees are typically higher on CFDs on “exotic” assets such as the CFDs on shares, indices, or cryptocurrencies when compared to the CFDs on currencies. In that respect, the trader should ideally use an ECN account to trade currencies, so that their orders are routed to the market.
CFDs on indices are extremely popular because of the diversification benefits they provide and their tight correlation with the currency market. During the pandemic, the AUDUSD pair moved in a direct correlation with the major indices in the United States, so going long on AUDUSD or buying a CFD on the Dow Jones would yield the same outcome.
However, conditions on the 2 products offered by the brokerage house may differ, so the trader should choose the ones that are more advantageous. For example, if the AUDUSD long trade has a negative swap that is bigger than the negative swap on the CFD on the index, then the trader should favor the CFD instead of going long on the AUDUSD pair.
CFDs on Shares
The stock market frenzy in the United States led to more brokers offering CFDs on shares. After Trump’s election in 2016, the stock market took a quick dive and then rallied aggressively. It did the same on Biden’s election in 2020, and in between the 2 events, it kept making new all-time highs. Naturally, such a move attracted the interest of retail traders from all over the world, traders that wanted to be part of the move. As an example, Tesla, the US electric vehicle maker, increased over 800% in 2020, with most of the gains occurring after the pandemic started.
But trading CFDs on shares follows the same principles as those explained earlier. More precisely, the trader does not own the actual share, and does not borrow it from the broker to go short. Hence, trading CFDs does not allow the investor to benefit from all the rights given by owning a share – voting rights, dividend rights.
However, CFDs on shares are favored by traders that have a short interest in a company. For instance, if one believes that the shares of Tesla are about to decline, shorting it on the actual market would be expensive. The trader would need to borrow the shares from the broker to come up with an initial margin, pay interest on the borrowed capital, and so on. CFDs solve all these issues, providing a cheaper way to participate on the short side.
CFDs on Cryptocurrencies
The increased adoption of cryptocurrencies has led many retail traders, and now institutional investors as well, to add cryptocurrencies to their portfolio. Because of the high volatility, the cryptocurrency market attracted many players, from short-term speculators to long-term investors, also called “hodlers.”
A CFD on a cryptocurrency such as Bitcoin or Ethereum follows the same rules as all other CFDs. In other words, it represents just another way of getting exposure on the cryptocurrency market, allowing traders to buy fractions of a Bitcoin or to sell an asset they do not own.
Fixed-Income Markets
The fixed-income market is extremely large – even larger than the equity market. It represents the place where dealers and big market players trade bonds and other securities, with the aim of making a capital gain, as well as earning coupons and principal repayment. In other words, fixed-income instruments solve one of the most stringent needs in the financial world – the need for timely cash flows. Therefore, businesses and investors can plan their cash flow needs more accurately, making the most of their proceeds.
The fixed-income market has various components, one of them being sovereign bonds (bonds issued by sovereign states). Some of these bonds are deemed risk-free, such as the US 10-year Treasury bond, or the Bund in Germany. Therefore, by owning a risk-free asset, traders know that there is not going to be a default on these investments.
A bond has 2 parts that move in opposite directions – one is the bond’s price, another is the bond’s yield. When the price of a bond falls, the yields rise, and the other way around. But higher yields are also the result of expected economic growth or higher inflation, and often lead to a higher dollar if the yields in the United States are rising.
US 10-Year Yield
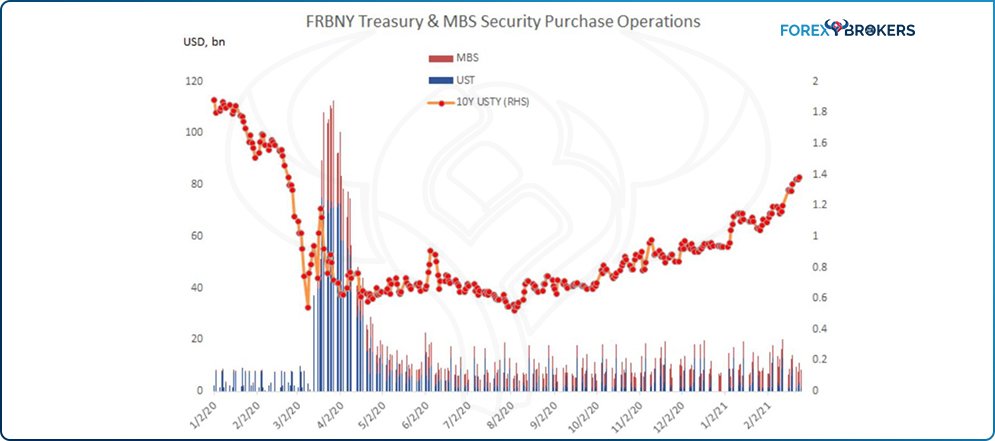
The start of 2021 brought higher yields for the US Treasury. While on the bigger charts, the move higher is insignificant, the rise, while small, triggered a small tantrum in financial markets as the dollar started to appreciate.
Moreover, higher long-term yields in the United States trigger similar moves in other yields in other jurisdictions. For instance, the rise in the US 10-year yield led to similar moves in European yields, triggering tightening conditions unwanted by the ECB. Hence, when yields are rising, central banks are acting, with massive implications for the currency market. This means that if the brokerage house offers fixed-income products (CFDs on fixed-income assets), the US 10-year yield is a must-watch market.
Gold and Long-Term Yields
There is something else to consider about long-term yields in the United States – they have an inverse correlation with the price of gold. Effectively, it means that when the US 10-year yields are rising, the price of gold is falling, and the other way around.
The correlation explains the recent price action seen on the gold market. It made a new all-time high in 2020 when the yields were collapsing, and then the price of gold dropped several hundred pips. It currently trades above the $1,700 level after topping $2,000 during the summer of 2020, as the yields have risen.
Why Does A Trader Need to Consider All These Markets?
Various correlation levels exist. Two assets that are perfectly, positively correlated have a correlation of 1. When the correlation reaches -1, they are negatively correlated. Naturally, when the correlation is zero, they are uncorrelated.
Out of all markets available to trade from the same trading account, most of them are correlated, positively or negatively. Rarely will you find an asset that has little or no correlation with another one.
In the world of professional investors, it is said that if an asset has a correlation below or above 0.5, respectively -0.5, with the portfolio (which may be formed of one or multiple positions), it is worth adding it. If not, it will just increase the risk.
Diversification Benefits
Such an asset, as described above, brings diversification benefits if added to the portfolio. In the world of FX traders, an uncorrelated asset, or one with an acceptable correlation level to be added to a portfolio, would be the EURJPY, for example, if the portfolio is made of 2 positions, one GBPCAD and the other NZDCHF. The 3 markets have little or nothing in common, and by adding the EURJPY as an uncorrelated asset, the investor obtains diversification benefits.
On the contrary, by adding the EURJPY to a portfolio made of EURUSD and EURGBP, the new asset will increase the risk if the market direction is similar, or hedge the portfolio if the market direction is opposite.
Portfolio and Risk Management
Traders that better manage their risk have more chances to survive. Risk management does not mean that the trader aims at reducing risk entirely – that is not possible. Instead, the trader aims to reduce risk as much as possible, while giving the account room to grow.
To exemplify, consider a recently funded trading account. The trader should always have part of the portfolio in cash, for at least 2 reasons. One is to have enough margin to cope with the imminent drawdown that often follows the opening of a trade. Another is to have cash to use it when the opportunity arises.
So cash is just another aspect to consider when trading, just like gold, for protection against inflation and CFDs, for finding the cheapest way to gain exposure on the market, or fixed-income or oil, to have an idea about where other markets might go.
Conclusion
A trading account in the twenty-first century is more than just an FX trading account. Brokers give access to so many other markets that the trader can form a complete picture of the underlying conditions in the market before deciding what to buy or sell, what to add to the portfolio, and what to eliminate from it.
It does not mean that a trader must trade all the markets that the broker provides. It only means that the broker goes an extra length to bring together all the information needed to make the right decision. Imagine how difficult it would be to have a different account to monitor gold, cryptocurrencies, yields, oil, and so on.
A true broker is a trader’s partner. A true brokerage house needs a successful and active trader, so that the commissions keep pouring in. Therefore, it should come as no surprise that brokers do invest part of their earnings to offer the best possible trading conditions available. One of those is to give the trader access to as many markets as possible – the more markets, the better.
