Once upon a time, before mid-1900s, an accountant fell ill, so ill he needed to spend a lot of time at home, resting. Back in those days, no Internet or personal computer (PC) existed, not even TV. However, this guy couldn’t sit still.
Bored with the situation, he read the daily newspaper and couldn’t ignore the stock market section. It was something that changed daily and proved to be intriguing enough to worth monitoring.
Therefore, Ralph began looking at the stock market regularly. He noticed the ups and downs and connected the movements first with the daily news. Afterward, he saw the general market correlated with moments of hope and despair, greed, and fear.
Soon, he started putting patterns on a piece of paper, and this is how one of the greatest trading theories was born—the Elliott Wave Theory.
Ralph N. Elliott is the man responsible for building a trading theory that follows human nature and is close to behavioral finance. What’s even more interesting is that the theory born almost a century ago is undeniably valid today. At that time, stocks and commodities (e.g., coffee, corn, cattle, gold, cotton) dominated trading.
Fast-forward several decades, humankind embraced the PC. The Internet followed shortly. Meanwhile, the currency market gained a steady foot on the newborn retail brokers’ offering. Nevertheless, the theory remains valid. Maybe that’s an understatement, as rookie traders probably don’t understand the value of the Elliott Wave Theory.
Based on understanding human nature and behavior, it’s unique and powerful, so powerful you’ll fall in love with it right from the start.
Introducing the Elliott Wave Theory
The Elliott Wave theory is a logical process. The trader looks at the price and interprets the market moves. Some call it counting the waves; some others call it interpreting the swings. No matter how you put it, the analysis looks simple at the start.
However, the more you dive into the theory, the more confusing things become. With several rules to follow, it is easy to get lost.
A joke among Elliott traders goes that if you give 10 traders to count a market, you’ll have 10 different interpretations. The truth is somewhere in the middle, and the joke only tells us how complex and challenging it is to trade with the Elliott Wave Theory.
However, the theory is responsible for exciting results. As traders, we aim to forecast future market moves or to predict the future while at the same time protecting against being wrong.
To avoid getting lost in the complexity of the Elliott Wave Theory, we need to follow a logical process. It is the base for understanding the concept as Elliott intended almost a century ago.
The Elliott Wave Theory is based on impulsive and corrective waves. The two are interconnected in the sense that impulsive activity is present in corrective waves and vice versa.
The logical process begins with answering one question: is this market move impulsive or corrective? If the answer is impulsive, traders go down that road, trying to establish what kind of impulsive wave the market forms. If it is corrective, the next thing to decide is if the market forms a simple or complex correction and so on.
Impulsive Waves with the Elliott Wave Theory
To make a clear distinction between impulsive and corrective waves, Elliott used numbers and letters, respectively. More precisely, he used the first five numbers (1, 2, 3, 4, 5) and letters (a, b, c, d, e). Therefore, any possible Elliott wave analysis is a combination of these numbers and letters. No other number or letter is possible despite different versions circulating among retail traders.
In some cases, the letters w, x, and z appear, but that’s only an interpretation meant to bring more precision. Remember that this is a trading theory almost a hundred years old, and in the meantime, many tried to bring improvements to it. Nonetheless, the original version stood the test of time, and the first five numbers and letters are enough to count impulsive and corrective waves properly.
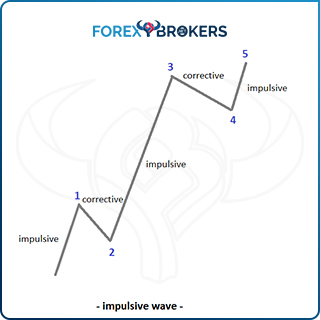
Impulsive waves are five-wave structures labeled with numbers. An impulsive wave, therefore, subdivides into five different smaller waves called waves of a lower degree as the Elliott Wave Theory uses cycles of various degrees to explain complex market moves.
Out of the five waves that make an impulsive move, three are impulsive (wave 1, wave 3, and wave 5), and two are corrective (wave 2 and wave 4). All the rules of an impulsive wave must apply not only to the entire 1-2-3-4-5 structure but also to individual segments 1, 3, and 5.
In other words, the entire market move from the beginning of wave 1 until the end of wave 5 is impulsive. However, two corrective waves appear on each impulsive segment.
What Makes an Impulsive Wave?
Impulsive waves are complicated structures. Remember that at the base of the Elliott Wave Theory sits human behavior, the way people react to fear and greed, news flows, and so on. To put an order in this chaos requires rules—plenty of them.
In this article, we’ll cover the basic ones; however, a future article in a different section of this trading academy treats the rules of impulsive waves in a detailed fashion, including the time element in the analysis.
As this is the first article dedicated to the Elliott Wave Theory, all you must remember is that an impulsive wave is a five-wave structure labeled with numbers. Similarly, the third wave in an impulsive structure can’t be the shortest when compared with the other motive waves (i.e., waves 1 and 5).
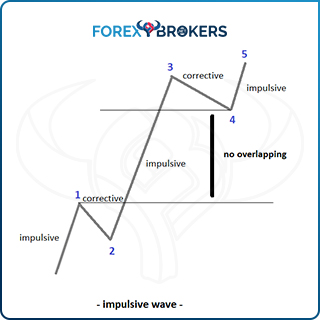
No parts of the second wave should move beyond the start of the impulsive structure (i.e., the start of the first wave). A similar rule refers to the fourth wave—it shouldn’t overlap with the other corrective wave in the structure. This is a rookie mistake for many traders as they focus on the end of the first and the fourth waves. In reality, the overlapping rule refers to the entire area.
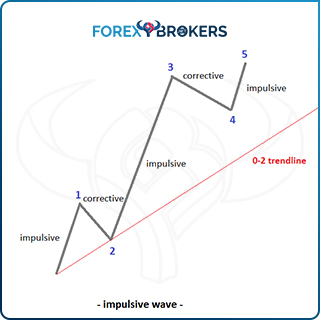
An impulsive wave must also respect the 0-2 trendline. The concept requires that the price action remains above (in a bullish structure) or below (in a bearish segment) the 0-2 trendline; otherwise, the entire five-wave is not impulsive.
To check that, first, draw a trendline connecting the start of the impulsive wave and the end of the second wave. The rule says that no parts of the first and third waves should pierce this line. If it is pierced, the structure is not impulsive.
The earlier image shows a classic impulsive wave, with one wave much longer than the other ones. In fact, this is a mandatory condition in impulsive waves, which invalidates the market move if missing.
Called extension, it uses the most important Fibonacci ratio—the golden ratio. In an impulsive move, at least one wave must extend. Moreover, the extension refers only to the impulsive waves of a lower degree (i.e., waves 1, 3, or 5).
Calculating the extension is the basic way to determine if a market segment is impulsive. Rather, more correctly, it is the first thing to check. Elliott established that the extended wave’s length is minimum 161.8% of the next segment’s length. Careful here as this is a classic mistake made by rookie Elliotticians—the 161.8% extension rule applies to the next longest wave of the two remaining impulsive waves.
Back to the earlier image, we notice that one wave stands out of the crowd. The third wave is the longest, but not all impulsive waves have the extended wave so obvious. In some cases, traders must effectively take a Fibonacci extension or retracement tool and check the 161.8% level.
To do that, first, select the wave to measure—in this case, the third wave. Second, check the remaining two impulsive waves in the structure—in this case, the first and the fifth wave. Third, select the longest wave between the two (the first wave). Finally, use a Fibonacci tool to find 161.8% of its length and project the outcome from the second wave’s end. The third wave’s length must exceed that distance as that’s a mandatory condition in an impulsive wave.
Types of Impulsive Waves
The extended wave is the one that provides the type of impulsive waves. When the third wave is the longest one in the structure, it is said that the market formed a third-wave extension impulsive move. This is the most common impulsive structure.
When the first wave is the longest, the market forms a first-wave extension impulsive move. A particular type of impulsive wave, it has some interesting characteristics. For example, the second wave in this structure is the most time-consuming. Additionally, because the third wave can’t be the shortest, it means that the extended first wave must exceed 161.8% of the first wave.
The rarest possibility is a fifth-wave extension. When it forms, most of the participants are caught on the wrong side of the market. Again, because the third wave can’t be the shortest, the fifth wave must exceed 161.8% of the third wave’s length.
In the next article part of this trading academy, we will thoroughly cover the three types of impulsive waves and present some tips and tricks on how to trade them. Moreover, we will present a special type of impulsive wave, a double extended impulsive move—a powerful structure forming when the market has strong trending conditions.
The Principle of Alternation
One of the most interesting concepts of the Elliott Wave Theory is the principle of alternation. It refers to the two corrective waves part of an impulsive move (waves 2 and 4) and states that they must differ at least in one of the following: structure, distance traveled, or complexity.
For instance, assume that an impulsive wave is under way. In addition, the market already formed the second wave, and the third wave extends. When the correction for the fourth wave begins, the Elliott trader already has an educated guess about how the fourth wave will look like.
If the second wave was a simple correction, the chances favor that market forms a complex correction for the fourth wave or vice versa. If it retraced a lot into the first wave’s territory, expect the fourth wave’s retracement to differ, to be much smaller.
Moreover, the time it takes for the two corrections to form differs. They rarely take about the same time, and when that happens, it’s a sign that the market doesn’t form an impulsive move but a corrective one.
The principle of alternation therefore requires that the impulsive wave has different structures for the two corrections in the second and the fourth waves. The more they differ, the better for the analysis as it is a confirmation of the market’s impulsive structure.
Sometimes it is worth having a look at the impulsive waves of a lower degree too. They should vary as well in terms of time and length. Though not part of the original principle of alternation, the more they differ, the better.
Corrective Waves with the Elliott Wave Theory
Corrective waves form often because the market consolidates for a long time. Think of how the Asian session is the least active in almost all currency pairs. There’s simply no liquidity, and until London and New York traders join, there’s little or no market activity.
While this is common in today’s currency market, it was the same when Elliott placed the basis of the theory in the 1930s using the US stock market’s moves. Therefore, it should come as no surprise that Elliott identified more corrective structures than impulsive waves. As already mentioned, even corrective waves have impulsive activity, and Elliott found a brilliant way to categorize them.
Corrective waves split into two main categories—simple and complex. The second category is nothing but an extension of the first one, combining the simple corrections in various ways. We can say that the simple corrections sit at the base of understanding corrective activity with the Elliott Wave Theory. Interestingly, Elliott found only three simple corrective structures, albeit he identified many “deviations” or types.
While impulsive waves are five-wave structures, corrective waves are three-wave structures. Even in the case of triangles that have five segments (a-b-c-d-e), Elliotticians refer to them as a three-wave structure simply because all five segments are corrective.
To label corrective activity, traders use letters. Although we mentioned that impulsive waves are labeled with numbers and corrective waves with letters, corrective waves also have impulsive activity. In that case, letters are used.
For instance, a flat pattern is a three-wave structure labeled a-b-c. However, the c-wave, while labeled with a letter, is always an impulsive wave.
Simple Corrections
The Elliott Wave Theory is nothing but a set of rules used to define market structures. Because there are so many of them, to fully understand the theory, the Elliott trader should follow a logical process.
In corrective waves, it all starts with simple corrections. That’s the first thing to check after concluding that the market doesn’t form an impulsive wave.
Elliott found three simple corrections: flats, zigzags, and triangles. Everything about corrective waves starts with these three patterns and their variations.
To make things easier and simpler to understand, this article starts with simple corrections and then combines them using a step-by-step approach. This way, everybody can follow the logical process and understand how to count corrective waves.
However, we’ll have a closer look in future articles; therefore, don’t worry about not understanding all the details. It is only normal as this is just the introductory article to the Elliott Wave Theory, and things may look confusing.
Flats
A flat is a three-wave structure. Labeled a-b-c, it has two corrective waves (waves a and b) and one impulsive (wave c).
The intriguing thing about flat patterns is that the c-wave misleads traders. Because it has impulsive activity, the c-wave leads to the impression that the market would never reverse. In fact, the impulsive wave is just the end of the simple correction, and often, a rally in the opposite direction follows.
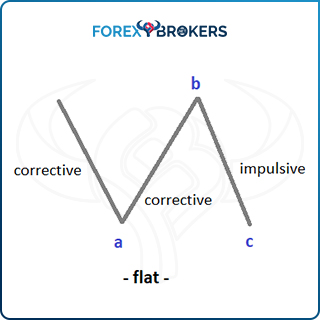
The above image shows a general illustration of a flat pattern. No less than 10 types of flats exist, and we’ll have a closer look at all of them in a future article. For now, it is essential to understand the basics of this pattern.
- Interpreting a Flat Pattern
What matters in a flat formation is the b-wave’s length. The a-wave’s move is quickly retraced, and the minimum distance for the b-wave to travel is 61.8%. Again, the Fibonacci golden ratio is essential. Undoubtedly, we can say that the Elliott Wave Theory would not be possible without the Fibonacci ratios.
As a rule of thumb, in any flat pattern, the b-wave must retrace beyond 61.8% of the previous a-wave. Without this condition, the pattern is not a flat.
While 61.8% is the minimum, there’s literally no limit to how long the b-wave might be. Its length is responsible for the various types of flat patterns we’ll study in a future article.
Remember that Elliott found three simple corrective waves: flats, zigzags, and triangles. The a-wave in a flat can’t be a triangle as a simple correction. However, it can be a complex correction that ends with a triangle.
The b-wave can’t be a triangle as well. It can be a flat on its own, a zigzag, or any other variation of a complex correction.
As for the c-wave, it must be a five-wave structure, albeit a classic or a terminal one. For a classic impulsive move, the market forms one of the four possibilities mentioned earlier. On top of that, there’s the possibility for the c-wave to a terminal impulsive move, a special five-wave structure we’ll cover later in this trading academy.
Zigzags
A zigzag pattern is still a three-wave structure. A really tricky pattern, it has two impulsive waves and one corrective.
Labeled a-b-c just like a flat, the key stays with the b-wave’s retracement. This time it must NOT retrace more than 61.8% of the previous a-wave. A typical retracement for the b-wave is somewhere between 23.6% and 38.2% of the previous a-wave, and it rarely reaches 50%.
Why a tricky pattern? Because both waves a and c are impulsive, traders are inclined to believe the market forms an impulsive wave of a bigger degree.
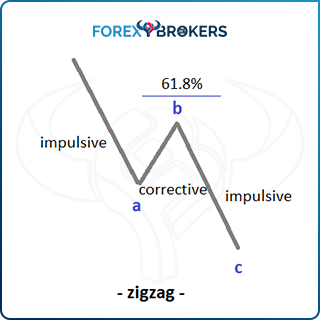
- Interpreting Zigzags
Wave a can only be a classic impulsive move—that is, a third-wave extension or a first-wave extended impulsive move. A fifth-wave extension can’t appear as wave a in a zigzag.
The c-wave is either a classic or a terminal impulsive wave. All types of impulsive waves can appear as the c-wave of a zigzag.
The b-wave is the only corrective structure. It can be a flat or a zigzag on its own but never a simple triangle. Instead, the b-wave can be any type of complex correction.
For the b-wave, it is important to remember that it must retrace the a-wave minimum 1%. It isn’t mandatory for the b-wave to end into the territory of the previous a-wave, but a minimum retracement should exist.
As misleading patterns, zigzags give the impression the market forms an impulsive wave of a larger degree. By the time traders realize the opposite, it is usually too late to avoid the stop-loss order being hit.
Triangles
Triangles have five segments—no more, no less. Despite that, they’re often called three-wave structures just because all the waves are corrective.

Many types of triangular patterns exist. However, all those variations respect the basic rules, namely, all legs are corrective, and the price must break the b-d trendline in less or the same time it took for the e-wave to form.
The two trendlines (a-c and b-d) define the triangular pattern. Out of the two, the most important one is the b-d as it shows when the triangle ends.
A curious thing about triangles is that they rarely form as simple structures but mostly appear as part of complex corrections. When that happens, most of the time, triangles form at the end of the complex structures.
The e-wave in a triangle can be a triangle of a lower degree as a simple correction. However, that’s not possible in any other of the four remaining waves.
Complex Corrections
A straightforward decision for complex corrections is that they represent combinations of simple ones. In fact, some of complex corrections do have the word “combination” in their names (e.g., double and triple combinations).
To combine simple corrections, Elliott found an omnipresent intervening or connecting wave called the x-wave. It is certainly a corrective wave as well. (After all, it is labeled with a letter, not a number.) The x-wave can be a simple or a complex correction on its own, with literally no limitations in prices, structure, complexity, or duration.
We won’t treat the complex corrections here for the simple reason they are numerous and require a dedicated space. What needs to stick to the Elliott trader for now is that in a complex correction, there are maximum two x-waves.
It means if there are maximum two intervening waves, the most complex correction has three simple corrections and two x-waves, a total of five distinct structures making a complex correction.
For instance, let’s imagine a triple combination. Like the name suggests, there are three simple corrections combined and connected by two x-waves.

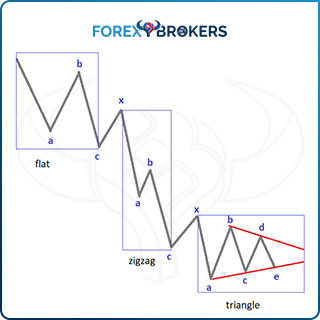
What would you make of a messy price structure like the one from the image above? Obviously, this is no impulsive move. If it’s not impulsive, it must be corrective.
Is this a simple correction? No, as it doesn’t resemble a flat, zigzag, or triangle. It must be complex; thus, let’s take a step-by-step approach to unlock the correct labeling of it.
Interpreting Complex Corrections
Any correction starts with the a-wave; therefore, the first thing to do is to label the first swing lower with this letter. Based on the retracement level of the next market swing (more than 61.8% of wave a), we draw the conclusion that the first correction is a flat. Why? Only in a flat that the b-wave retraces more than 61.8% of the previous a-wave. Moreover, we know wave a is a corrective structure.
Naturally, the move lower that follows is the c-wave of the flat pattern. Afterward, we notice there is more to the complex correction. Therefore, the swing higher that follows is an x-wave. Thus far, we’re here:
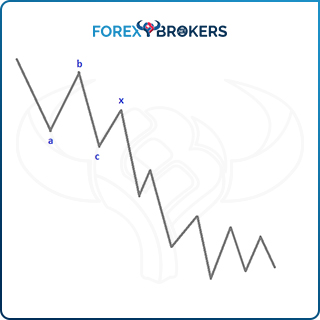
Another swing lower follows. Only this time, the correction is so small that it doesn’t exceed 61.8% of the previous wave. In conclusion, the market forms a zigzag, and the logical way to label it is by another a-b-c. Naturally, another intervening wave follows, another x-wave.
Keep in mind there are maximum two x-waves in any complex correction. Hence, after finding the second one, the next simple structure must end the complex correction.
We notice the last structure has five different segments; therefore, that’s a triangle. Labeled with a-b-c-d-e, it ends the complex correction, and its entire Elliott wave structure looks like below. In the example, the complex correction is a triple combination, formed by a flat, a zigzag, and a triangle and connected by two x-waves.
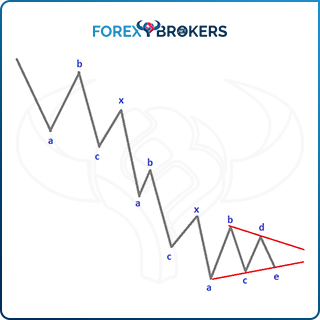
The best way to understand complex correction is to identify the simple ones and then the x-wave or x-wave. In doing that, the x-wave’s importance becomes obvious, and it is easy to notice that complex corrections are only combinations of two or three simple corrective waves.
Cycles with the Elliott Wave Theory
One of the most complicated things to understand about the Elliott Wave Theory is the different cycles that it interprets. Elliott found that the structures repeat but on different cycles.
Nowadays, the cycles are easy to spot because all trading platforms present the data on multiple time frames. Obviously, on the monthly chart, the bigger cycles form. Afterward, the lower we move with the time frames, the smaller the cycles become.
However, what exactly is a cycle with the Elliott Wave Theory? We’ve presented earlier the five-wave structure of an impulsive wave. It has three impulsive waves of a lower degree (i.e., a smaller cycle), and together, they form a wave of a bigger degree (i.e., a bigger cycle).
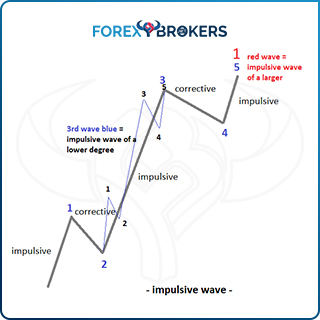
The entire 1-2-3-4-5 structure in blue forms an impulsive wave of a larger degree—more precisely, an impulsive wave that belongs to a different cycle. It can be the first wave of an impulsive move, such as labeled above with red, or the a-wave of a zigzag. (Remember that zigzags have an impulsive wave for the a-wave.)
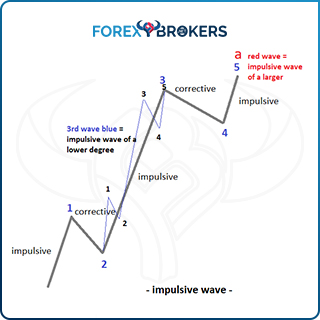
Finally, it could be the c-wave of a flat pattern. A flat of a larger degree and that means that the start of the impulsive structure, in blue, represents the end of the previous wave, the b-wave in red.
Sounds complicated? A bit it does. Now you understand why simple Elliott principles become complex market analyses the more you dig below the surface. This is why different Elliott traders have various Elliott counts on the same market—the error comes from the wrong interpretation of the cycles.
Elliott Cycles – Further Specifics
For such a complex subject, we must insist some more on the Elliott cycles. They’ll become clearer further in this trading academy when we cover the principles of constructing a top-down analysis with the Elliott Wave Theory.
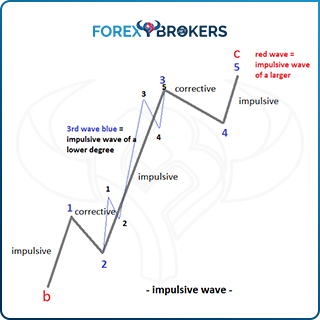
Now it is worth mentioning that every five-wave structure (an impulsive move) is corrected by a three-wave one (a corrective move). Focus on the previous image.
Wave 1 in blue is impulsive, followed by wave 2 in blue, a corrective structure, hence 1-2-3-4-5 of a lower degree corrected by a-b-c of a lower degree. Moving forward, wave 3 in blue is impulsive, followed by wave 4 in blue, a corrective wave. Therefore, 1-2-3-4-5 in black, of a lower degree, is corrected by a-b-c- in black, a corrective wave. Finally, wave 5 in blue is impulsive as wave, having a 1-2-3-4-5 structure as well, of a lower degree (in black).
However, where is its correction? Because it ends the impulsive wave of a larger degree (i.e., in red), it has no correction of the same degree, just the correction belonging to the bigger degree (i.e., in blue).
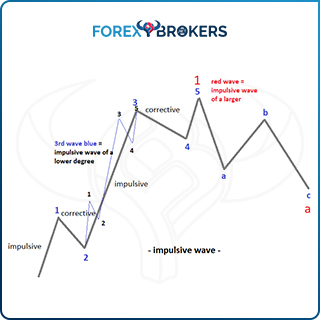
The easiest way to spot the cycles of various degrees is to just look at the different colors on the previous image. Elliott had names for each cycle such super cycle, grand cycle, and so on. Using different colors and font sizes when labeling, the chart becomes clearer.
Fibonacci Ratios
The Elliott Wave Theory isn’t possible without the Fibonacci ratios. They are everywhere in the theory and help traders define patterns and project targets.
Below are the ones mentioned in this introductory article so far. However, many other ones exist, and they’ll appear in future articles dedicated to the subject:
- In a flat, the b-wave’s retracement must exceed 61.8% of the previous a-wave.
- The minimum extension in an impulsive wave is 161.8%.
- In a zigzag, the b-wave can’t retrace more than 61.8%.
An Elliott wave chart is full of Fibonacci ratios. Because of the various cycles and time frames, they bring clarity as to where the cycles end or begin as well as help identify the proper patterns, especially during simple and complex corrections.
Check out our video about generalities of Elliott Wave Theory:
Conclusion
The Elliott Wave Theory is full of controversy. While many traders do not believe that a theory developed so long ago can be profitable in the 21st-century currency market, it is part of every serious trading course.
Its secret is that it deals with human behavior, crowd sentiment, and market psychology, and they’ll affect the markets for as long as they exist. It is true that nowadays, robots, the trading algorithms, execute more trades than humans do. However, the human element still exists in the programming, making the algorithms vulnerable to the same bias as manual traders.
Using the Elliott Wave Theory is an art. There’s no holy grail in trading, and this is clearly not the place to look for such.
However, it has the great quality of bringing a structural approach to trading, a logical process not present in other theories or market approaches. As always, money management helps a lot. Proper Elliott counts are the source of fabulous risk-reward ratios far exceeding the classic 1-2 in the business.
Moving forward, the next article covers impulsive waves in detail. We’ll have a look at all extension types, how to interpret them, and how to build powerful trading setups.
