LISTEN TO THIS ARTICLE:
Most technical analysis indicators are oscillators, and retail traders from all over the world build various strategies based on their moves. Because retail traders tend to scalp their way in and out of the market (i.e., trading frequently during the day, aiming for small profits), oscillators present the perfect environment.
Oscillators follow the price but have the advantage of considering multiple periods. Typically, an oscillator considers fourteen periods (e.g., Relative Strength Index), and the bigger the number of periods, the flatter the line or the lines become.
A previous article in this trading academy treated the standard way to trade with oscillators – buying and selling oversold or overbought levels. We’ve covered most oscillators to show their use and also looked at some innovative ways of using it.
This time we introduce a popular concept among all types of traders – divergences. As a rule of thumb, divergences form only against an oscillator. It makes no sense to look for a divergence against a trend indicator.
Divergences in Forex offer an interesting perspective. Because they appear at tops and bottoms, they belong to contrarian trading. By definition, contrarian trading is riskier than trend trading – and this is why divergences appeal so much to traders.
Trend trading is a safer approach to riding markets but requires patience and discipline, skills not common among retail traders. In contrast, trying to pick a top or a bottom is more adventurous and rewarding. Everyone wants to enter a trade as soon as possible, and being a contrarian gives the possibility to ride a new trend right from its start.
This article presents divergences with various oscillators, providing examples of various currency pairs and timeframes. One thing to remember – the market may stay in a divergent mode for longer than the trader remains solvent.
What is a Divergence?
Divergences represent the main reason why technical traders developed oscillators. Because an oscillator considers multiple periods before plotting data, traders use its values and compare them with what the current market price shows.
Most of the time, the two (i.e. the price and the oscillator) show similar conditions, rising or falling together. However, sometimes their movements diverge in the sense that the oscillator no longer follows the price.
The two diverge. Traders always rely on what the oscillator shows for the simple reason that its formula considers more data.
A divergence doesn’t mean that the price and the oscillator move in opposite directions. Instead, it means that the oscillator fails to reach certain levels, while the price does reach them.
The easiest way to interpret divergences is to compare the market moves and wait for the oscillator to do the same. For instance, when advancing, the market price forms a series of higher highs. Often, the price continues to put higher highs, but the oscillator fails to make a new high. That’s when a bearish divergence between the price and the oscillator appears. Or, when the price falls, it does that in a series of lower lows. Sometimes, the oscillator doesn’t confirm the new lower low, diverging in a bullish pattern.
One thing to note before discussing more about bullish and bearish divergences – they are not for conservative traders. Instead, contrarians like them because they offer a reason to enter a market. If you want, divergences offer a much-needed confirmation for traders willing to take a risk against a strong trend.
Bullish and Bearish Divergences
Oscillators were created to spot false market movements. Computers run complex formulas to calculate the present values of an oscillator based on historical prices. When these values differ from what the current price shows, a divergence is said to form.
As mentioned earlier, divergences do not work all the time. Many times the price fails to reverse after one or more divergences form on a chart. When this happens, money management rules exist to contain the potential damage to the trading account.
The idea of a divergence is the same regardless of the oscillator used. But because some oscillators reach overbought and oversold levels faster or slower than others, the concept needs some modeling. Moreover, because not all oscillators show overbought and oversold levels, in some cases the trader needs to adjust the concept of a divergence to what the oscillator provides. For instance, the Momentum indicator does not have overbought and oversold levels, but divergences work very well if we tweak the indicator a bit.
Most of divergences appear at tops or bottoms. Hence, contrarian traders like to see the market diverging from the oscillator or the other way around when they decide to take the other side of the trade.
As always, picking tops or bottoms is risky and is not for everyone. The rule of thumb says that the wider the timeframe, the more difficult to trade divergences with a small account. Therefore, make sure to adapt the size of the trading account and the time horizon for the trade to reach the target depending on the timeframe used when trading divergences.
RSI Divergences
The Relative Strength Index (RSI) is the first oscillator that comes to mind when dealing with divergences. Because it is very popular among retail traders, it appears in many analyses.
Divergences appear when a rising or falling market continues to follow the rules of a trend, but the oscillator no longer does. More precisely, a rising market keeps forming higher highs and higher lows and a falling market forms lower lows and lower highs.
The EURGBP hourly chart below shows a declining market. The price continues to put new lower lows and lower highs as well – it respects the definition of a bearish trend.
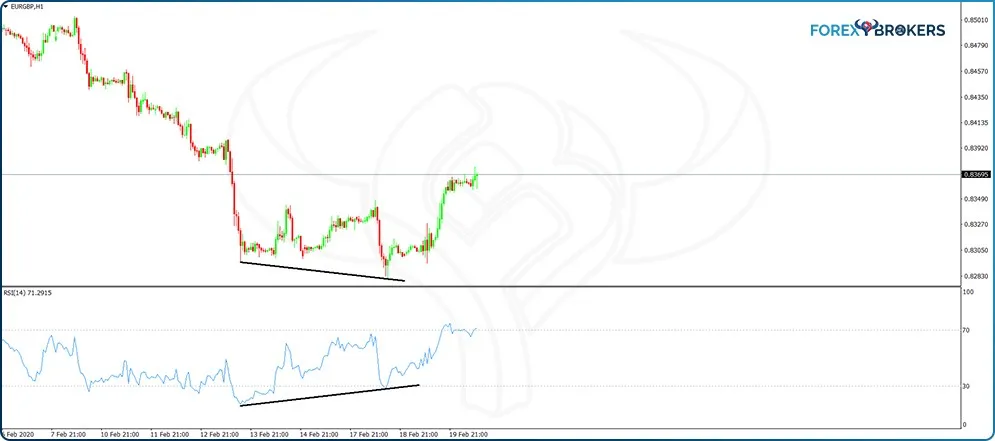
However, at one moment, the EURGBP price makes a new lower low, but the RSI doesn’t confirm the move. It fails to make a new lower low, diverging from the market price.
This is called a bullish divergence because the RSI diverges from the price while in oversold territory. A bullish divergence reinforces the bearish bias given by the price already showing oversold conditions. The opposite is true in the case of bearish divergences.
How to Avoid Being Trapped on the Wrong Side of the Market
The problem with divergences is that they work most of the time – and some other times they fail lamentably. Sometimes the market simply continues in a divergent mode without showing signs of weakness, and the risk is that the trader is trapped on the wrong side of a trade.
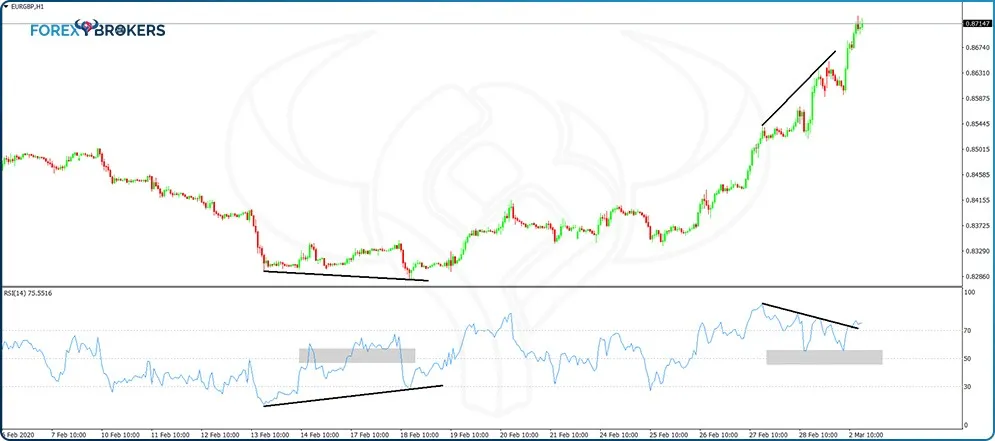
Let’s use the same EURGBP hourly chart shown earlier. After the bullish divergence, the price reversed steeply, and it began forming higher highs and higher lows – typical formations in bullish trends.
But a quick look at the most recent price action in the EURGBP pair reveals something remarkable – the price continued to make higher highs while the RSI oscillator shows a huge divergence. On top of that, the divergence appears in the overbought territory, making it even more appealing for contrarian traders, bears, to step in and sell.
But selling this market proved to be the wrong decision. How to filter for it and avoid being trapped in such a market? The answer comes from editing the RSI by introducing the 50 level. Next, make sure that the RSI level between the two divergent areas exceeds the 50 level. That is, in a bullish divergence, the RSI must retrace above 50, and below 50 in a bearish divergence.
Note the difference between the two examples on the earlier chart. The first one shows a bullish divergence with the RSI traveling above the 50 level between the two levels that define the divergence. But the second one shows a bearish divergence with the RSI not able to retrace below the 50 level. Hence, this is a divergence to ignore. This way traders filter the signals at the expense of having fewer entries but more qualitative ones.
How to Trade Divergences with the RSI
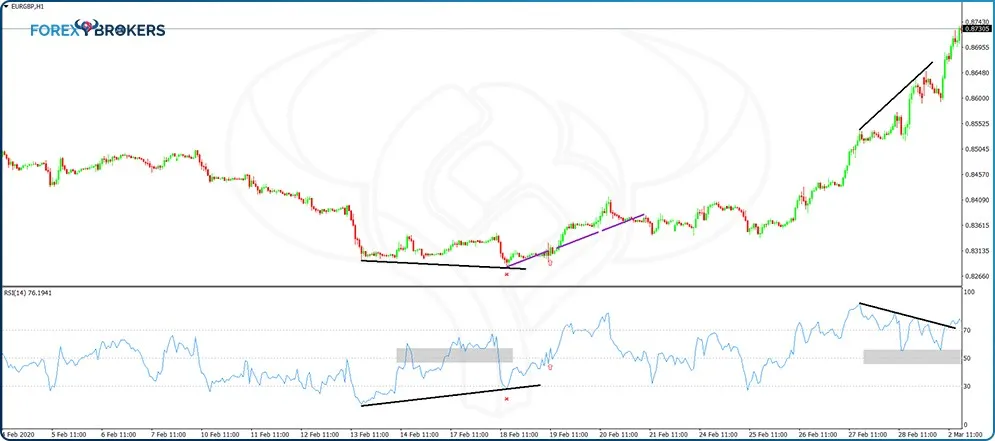
Now that we know how to avoid being trapped on the wrong side of the market, let’s have a look at how to trade the correct setups shown by divergences with the RSI. Because only the first RSI divergence respected the rules described in the previous paragraph, we’ll use it as an example.
As hinted so far in this trading academy, money management plays a key role in the growth of a trading account. One of the unwritten rules of responsible trading is to always set a reward that exceeds the risk by at least two times. The risk-reward ratio born this way protects the account from drawdowns and is said to be appropriate if the reward exceeds twice the risk. Obviously, this is the minimum condition – many traders target three times a reward when compared with the risk.
In the setup above, the entry appears at the moment the RSI crosses above the 50 level again. Next, the stop-loss level is set at the previous swing’s low – the last lower low of the previous bearish trend. Finally, by measuring the risk (i.e., the difference between the entry and the stop-loss levels) and multiplying it by two, traders set the take-profit respecting the 1:2 risk-reward ratio.
In the case of a bearish divergence, the entry signal appears when the RSI moves below the 50 level, while the stop-loss is set at the previous higher-high (usually, this is the highest point in the previous bullish trend).
DeMarker Divergences
The DeMarker oscillator works in a similar manner as the RSI in the sense that it has overbought and oversold levels that look identical. If the RSI moves between 0-100, the DeMarker oscillates between 0-1, with 0.7 and 0.3 levels acting as overbought and oversold, respectively. In the case of the RSI, those levels were 70 and 30.
However, the big difference between the two oscillators is that the DeMarker is faster than the RSI. This means that it reaches overbought and oversold areas much quicker than the RSI, with implications on other trading strategies.
In other words, when trading based on divergences with the DeMarker oscillator, the conditions differ from the ones used with the RSI. For a valid divergence when using the RSI, the idea was to wait for the RSI to retrace beyond the 50 level between the two divergent areas. In the case of the DeMarker oscillator, that is not enough because it reaches overbought and oversold levels faster. To solve this problem, the DeMarker must reach oversold during a bearish divergence formation or overbought during a bullish divergence formation.
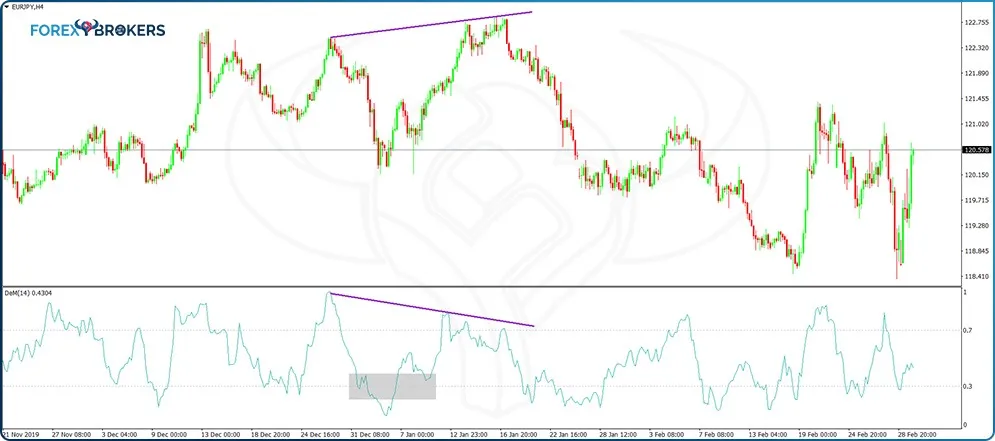
The EURJPY 4h chart from above shows a bearish divergence with the DeMarker oscillator. For a better understanding of it, compare it with the divergence showed earlier with the RSI oscillator.
The highlighted area shows the condition needed for the divergence to be valid. Otherwise, it is too risky to try to pick a top or a bottom using divergences with this oscillator because most of the time, the price continues to remain overbought or oversold without any meaningful pullback.
Here is another example, this time using the recent USDCAD 4h price action. The price continued to rise while the DeMarker dipped all the way to the oversold territory before putting in the divergent level.
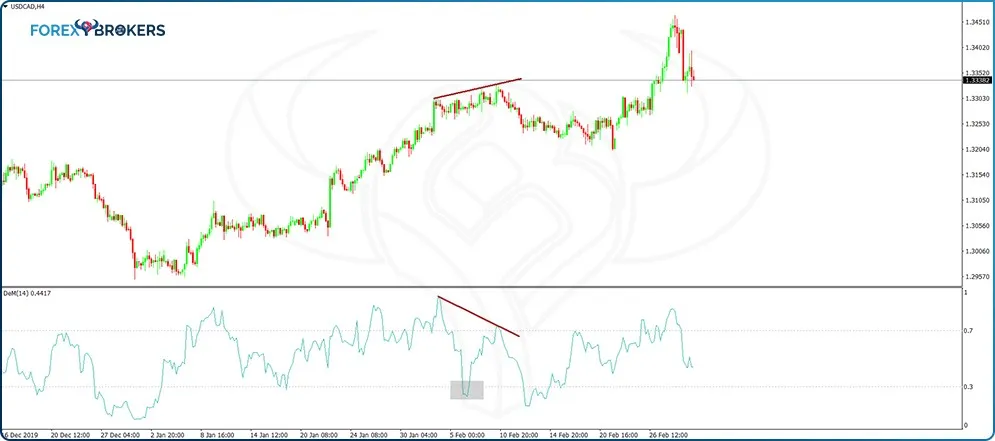
How to Trade Bullish or Bearish Divergences with the DeMarker Oscillator
The USDCAD chart used previously reveals that the DeMarker oscillator is able to travel from overbought to oversold levels without the price retracing even a bit. This does not happen when using the RSI, and this is why the conditions for a valid divergence with the DeMarker oscillator differ from the ones needed when trading divergences with the RSI.
Trading such divergences requires a different approach, too. First, wait for the conditions described so far to reveal a possible trading opportunity. Next, wait for the DeMarker to reach the overbought or oversold area and to come back into the neutral territory before going short or long.
In the example above, the price didn’t return above the higher high formed during the divergence. However, sometimes it may happen as shown below:
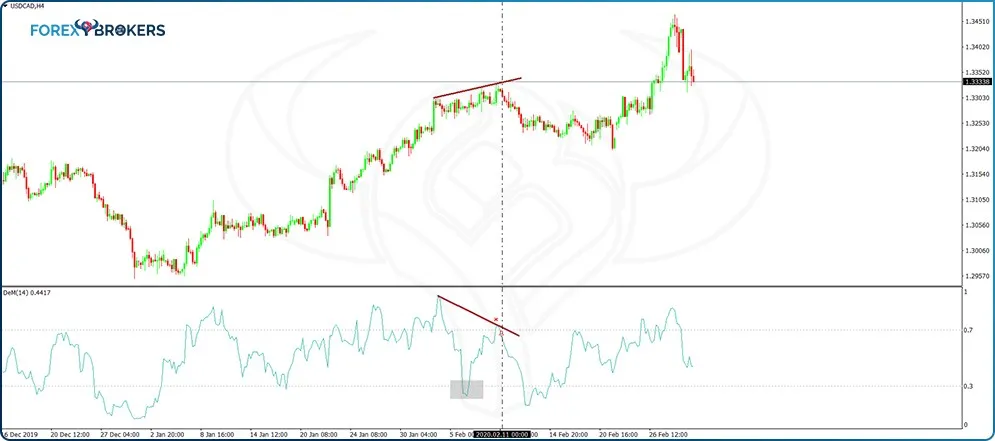
The DeMarker returned to neutral territory, but the price continued to rise. The key here is to set a stop-loss based on the oscillator’s high, and not the price’s high. As explained earlier, setting a risk-reward ratio of a minimum 1:2 is the right way to use a proper money management setup.
MACD Divergences
The MACD oscillator reflects the interaction of different trend indicators applied to the same chart. Its elements (the MACD histogram and the signal line) help traders visualize the potential divergences that form with the price.
The key to interpreting divergences with the MACD oscillator is to focus on the MACD histogram and the actual market price. The two should move similarly in trending markets and diverge when the market forms a top or a bottom or when the overall market evolves in a range.
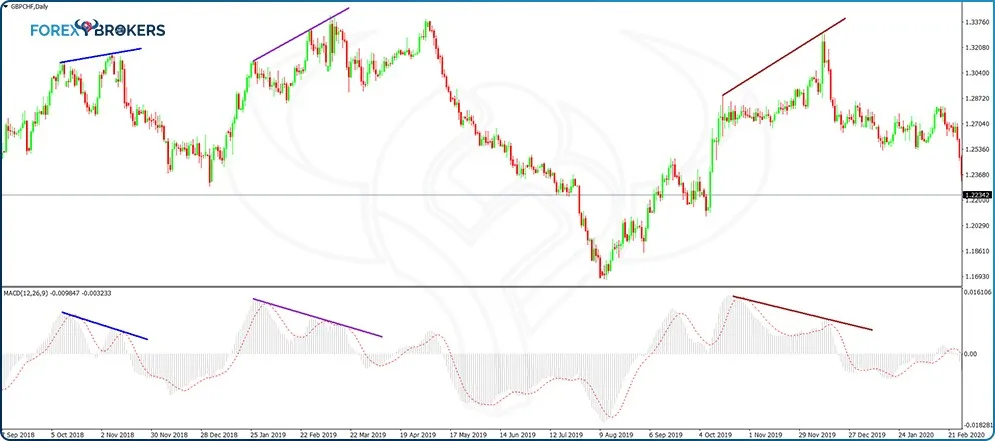
On the GBPCHF daily chart from above, there are no less than three different bearish divergences. All of them follow the same rule – the market makes two consecutive higher highs while the MACD histogram fails to confirm the second higher high. That’s all one needs for a bearish divergence. The oscillator reinforces the contrarian trader’s view that the market is overbought, even though the MACD is an oscillator that doesn’t show overbought or oversold levels.
For a bullish divergence we talk about similar conditions, except that the MACD doesn’t confirm the second lower low made by the price. As a difference between the MACD and the RSI, there’s no overbought or oversold area on this oscillator, and for this reason, the zero level acts as the trigger to entering a trade.
How to Trade Divergences with the MACD Oscillator
When the MACD histogram turns negative (in the case of a bearish divergence) or positive (in the case of a bullish divergence), it means that the divergence ended and a signal to enter the market appeared. However, as the chart below reveals, that’s not always the best entry to a trade, as the market tends to retrace many times after the MACD histogram turns negative.
If we use the moment the MACD histogram turns negative as an entry on the market based on the three bearish divergences presented above, there’s always a market pullback that follows. Providing we set the stop-loss order at the highest point of the previous market swing, the market is unable to reach the minimum 1:2 risk-reward ratio needed to respect the money management rule.
To solve for this, traders wait for a new swing made by the MACD histogram into the positive territory. However, that swing should not exceed the previous MACD high, and on the next cross below the zero level, traders go short.
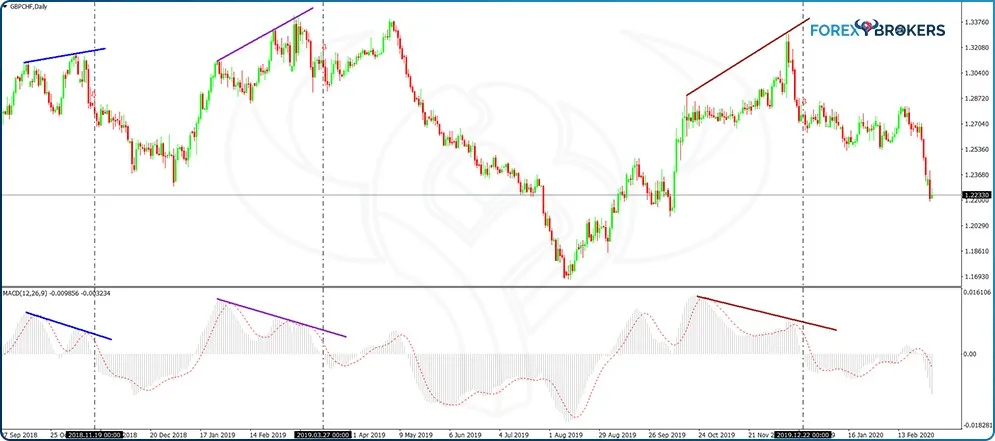
From left to right, the vertical line after the blue bearish divergence shows the MACD turning negative for the first time. Next, the histogram turned positive, but it grew so much that it exceeded the previous lower high of the blue divergence setup. Hence, any short signal on turning negative again should be ignored.
The second divergence shows the histogram turning negative, then bouncing into positive territory, but without breaking the MACD lower highs series (i.e., it didn’t reach the horizontal blue line). Next, it turned back negative – that’s the short entry with a stop-loss at the highs and a take-profit level that respects the 1:2 risk-reward ratio.
Divergences with the Momentum Oscillator
The Momentum oscillator was introduced in a previous part of this trading academy. It moves above and below the 100 level, and we edited the oscillator so that the 100 level becomes visible for easier interpretation.
Just like the MACD oscillator, the Momentum oscillator does not have overbought and oversold levels. It does have, though, a very interesting characteristic – it deviates from the 100 level the more “momentum” exists in the price action. In other words, strong trending markets have the Momentum oscillator going away from the 100 level on the most aggressive moves, only to come back to the level on calmer markets.
Typically, when a market reaction happens when the Momentum oscillator reaches the 100 level again, either the previous trend continues with a new leg in the same direction, or a sharp reversal follows, with the Momentum deviating this time in the opposite side when compared with the 100 level.
Check the EURUSD daily chart from below – it has the Momentum oscillator at the bottom, with the black horizontal line showing the 100 level. It shows six different divergences between the price and the Momentum oscillator, each of them representing an opportunity to trade.
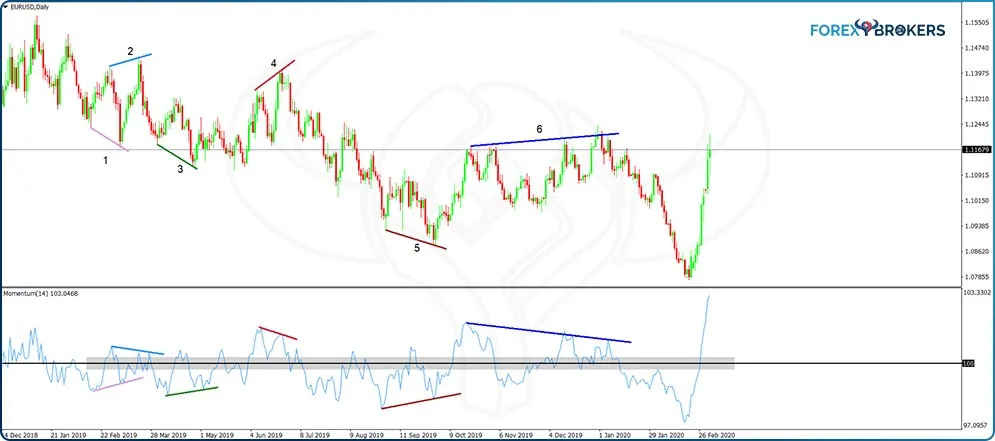
For a better understanding of how the Momentum oscillator works, think of the 100 level as a level that always attracts price. No matter how strong a market swing is, in the end, it’ll consolidate levels, and the Momentum returns to 100.
Trading Momentum Divergences – Examples
The numbers on the chart above show the different divergences that the price formed with the Momentum oscillator. Also, the distinct colors further help in identifying them properly.
All the rules of a divergence remain valid – the market forms lower lows or higher highs, while the oscillator (Momentum), fails to confirm the second lower low or higher high. The grey area marked on the oscillator’s window shows the 100 level and is intended to highlight its importance as a level that always attracts the price.
The chart shows that the market continuously forms divergences, almost one after another. How can they be traded without jeopardizing the account?
One way to properly trade Momentum divergences is to wait for confirmation. That is, after a bullish divergence appears on the chart, wait for Momentum to do two things. First, wait for it to break above the 100 level. Second, it must also break above the previous swing above 100. In other words, the confirmation needs two steps as validation points for a new trade.
- Example nr. 1
The first divergence marked on the chart is bullish. The market forms two lower lows, but the Momentum oscillator doesn’t confirm the second one.
Next, the focus shifts on the two confirmation steps. We see the Momentum moving above the 100 level, completing the first step. However, the move above 100 is not strong enough to break the previous swing, so the second step is not confirmed. Hence, we should ignore the trade.
- Example nr. 2
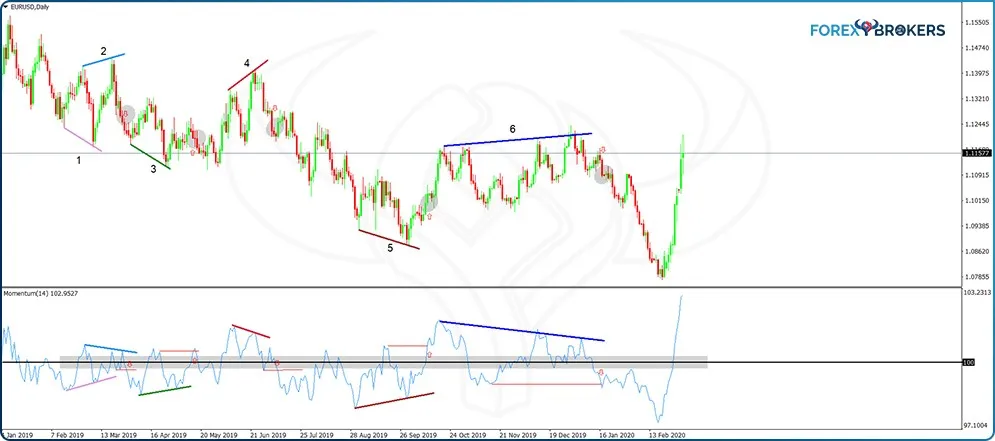
On the move higher, the price on the EURUSD daily chart managed to make a new high. However, the Momentum oscillator didn’t confirm the second high, showing a strong bearish divergence.
The two confirmation steps follow quickly – the Momentum oscillator falls below 100, and, during the move lower, it breaks below the previous swing below the 100 (marked with the horizontal red line on the chart above). That’s the entry on the short side after the bearish divergence with the Momentum oscillator.
- Example nr. 3
This is a bullish divergence as the price makes two consecutive lower lows, but the Momentum oscillator doesn’t validate the second one. Instead, the oscillator moves above the 100 level, and, on its way, it breaks above the previous swing. That’s the entry for a long trade.
- Example nr. 4
On the move higher following the previous bullish divergence, the price forms two higher highs, but the Momentum oscillator stalls at the second one. A bearish divergence forms, and the attention shifts to the two confirmation steps.
Because this is the daily timeframe, confirmation doesn’t come quickly enough for some traders. However, keep in mind that only waiting until the end of the candlesticks’ close will show the true level the Momentum closes on. In this case, it took a few days to validate the bearish divergence and for a proper signal to form.
It can be noted from the divergences presented here that the bigger the divergence (in terms of time), the stronger the market reaction. In other words, the 5th and 6th examples led to a stronger market reaction, as suggested by the fact that the two divergences took longer to form.
Divergences as Continuation Patterns
So far, this article has presented the classic way to spot divergences between the market price and various oscillators. But other types of divergences do exist, including some that aren’t so popular among retail traders.
All the indicators presented so far were used in a similar fashion – to spot false moves made by the price. The traders take their clues from what the oscillator says, and not from the price.
However, another way of looking at divergences is to do the opposite – take cues from the price action rather than from what the oscillator shows. Only this time, the rules no longer involve the series of higher highs and lower lows. Instead, the focus shifts to the other characteristic of trending markets – the higher lows and lower highs series.
Remember that the oscillator’s moves and the price’s moves go hand in hand. When they diverge, a possible trading setup appears.
Under this approach, we use divergences as continuation patterns. It means that a trend must be in place and a divergence as a continuation pattern acts in the same way as any other continuation pattern – ascending or descending triangle, pennant, bullish or bearish flag, etc.
It is worth mentioning that such divergences are not easy to spot on all oscillators. And, they appear less often as the classic ones. For this reason, they require special attention and tend to have good results.
Rules for Divergences as Continuation Patterns
Such divergences are better seen using the RSI. To act as a continuation pattern, a divergence must satisfy two conditions.
First, the market should continue to show the characteristics of a trend. In a bullish trend, that translates into a series of higher highs and higher lows. For a bearish trend, lower lows and lower highs show trending conditions.
Second, the RSI should diverge from the price action. But this time, instead of focusing on the higher highs and lower lows, the focus shifts to the other side of the spectrum – to the higher lows and lower highs.
In a bullish market, look for the price to keep forming higher lows, and for the RSI to contradict – to form a lower low for the second swing. Conversely, in a bearish market, the price action should form lower highs while the RSI should form higher highs.
- Positive Divergences
Divergences as continuation patterns are also called positive and negative divergences. Naturally, positive or negative comes from the nature of the resulting trade – long or short.
The gold chart that follows shows a rising trend – the market forms higher highs and higher lows relentlessly. From left to right, we see the price forming two consecutive higher lows, while the RSI forms two lower lows corresponding to the same market move.
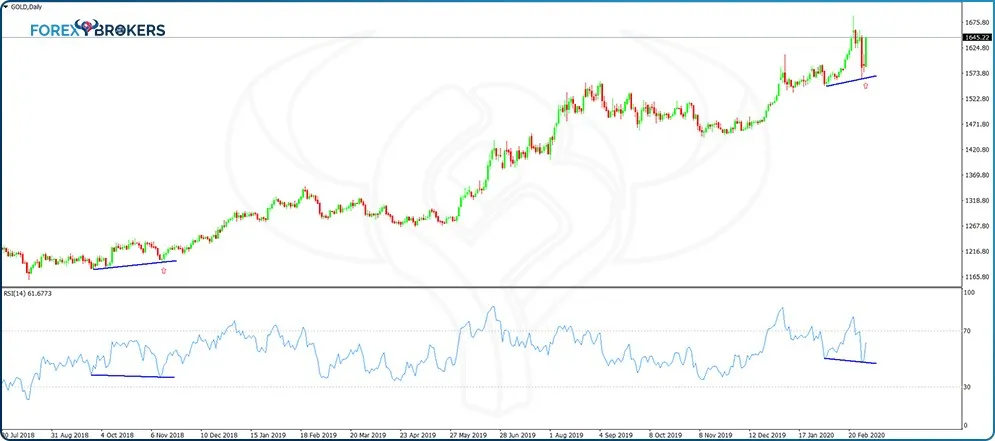
That is a positive divergence, and traders go on the long side by the time the first green candlestick forms after the divergence. For the target, the standard way to set it is to use the classic 1:2 risk-reward ratio.
For that, first measure the distance from the entry level until the lowest point in the divergence. Next, wait for the first green candlestick to close – in the case of the daily timeframe like in the example above, wait for the daily candlestick to close before going long. Finally, project the distance calculated earlier twice from the closing of the first green candlestick.
On the same gold chart, the recent price action reveals a similar situation. The price continues to make higher highs and higher lows – a typical formation in a rising market. At the same time, the RSI diverges from the series by forming lower lows – a positive divergence that triggers a long trade by the time gold manages to close a green candlestick.
To trade it, place the stop-loss at the first divergent swing. Next, measure the distance from the stop-loss to the closing level of the first green candlestick. Finally, project that distance twice to the upside from the entry level.
- Positive and Negative Divergences Measured Move
There is another way to set the target for positive and negative divergences. More precisely, this approach reveals the measured move, or the minimum distance the price must travel after such a pattern forms on a chart. Often, the measured move exceeds the 1:2 risk-reward ratio, giving the trader an incentive to aim for higher profitability.
The AUDUSD 4h chart below shows the perfect example – the pair kept rising while the RSI formed two lower lows. A positive divergence formed, and one approach to trade it is by using the method described so far.
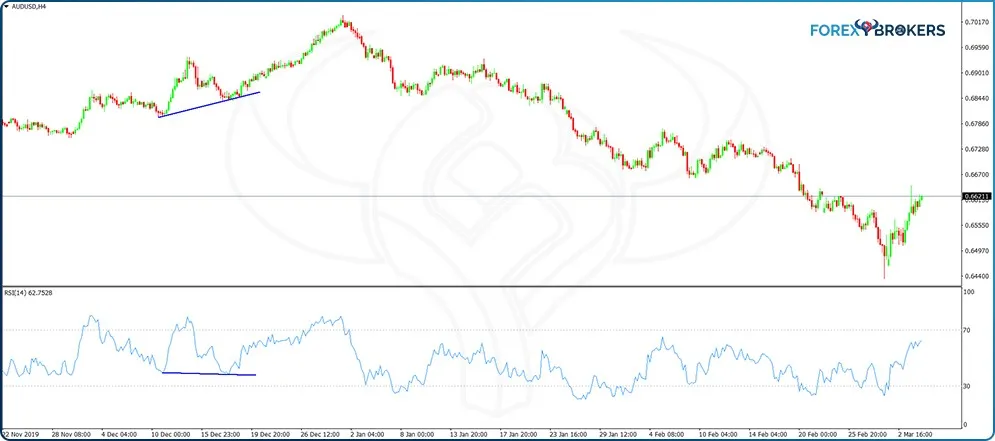
For traders aiming at a more than 1:2 risk-reward ratio, the positive divergence’s measured move might help. To calculate it, first draw two horizontal trendlines marking the highest point in the positive divergence and the second swing (the second higher low). Next, copy that distance and project it from the highest point in the positive divergence. That’s the measured move, or the minimum distance the price must travel to the upside to confirm the continuation pattern.
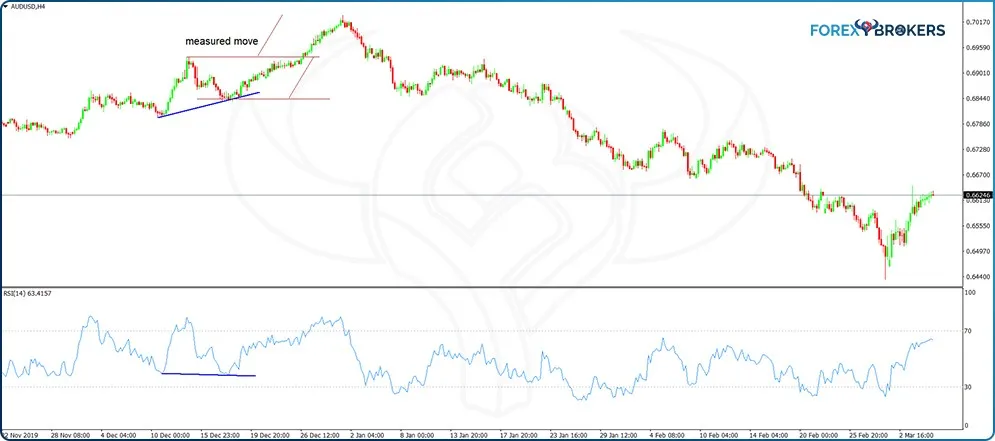
Just like in the case of classic continuation patterns (e.g., bullish and bearish flags, ascending and descending triangles), positive and negative divergences have a measured move, too. It doesn’t mean that the price stops advancing or declining by the time it reaches the measured move – it just shows the minimum level to be reached after the trend resumes.
If we compare the measured move with the classic 1:2 setup explained earlier, we see that the new risk-reward ratio exceeds 1:4 if we let the price go for the measured move, instead of closing the trade when the 1:2 ratio was reached.
Conclusion
Divergences provide powerful trading setups. As this article showed, the concept of a divergence remains the same when using various oscillators, but the way to trade divergences differs based on the oscillator used.
To make the most of divergences, one needs to first understand the oscillator and how it is built. The RSI, DeMarker, MACD, or Momentum – they may show similar divergences, but trading them differs completely. Other oscillators do show divergent levels too. In some cases, a similar approach works. However, the reason for choosing the four oscillators presented in this article is that they are to be found on any trading platform under the default category, and they are powerful enough to provide strong technical signals.
Positive and negative divergences do not form as often as classic ones. But when they do, the measured move itself often gives trades in excess of 1:2 risk-reward ratios.
All in all, trading divergence is a purely technical setup and works on all timeframes, currency pairs, and financial markets. The rules described here, and the oscillators used (the most popular ones, to be found on all trading platforms) can be used when trading divergences on any financial instrument.
The advantage of trading purely technical setups is that traders avoid the emotional rollercoaster. Combined with proper money management rules, technical setups like trading bullish or bearish divergences with various oscillators are enough to constantly grow a trading account.