The Elliott wave theory combines a set of rules to identify impulsive and corrective waves. Put together, the waves form cycles of various degrees. Interpreting the different cycles is possible only by analyzing them on the different time frames in which they form.
This is where top/down analysis helps. It deals with analyzing time frames using the Elliott wave theory, from the bigger to the smaller one.
However, some tricks exist. For instance, it does not make sense to use the Elliott wave theory on a time frame smaller than the hourly one. The reason is that the market moves very fast on smaller time frames that the Elliott trader has no time to update the charts.
Therefore, one of the rules of the top/down analysis is to stop on the hourly chart or even on the four-hour time frame. Counting waves and trading with the Elliott theory belongs to swing trading—the market needs time to finish five-wave impulsive moves or three-wave corrective ones.
The rules set by Elliott build a logical approach to trading a market. A top/down analysis reinforces the logical process, making it easier to spot the cycles of different degrees that Elliott envisioned almost a century ago.
We should be grateful today that trading platforms make it possible to look at the current price from different perspectives—hourly, four-hourly, daily, weekly, or monthly. This way, the grand cycles, supercycles, and so on, belonging to the Elliott wave theory, are easy to spot and interpret.
The easiest way to understand the concept of a top/down analysis and show its importance is to provide a step-by-step example of how to build one. Therefore, this article starts with laying down the color code needed for counting different cycles, continues with the rules, and ends with a complete example.
Rules of a Top/Down Analysis
A top/down analysis always begins with the biggest possible time frame. In most cases, this is the monthly time frame, but often only the information provided by the monthly chart is not enough.
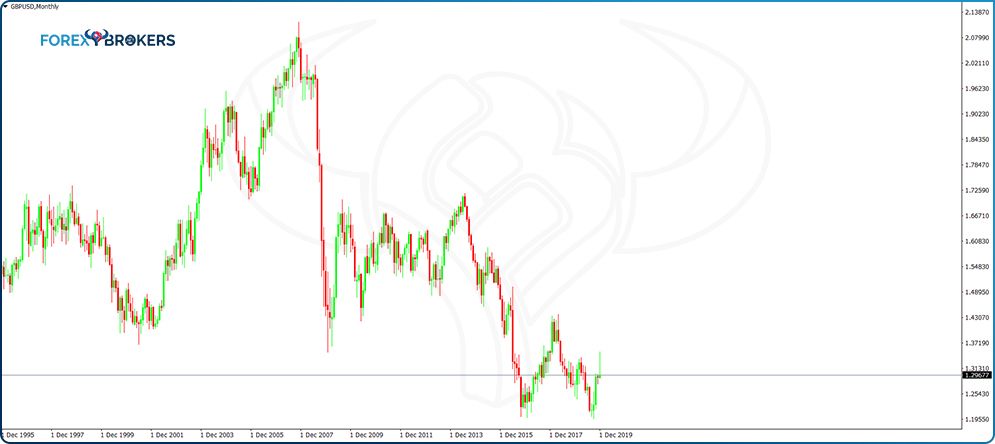
All MT4 platforms offer the monthly time frame on all currency pairs, but the information is often incomplete. For example, open the GBPUSD monthly chart on an MT4 platform. Regardless of the broker used, the monthly chart only shows data from 1995.
In some cases, the data is enough to start a top/down analysis, but in this case, the cycles of a larger degree, as envisioned by Elliott, do not appear on the chart. Both the GBP and the USD have a history dating well before 1995; thus, additional data are needed to interpret the Elliott cycles correctly.
Ideally, all historical data should be part of a top/down analysis. To gather it, the trader must use innovative ways.
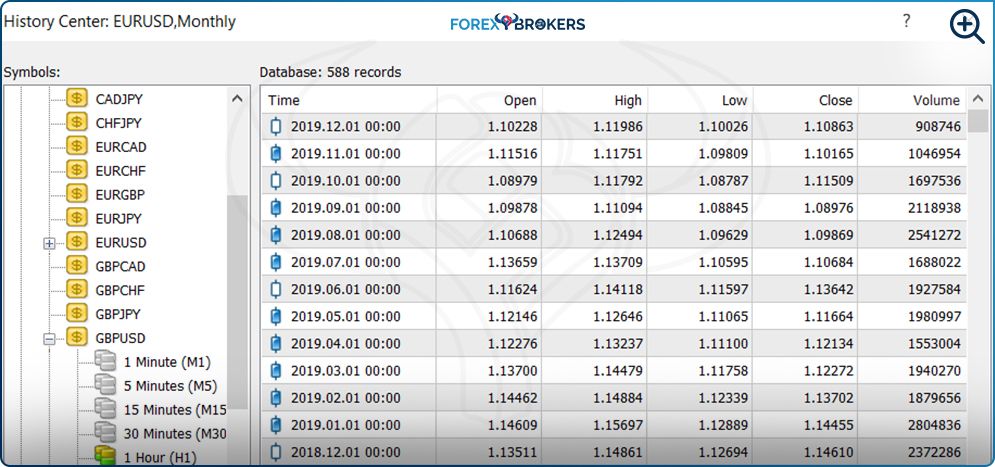
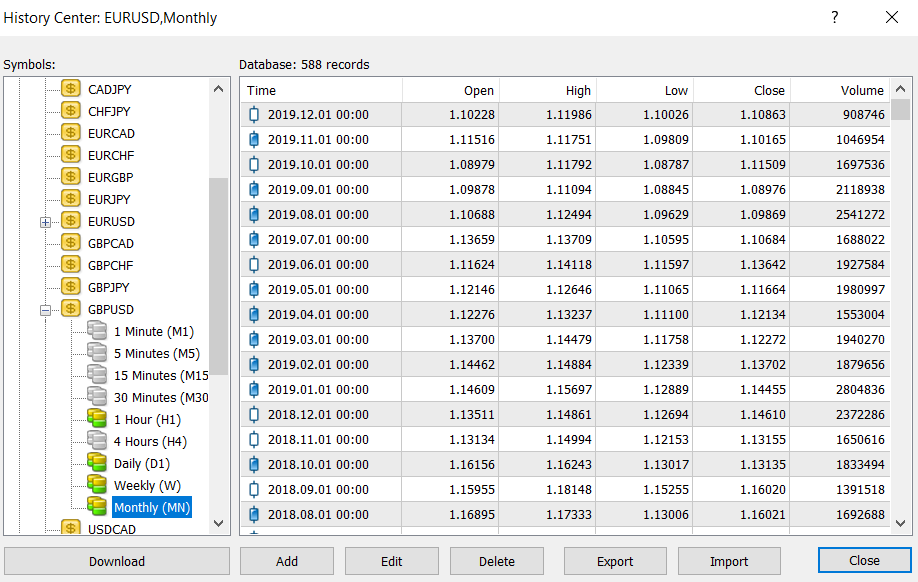
First, check the history center on the MT4 platform. Under the Tools tab on the main menu, the History Center enables traders to download additional data to a chart on the MT4 platform. Find the currency pair interested in, select the time frame, and then click the Download tab on the bottom left of the pop-up window. If there are any additional data on the MetaTrader community, the platform will start importing it, and the charts will update immediately.
Alternatively, there is the possibility to import historical data using the Import tab. Some historical data providers sell the data on various financial markets under various formats, most of them compatible with MT4.
Second, if there is no data available on the MT4 platform and cannot be imported either, the thing to do is to start researching the Internet for historical data on various currency pairs. Some websites provide historical data stretching hundreds of years back, and it is useful to interpret the supercycles as Elliott intended.
Color Code to Identify Different Cycles
Elliott used numbers and letters to count waves: 1-2-3-4-5 for impulsive waves and a-b-c-d-e for corrective ones. In addition, there is the omnipresent x-wave, another corrective structure.
The original Elliott work also uses other letters for some corrective waves—w, y, and z. But for the sake of simplicity, they disappeared from most of the counts, as they represent the x-wave in different structures.
For instance, in a double combination, after the first a-b-c and before the x-wave, Elliott also added w to further emphasize the importance of the first corrective structure. Also, the second correction part of the double combination would be labeled y. Finally, the third correction, when it formed, was labeled with another letter, z.
Remember that Elliott built the theory on the stock market in the first half of the 20th century. Since then, new financial products have appeared, and trading them requires different approaches (e.g., currencies, oil). But because the Elliott wave theory interprets human behavior and its reactions to previous market moves, Elliott counting works on every market, provided that the trader respects the main rules Elliott set.
One of the drawbacks of the original Elliott theory was the fact that too many numbers and letters appeared on any given chart. Elliott used capital letters for supercycles, small ones for so-called minor cycles, and so on. When multiple cycles of various degrees ended at the same point, the count showed numbers and letters simultaneously, confusing the trader.
The MT4 platform provides a simple solution to count different cycles. For each cycle, start with a bigger font size for the number or letter and a different color to identify each cycle. If 1-2-3-4-5-a-b-c is a cycle on the monthly chart, it may be the first wave of a larger degree followed by the second wave. The next wave, the third, has 1.2.3.4.5 of the same degree as the first one.
Top/Down Analysis Example on the EURUSD Pair
Maybe the previous paragraph is confusing, and for this reason, it is important to use practical examples to show the steps to build a top/down analysis. In fact, these are the steps to trade with the Elliott wave theory, as without a proper analysis on the bigger time frames there would be no trading setup on the lower ones.
We will use, for our example, the most popular currency pair—the EURUSD. Traders love it for many reasons; it has the tightest spread of all the currency pairs part of the forex dashboard, it is very liquid, and historical data is available on the MT4 platform.
To see it all on the monthly chart, just follow the steps mentioned earlier in this article and download the EURUSD available data on the monthly chart, using the History Center tool. The chart shows data all the way back to the 1970s, revealing all the EURUSD history in one time frame.
For those wondering how it is possible that the chart shows data from the 1970s while the Euro as a currency was introduced only in 1999, the answer lies in details. The Euro is the common currency for many Eurozone states and reflects the value of the different currencies that existed before its creation—German Deutsche Mark, French franc, Spanish peseta, Italian lira, and so on.
The chart therefore calculates the historical values of the Euro based on the historical data of all the national currencies part of the Euro. In the case of the EURUSD pair, the chart reflects the value of all the currencies prior to the Euro formation and how they traded against the USD. It is an approximation, but in terms of Elliott waves and understanding of cycles in Forex, it represents a fair representation of historical financial data in the Eurozone space.
Monthly Time Frame — Interpreting the Bigger Cycle
After downloading the data, the MT4 monthly chart shows the entire EURUSD price structure since the 1970s. For the Elliott trader, this is as good as it gets in terms of identifying the different cycles of various degrees.
The top/down analysis presented in this article on the EURUSD pair has the purpose of showing how to count different waves and how to build the logical process. This trading academy did not cover all the patterns and concepts in the following charts yet. For this reason, the best way to fully understand these charts is to read all the Elliott wave theory articles in this trading academy, put all the information together, and come back to the charts in this article. Then the count will make sense. For now, let us focus on the principles of a top/down analysis.
A central concept of the Elliott theory is that the analyst should never count the current price action. In fact, no one knows what the market forms next—but the Elliott theory offers an educated guess about future levels based on what happened on the left side of the chart.
For this reason, any interpretation of a chart begins from the left side of the chart (historical prices) and continues to the right side of it (future prices) or from what we know to the forecast. This is valid only for the biggest time frame of the top/down analysis—in this case, the monthly chart.
After analysis on the monthly chart ends, the trader moves to the lower time frame but does not count anymore from the extreme point on the left side of the chart. Instead, the analysis continues from where the monthly one remained.
Setting Up the Cycles and the Color Code
The MetaTrader platform offers an interesting feature for the Elliott trader—the text. Used in different sizes and fonts, written numbers and letters using the Text option on the MT4 are cycles of various degrees.
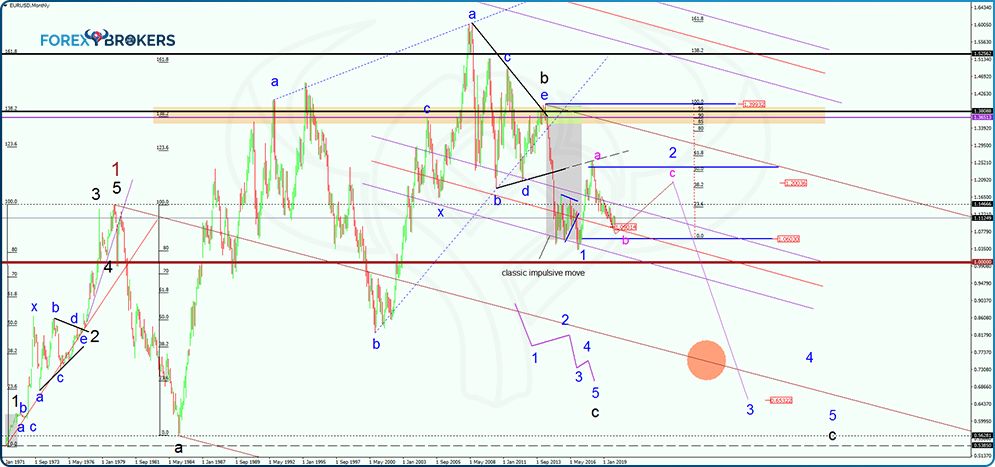
From left to right, the EURUSD earlier chart shows different cycles. Where the brown number 1 appears on the chart, the EURUSD finished an impulsive wave. To mark the cycle, the text is font size 28—the biggest cycle on the analysis.
The number is a symbol of an impulsive structure up to that point, of a lower degree, marked with the color black and font size 24. The second wave of this degree (black) is a complex correction, a running one, illustrated in blue and font size 20.
This means that at the end of wave 1 in brown (the bigger cycle), an impulsive move of a lower degree completed. What follows is the correction of the impulsive wave in black. According to the count, waves a and b in black are already complete, and now the market forms a c-wave.
The b-wave in black is a double combination illustrated in blue and font size 20—a-b-c-x-a-b-c-d-e. As you should know by now, the b-wave is always a corrective wave.
So let us use the logical process to try to identify what the EURUSD might form on the monthly chart next. Because we already have a five-wave structure completed (in brown), everything that follows after wave 1 in brown is the correction of it.
The next quest is to find out what kind of a correction follows—simple or complex. For this, a step-by -step approach is needed.
More Details on the Logical Process of a Top/Down Analysis
If the first wave in brown ended, it means the second one of the same degree follows. According to the rules of an impulsive wave already covered in this trading academy, the second wave cannot retrace beyond the start of the first wave.
The retracement we see on the chart, therefore, can only be the a-wave of a lower degree—black. Because it retraced so much into the first wave’s territory, it is literally impossible for the a-b-c correction in black to be a zigzag, as it would invalidate the impulsive wave of a larger degree.
Moreover, no complex correction starts with a triangle, and an individual triangle cannot appear as the second wave of an impulsive move. Therefore, the only possibility on the table is an a-b-c in black that is a flat. Furthermore, with waves a and b already completed, what follows is the c-wave of a flat or an impulsive wave starting from the end of the double combination (end of the b-wave in black).
Further into the logical process, we need to see what kind of a flat pattern the EURUSD forms. The key here is the b-wave.
The minimum retracement for the b-wave in a flat pattern is 61.8% of wave a. The more it retraces into the a-wave’s territory, the more the flat changes.
We notice the b-wave ends way beyond 161.8% of the previous wave a and settles above 138.2%. It means this is a flat with a strong b-wave. In this category, three types of flat patterns exist—irregular flat, irregular failure, and elongated flat.
Discarding the Irregular Flat
The a-b-c structure in black cannot be an irregular flat. In such a pattern, the c-wave retraces the b-wave completely. Even more, it exceeds 123.6% of it.
But if it does that, it means the price goes beyond the start of the first wave of the larger degree (in brown)—this is not possible in an impulsive structure.
Therefore, an irregular flat considering this structure is simply not possible. For such a scenario, we should discard it.
This is a great place to reinforce once again the tricky nature of an irregular flat. Such patterns do not form that often as many would believe.
For the pattern to be valid, the b-wave must fully retrace the a-wave, and the c-wave must fully retrace the b-wave. In addition, the move that follows goes the opposite direction.
Discarding the Elongated Flat
In an elongated flat pattern, the c-wave is way longer than the previous b-wave. It means that the c-wave in black would exceed the start of the first wave of a larger degree (1 in brown), invalidating the entire Elliott count.
Another thing to consider when interpreting a possible elongated flat is the place where it usually appears. It rarely forms as the second wave of an impulsive move simply because the elongated wave (the c-wave) threatens to move beyond the start of the impulsive wave of a larger degree.
Instead, elongated flat patterns appear extremely often during triangular formations. They form as the entire leg of a triangle or only as part of a leg of a triangle.
The Case for an Irregular Failure
The only pattern left to consider is a flat with an irregular failure. Its main rule is that the c-wave is shorter than the b-wave—which bodes well with our analysis in the sense that the c-wave will not move beyond the first wave.
As the name suggests, the c-wave “fails,” signaling a countertrend strength. Usually, patterns with failures caught most traders on the wrong side of the market—this is why they show a countertrend strength.
But on the EURUSD monthly chart, there is no such thing as being caught on the wrong side of the market because there is enough time to interpret the market. In other words, traders have no rush considering all the elements of a proper analysis before counting the waves.
Status of the C-wave
A good question at this point is whether the c-wave in black ended. Where the first wave in blue appears on the chart, one may say that is the end of the c-wave in black. Thus, the entire a-b-c in black is completed, and the next task is to determine if the market forms a complex or a simple correction.
For the a-b-c in black to be simple, the price action to follow must fully retrace the c-wave in less or the same time it took to form. We clearly see on the chart that this is not the case—meaning that a complex correction forms in the case that the c-wave in black ended where the first wave in blue appears.
But such a possibility is unlikely. The move lower from the end of the b-wave in black is too small in comparison with the previous waves a and b of the same degree.
Moreover, it formed a limiting triangle before correcting, signaling it is only the first of a five-wave structure to follow. In other words, the market seems to be in the second wave blue part of a 1-2-3-4-5 structure that completes the c-wave of a flat with an irregular failure.
As the chart shows, by the time the impulsive wave ends, the EURUSD should be much lower than the current levels. However, always consider the time element as well. Because this is the monthly time frame, it could take many years before the second wave in blue ends, and we do not know if it will be a complex or simple correction.
Nevertheless, the top/down analysis so far is helpful, as it tells us where the market is—in a second wave of an impulsive structure that should end the c-wave of an irregular flat.
Weekly Time Frame
Few people trade on the monthly chart because a trade takes a lot of time. Usually such traders invest over a large period and have the patience and resources to wait for the price to reach the target.
The purpose of a top/down analysis is to interpret the market from the bigger time frames to the ones that give actionable setups. Therefore, when there is no more to be done on the monthly time frame, the trader moves with the analysis on the lower time frame—the weekly chart.
However, sometimes it is best to see the market structure in more detail. In other words, before looking at the weekly time frame, go on the daily one and zoom out to the maximum. If there is enough space on the screen to interpret the last market move from where the monthly chart analysis ended, it is best to use the daily time frame and simply skip the weekly chart. Next, when even more info is needed, you can zoom out to find out more details.
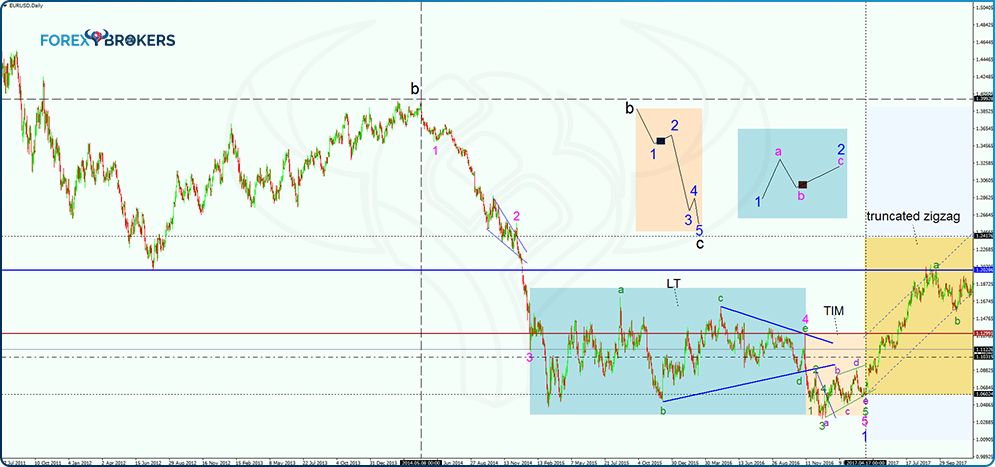
This is the case with the EURUSD top/down analysis. Instead of continuing with the weekly chart from where the monthly analysis ended, by zooming on the daily time frame, a clearer picture appears.
The vertical line’s purpose is to show where the analysis started and where it ended on the bigger time frame. The b-wave in black appears on the left side of the vertical line and shows the wave that ended on the larger time frame.
It is of great help to always have the overall scenario on your mind. For this reason, a good practice is to draw the analysis from the bigger time frame on the lower one.
In the EURUSD example, the two shapes on the upper half of the chart show the expectations for the medium- and long-term perspective. Moreover, the small black squares show where the price currently stands.
Therefore, according to this EURUSD top/down analysis, the market currently evolves in the second wave of an impulsive structure. Furthermore, the second wave seems to be a flat with a c-failure, and the c-wave already started.
Coming back to this time frame, from the b-wave in black, the EURUSD developed a five-wave structure. The second wave (in pink) ends well below the first wave’s end, a running correction. But even more important is the fourth wave in pink. The EURUSD pair formed a limited triangle (more about this pattern later in the trading academy) that broke lower right after the 2016 U.S. Presidential Election. After that, a terminal impulsive structure limited the downside, and the EURUSD bounced.
The critical decision for the Elliott trader here is to interpret the degree the impulsive move lower correctly belongs to. As explained earlier in the article, it cannot be the c-wave of a flat but only the first wave of an impulsive move of a lower degree. This makes the current price action of a corrective wave harder to analyze.
Daily Time Frame
A quick combination of the chart below and the previous one shows the complete price action after the b-wave in black ended. To build a forecast on the right side of the chart, the correct interpretation of all market moves is necessary.
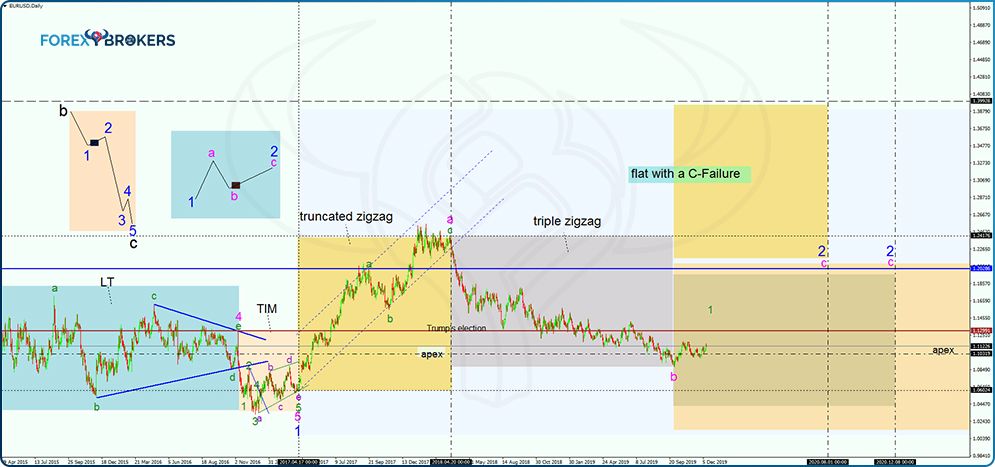
As the first wave in blue ended, the second one started. However, the move to the upside from almost parity to 1.25 is not impulsive—we cannot see any five-wave structure, so it must be corrective.
The logical process begins again. What kind of corrective move—simple or complex? If it is simple, the future price action must confirm it. If not, we must determine the true nature of the complex correction.
Between waves 1 and 2 in blue, another a-b-c forms of a lower degree—in magenta. We stated earlier that wave a is not impulsive, which means that the a-b-c in magenta is not a zigzag and cannot be part of a triangle. The only other option is a flat pattern.
But for the flat pattern, the b-wave must retrace beyond 61.8% of the previous a-wave. As the chart shows, it just reached the 61.8% level during the second half of 2019.
For the a-wave in magenta on the chart above, the market formed a truncated zigzag. This further reinforces a retracement beyond 61.8% because a truncated zigzag is always retraced by the next market move by at least 80%, and in many cases, a full retracement follows.
Counting the Truncated Zigzag
On the lower time frame, the truncated zigzag becomes evident. In a zigzag, both waves a and c are impulsive, and only the b-wave is a corrective structure.
Moreover, in a truncated zigzag, the c-wave’s length is smaller than 61.8% of the previous a-wave. Also, a zigzag does not channel (meaning a simple zigzag should not end at the opposite side of a channel). In this case, while it appears it is channeling, the end of the truncated zigzag is nowhere near the opposite side of the rising channel. Therefore, the simple zigzag is not channeling.
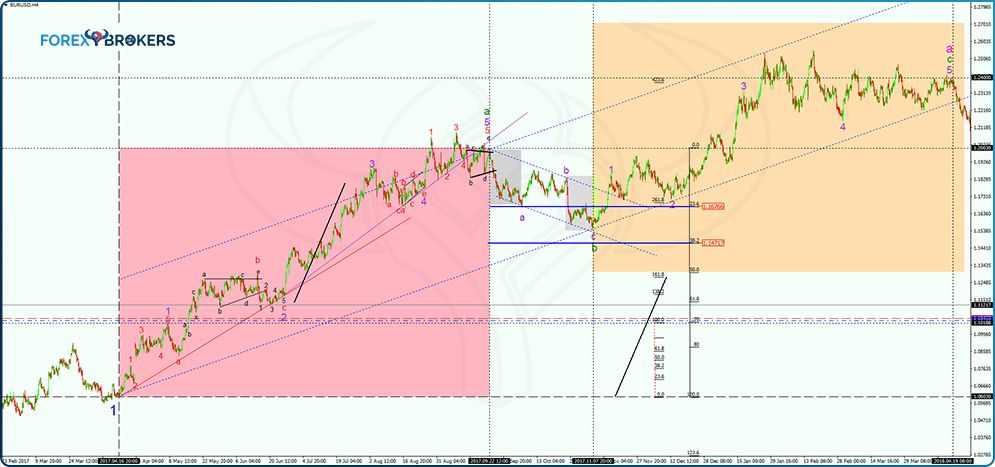
This is a great time to have a close look at the Elliott count on the chart above. Also, make sure you have read and understood the rules of impulsive and corrective waves. Because a zigzag has two impulsive waves and one corrective wave, it is good to put theory into practice by checking the validity of the count.
For instance, in a zigzag, the b-wave retraces most of the times between 23.6% and 38.2% of the a-wave’s length. Therefore, by the time the a-wave ends and its five-wave structure is obvious, the Elliott trader must find out the 23.6% and 38.2% using the Fibonacci retracement tool available in any trading platform. If the zigzag thesis is valid, the price should reach the retracement area mentioned in the previous paragraph and bounce from there—which is exactly what happened.
Confirming the Simple Correction
The beauty of trading with the Elliott wave theory is that the next market move must confirm each decision. For instance, if we say that the market ended a truncated zigzag as a simple correction, the pattern must be confirmed by the price action that follows.
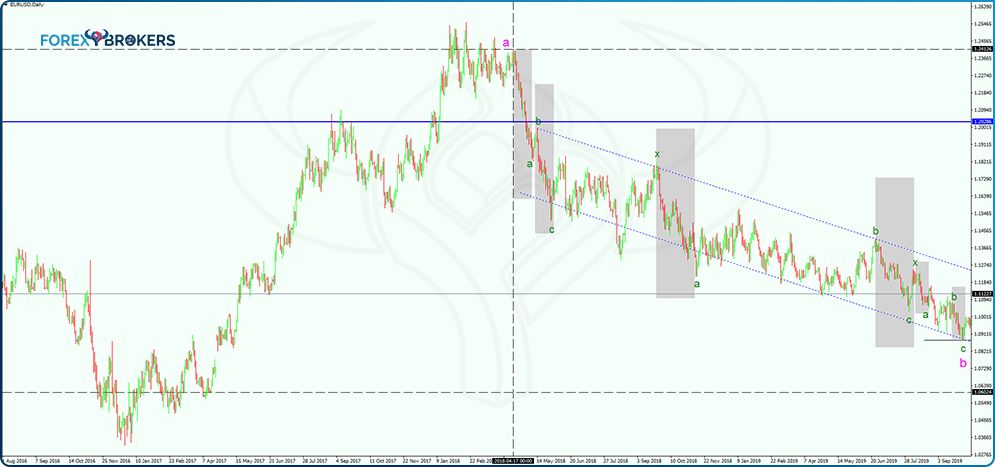
In other words, by the time the a-wave in magenta ends (or the truncated zigzag completes), the first thing to consider is to measure the time it took for the c-wave in green to form. To do this, just use the shape on the MT4 platform, measure the time for the c-wave in green, and project it from the end of the a-wave in magenta. The price must fully retrace the c-wave in less than the time it took to complete.
The sharp drop that followed on the EURUSD pair did not stop until the truncated zigzag was confirmed as a simple correction. Armed with this info, the trader now knows the truncated zigzag scenario was validated by the market, and the logical process continues—a truncated zigzag is always retraced a minimum of 80% of its length.
Therefore, there is more weakness to expect on the EURUSD pair, and the path of least resistance is to sell all the bounces the pair made after the truncated zigzag’s confirmation. Furthermore, because wave a in magenta is corrective (truncated zigzag), the b-wave must be corrective as well.
In other words, the expectations were that the EURUSD pair should retrace a minimum of 80% of the previous wave a in magenta and in a corrective fashion. It did just that, as it formed a triple zigzag—a corrective pattern that stretched beyond the 80% retracement level.
Setting Up a Trade
After the third zigzag part of the triple zigzag, the EURUSD’s decline ended. Later in the trading academy, we will cover truncated zigzags more—one key aspect of it is that it channels very well and ends at the opposite edge of a falling or rising channel, depending on the trend.
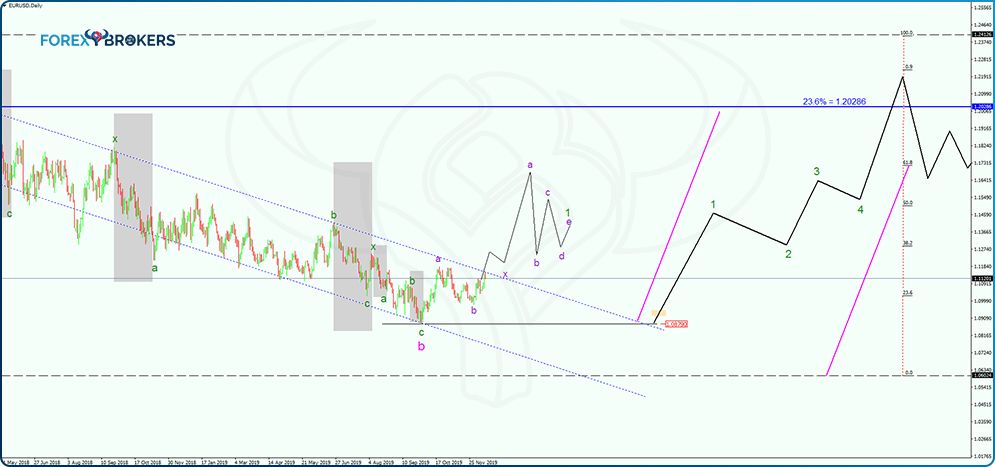
At this point, the EURUSD completed two corrective waves after the impulsive move that marked the drop from the 1.40 area to the 1.06 area. The two corrective waves, a and b in magenta, belong to a flat pattern. Therefore, the move to follow must be an impulsive structure, labeled with numbers.
We introduce here another term for impulsive waves—terminal impulsive ones. This academy will have an article dedicated to these structures, so at this point, it is worth just mentioning that the EURUSD is expected to have a bottom in place where the b-wave in magenta is around 1.09 and to start a terminal impulsive wave toward 1.20.
The overall a-b-c in magenta should be a flat with a C-failure—terminal impulsive waves are the favorite patterns that consume price without necessarily damaging levels. The chart above shows a forecast for the terminal impulsive structure, but any corrective structure is possible—yes, corrective, because in a terminal impulsive wave, all segments are corrective, despite the fact that the Elliott trader must use numbers.
A trade at this point should have a stop-loss at the b-wave in magenta (1.0870) because no parts of an impulsive move (terminal or classic) should retrace beyond the start of it. As for the take profit, simply measure the distance from the entry-level until the stop loss and project it on the right side of the chart to obtain a two or even three times that distance. This way, the risk–reward ratio helps cover for the unsuccessful trades.
Check out our video about Elliott Waves’ Top Down Analysis:
Conclusion
A top/down analysis using the Elliott wave theory keeps the trader on the right track. This is especially true if the trader is familiar with using the logical process characteristic for the theory.
To sum up, a top/down analysis always starts from the biggest time frame and ends at the smaller one. Because the currency market moves very fast, using the 1h chart is not recommendable unless there is a particular pattern the trader wants to double- or triple-check.
In a top/down analysis, the count on the lower time frames continues from where it ended on the previous time frame. Each segment that follows should integrate perfectly in the top/down analysis, as all waves of various degrees belong to the same picture.
The logical process helps eliminate scenarios/patterns until there is no room on the chart but for the right Elliott count. This way, when reaching an actionable timeframe (daily or 4h), it is easy to build a trading setup with a proper stop-loss and take profit. Also, integrated with money management and clear rules of when to enter and exit the market, trading with the Elliott wave theory is the source of great trading setups.
