LISTEN TO THIS ARTICLE:
Gaps in the Forex market are well-known situations that often appear in various markets. Most often, gaps appear on the stock market, due to the fact that it closes each day.
Due to earnings announcements or other internal or external news, a company’s stock price often gaps higher or lower at the next day’s opening. The gap is viewed on the cash market, and the chart simply reveals an empty space between the previous day’s closing price and the new day’s opening one.
A gap, therefore, appears when the opening level of a new candlestick differs from the previous candlestick’s closing level. The bigger the impact of the market news, the bigger the gap.
The concept of a gap appeared for the first time on the stock market, but the currency market gaps too. However, gaps are not that common on the FX market, but still, they do form and their interpretation is similar to the gaps that form on the stock market.
The Forex market gaps are unfortunate events for traders. The biggest problem with gaps is that the brokerage house cannot execute pending orders – whether that is to buy, sell, to take-profit or to stop the loss. Hence, the broker will simply execute the order when there is an actual market – more precisely, at the opening level.
Another issue with gaps is that most of the time they form over the weekend. Sometimes important events take place on Saturdays and Sundays, and Monday’s opening reveals their impact.
Because trading is light on Monday’s opening, trading conditions are not favorable for trading. Hence, when brokers execute the orders, they do so at the best possible price – but prices are rarely good under these conditions.
In this article, we will treat gaps and their interpretation in technical analysis. However, the focus remains on the currency market.
Gap Particularities When Trading Currencies
One interesting particularity when dealing with Forex gaps is that the timeframe has no importance in their interpretation. Usually, the timeframe is a game-changer in technical analysis – for instance, a divergence on a monthly chart has different implications when compared with the same pattern on the hourly timeframe.
When dealing with gaps, however, all that matters is the “empty space,” the gap between when the market closed (typically the Friday’s closing price) and when the market opened (typically the Monday’s opening). The levels, therefore, are the same, regardless of the timeframe used.
Another thing to consider is the analysis and interpretation of a gap. Two approaches exist – the Western approach and the Japanese one, and they are completely different.
The broker and the trading conditions also play an important role when dealing with gaps. As mentioned earlier, gaps do not often form on the currency market, but when they do, they usually form over the weekend.
However, while some brokers choose to show the Sunday activity on their charts, others do not. Many, in fact, decide not to open during the hours when trading takes place in New Zealand. Hence, if the broker does not quote you, you cannot manually close a trade that goes against you. Or, if a pending order to close the trade does exist, the levels differ from broker to broker, depending on the Sunday candlestick.
Issues with Gaps
The previous paragraphs already mentioned some issues with gaps. When trading financial markets, risk management is the number one priority of an investor or speculator. This is not to say that by applying risk management, there is no risk to lose – there is always a risk in everything we do in life. But risk management protects the account in such a way that limits the downside and keeps the growth potential intact.
To do that, traders use pending orders. These were invented to better cope with the market’s volatility, but also to better manage the risk.
However, when the market gaps, the prices “jump” over the pending orders. Let us use an example. Imagine you are long the EURUSD pair into the weekend at 1.0853 with a stop-loss order at 1.0800 and a take-profit at 1.10. The stop-loss and take-profit orders define the money management system and are designed to protect the account by cutting the loss if and when the price reaches the invalidation point. Or, by taking the profit when it reaches the profit level.
But if the market opens after the weekend at 1.0730, it means it gapped lower. Something bad happened with the euro, or surprisingly positive news sent the USD higher at the opening. The broker cannot close the long trade at the stop-loss level because there was no market. As such, it will close it at the best possible level (the opening price). Therefore, the loss is much bigger than anticipated.
Obviously, a gap may move in favor of the trader. Yet, most of the time, it affects the account negatively due to slippage, higher than usual spreads, and general trading conditions.
Weekend Gaps
As mentioned earlier, gaps mostly appear in the currency market at the opening after the weekend. Sometimes events over the weekend create such gaps on Monday’s opening.
Usually, they relate to elections, central banks’ decisions, central banks’ members’ speeches, interviews, geopolitical events, etc. To put it simply – whenever something unpredictable happens over the weekend, the currency market is the first one to react at the opening.
Plenty of examples exist. During the sovereign debt crisis in the Eurozone, the ECB applied a haircut for some deposits in Cyprus banks, leading to a huge gap lower on the EURUSD pair at the Monday’s opening.
Shortly after Donald Trump was elected as the new U.S. President in 2016, an important European election was about to create a gap – French presidential elections were due in April 2017.
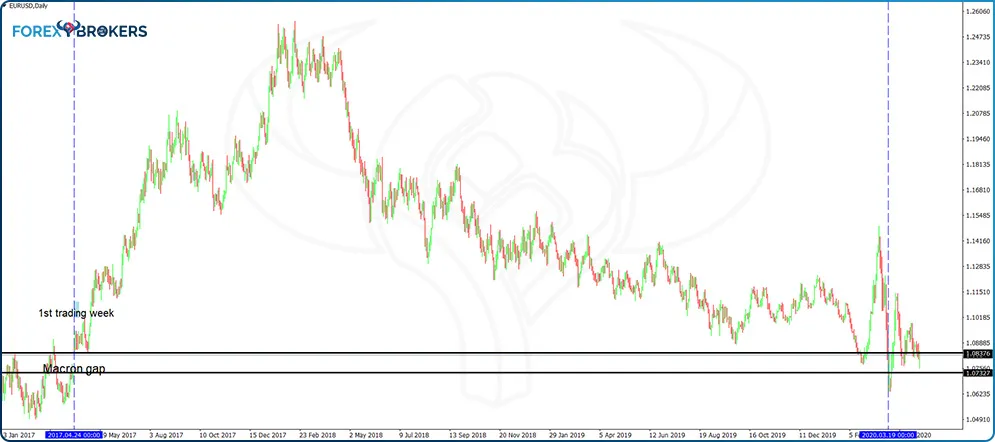
The center-right candidate won – Emmanuel Macron. A pro-European supporter, he was viewed as boosting the confidence in the European project. As a result, the euro pairs opened higher after the weekend.
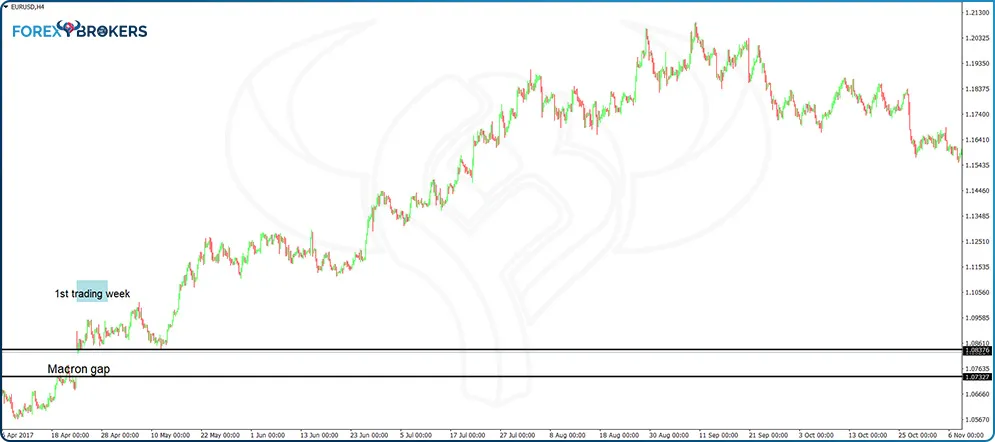
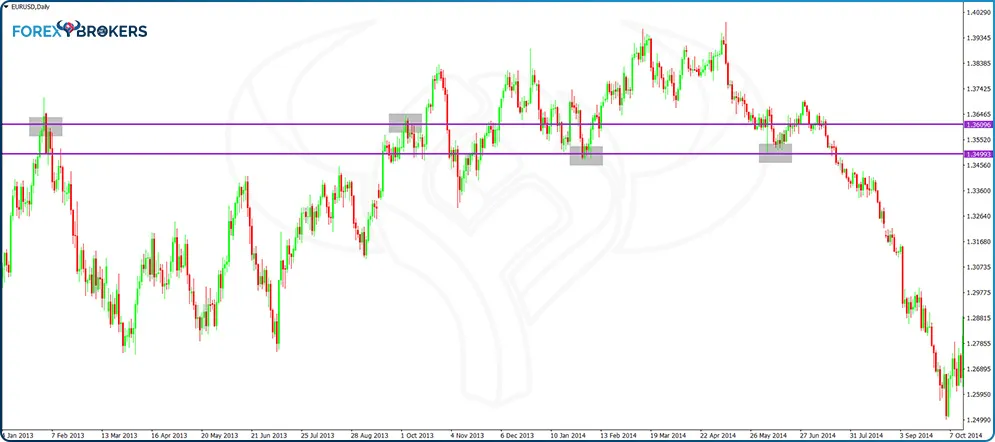
The chart above shows the Macron gap from April 2017. It is visible on almost all euro pairs, with different edges depending on the currency pair.
A gap represents the empty space on the chart. For technical analysis purposes, the definition of a gap differs from the actual distance the price traveled.
Consider the earlier chart. The market opened higher, and then the first candlestick during the early Asian trading was bearish. If we are to measure the gap, we just take two horizontal lines and mark down the empty space between the visible candlesticks.
Gaps During the Trading Week
The FX market is the most liquid in the world. Players of all kinds operate on this market, with no players big enough to influence price levels for a long time. Even central banks cannot fight the flows in this market for a long time.
Because of the high liquidity levels, gaps are virtually impossible to form. More precisely, relevant gaps do not form during the week.
However, depending on smaller timeframes, the price on some currency pairs does gap from time to time. For instance, if you trade on the one-minute chart, a scalping strategy (i.e., trading for very short-term profits), and an important economic release is due, the price might gap a few pips on the announcement.
But such small gaps become invisible on the bigger timeframes. Hence, they are irrelevant, mispricing due to the broker’s execution.
EURCHF Fixed Exchange Rate Floor
Up until January 2015, the Swiss National Bank (SNB) kept a so-called floor on the exchange rate on the EURCHF cross at 1.20. Effectively, it meant that the central bank pledged to protect the level no matter what.
The Swiss franc (CHF) is viewed by market participants as a safe-haven currency, and investors pour funds into it during tough economic times. The Eurozone sovereign crisis led to a sharp depreciation of all euro currency pairs. The EURCHF cross, in particular, suffered a quick move lower, forcing the SNB to intervene constantly.
For a few years, the trick worked – the SNB kept buying euros and selling CHF, defending the exchange rate more aggressively when the price was closer to 1.20, and loosening the grip when the cross moved higher. However, it became evident that the ECB would ease the monetary policy even further. As such, the SNB felt the pressure and, eventually, in January 2015, it dropped the peg.
What followed is hard to describe in words. Nowadays, most Forex brokers do not show the gap on their charts. They simply show a huge red candlestick on the EURCHF cross.
But the reality was that at the announcement, the EURCHF market simply disappeared. From 1.20, the next opening was well below 0.90 – it took over five minutes for the first quote to appear on the market.
After the initial shock, traders, as well as brokers, realized the carnage. Stop-loss orders were not executed (there was no market due to the gap), and someone had to cover for the loss.
Luckily, the brokerage industry stepped up and erased the negative balances, but few brokers went bust on the occasion. From that moment on, negative balance protection is one of the things that good brokers offer to their traders.
Interpreting Gaps
Technical analysis first appeared in the Western world. With the increasing popularity of the stock market and the commodities futures market in Chicago at the start of the 20th century, traders kept technical studies on various markets with the intent to speculate on their moving prices.
Most classic technical analysis patterns still used today belong to that period. Reversal patterns like the head and shoulders or continuation ones like ascending or descending triangles are part of every trader’s technical analysis tools.
Just like in the case of classic technical analysis patterns, gaps have a Western approach that originated in the United States. However, it is not the only way to treat and interpret gaps. The Japanese have contributed extensively to technical analysis as well. The Japanese candlesticks patterns quickly became popular around the world when Steve Nison introduced them to the Western world at the start of the 90s.
Besides Japanese candlesticks, which are extremely original, the Japanese also developed another way to interpret market gaps. Unsurprisingly, it differs completely from the Western approach.
Before presenting more details, it is worth mentioning that both approaches, the Western and the Japanese, have their roots in different markets, like the stock and commodity markets in the United States or the futures rice market in Japan.
However, this does not mean that the same concepts do not work when interpreting and trading 21st century markets. In fact, even on the most dynamic market of them all, the currency market, gaps have a particular meaning, especially considering the fact that they do not form that often. But when they do, traders start building their strategies – following either the Western or the Japanese approach.
The Western Approach
This approach to trading and interpreting gaps assumes that all gaps eventually will be closed. Depending on the practitioners, some argue that the gap must be closed the same day (e.g., Monday), and others think that the gap must close by the end of the trading week.
Remember that this approach comes from the stock market, especially from trading and interpreting stock indices. That may be true when trading indices, but the one-week period to close the gap does not work when trading currencies. More precisely, it does not always work. Some gaps do close immediately after their formation, but others do not.
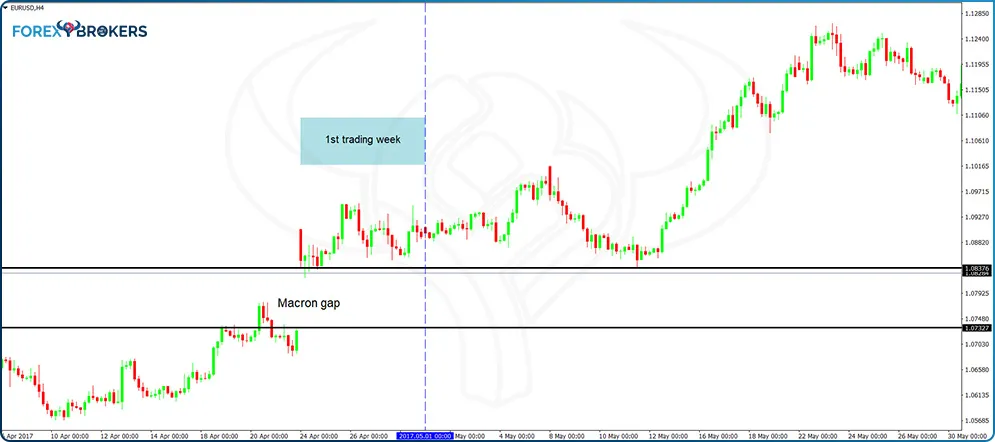
Using the Macron gap as an example, we see that the EURUSD pair opened higher on Monday, and by the end of the trading week, the gap was still open. Moreover, further analysis on the right side of the chart shows that the gap remained open well beyond the one-week period.
The problem, of course, remains with how to trade the gap on the currency market. Gaps may eventually close (the Macron gap did close but only in 2020, years after its formation), but traders need a lot of patience, a big balance in the trading account, and some nerves to cope with such a drawdown.
To put it simply, the Western approach may often work, but the currency market has seen examples in the past when a gap remained open for many years. Moreover, the market continued in the gap’s direction for a long distance, making it impossible to remain invested due to the market “eating” from the equity of the trading account, and the trade no longer makes sense.
The Japanese Approach
The Japanese candlesticks patterns emerged in the last few decades as an alternative to classic technical analysis patterns. The candlestick replaced the classic bar used in charting in the United States and candlestick charts go beyond simple reversal or continuation patterns.
Most of today’s traders are familiar with morning and evening stars or the Doji candlestick, but few know that the Japanese candlesticks theory also refers to how to deal with gaps. More precisely, the Japanese approach refers to gaps as windows.
When a window forms on a chart (i.e., a gap), the Japanese treat it as a continuation pattern. In sharp contrast with the Western approach, the Japanese do not care about the gap being closed or when the closing of it takes place. Instead, the Japanese approach focuses on the ability of the price to gap higher or lower.
Therefore, if the market forces pushed the price so strongly in one direction, creating a window (gap), it means that the path of least resistance is in the same direction. Hence, windows are viewed as continuation patterns in the Japanese technical analysis, in sharp contrast with the Western approach that focuses on just closing the gap.
Moreover, the window, once formed on a chart, plays a crucial role in the market from that moment on. Its edges represent strong support and resistance levels for future price action, a concept that the Western approach ignores completely.
Interpreting Windows
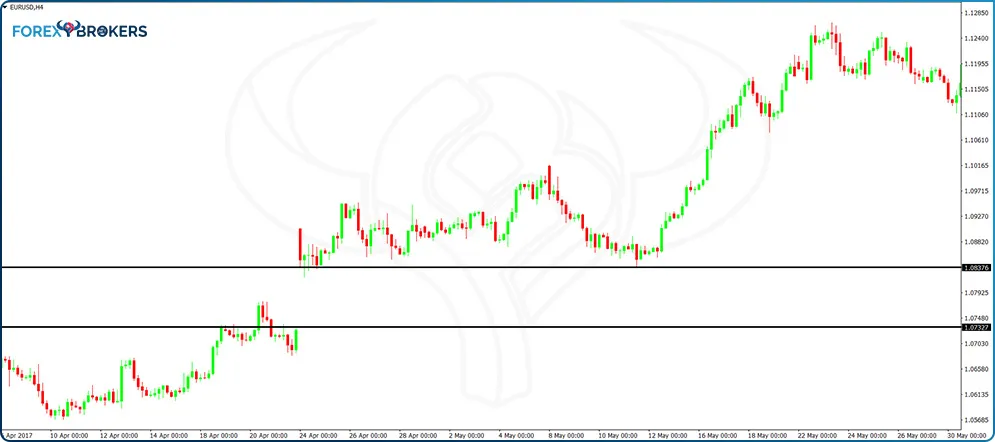
Using the same gap as earlier, the Macron gap on the EURUSD chart, let us interpret it from a Japanese window point of view. The initial steps are the same – we mark the empty space on the chart, or the window, with two horizontal lines. Again, the two lines do not represent the maximum and the minimum price after the window formation, but literally, they show the market “jumping” to a different level – the lines merely measure that distance.
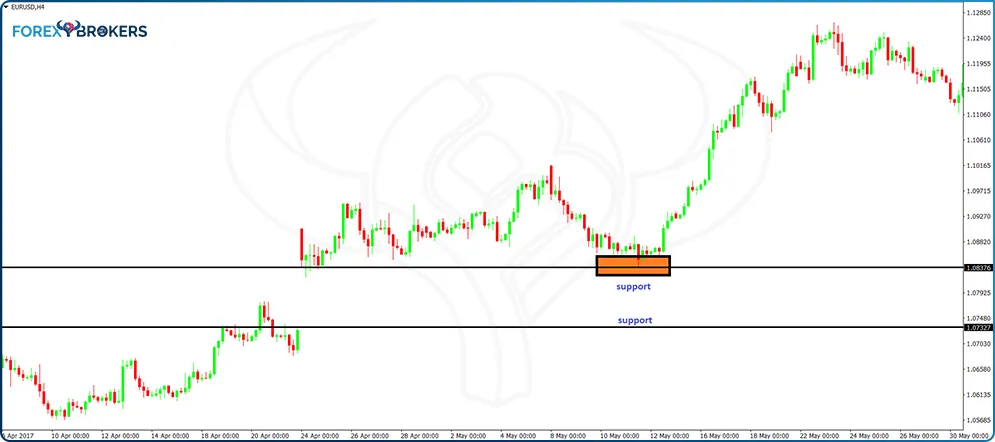
Further to interpreting the window, the focus shifts to the support and resistance provided by it. In this case, this is a bullish window – the price opened higher on Monday. Therefore, according to the Japanese interpretation, this window is a continuation pattern, and traders should look to further buy the EURUSD, in contrast with the Western approach that implies selling the EURUSD to close the gap.
This is no small gap, to the other ones – the distance between its edges is over one hundred pips, enough to tempt traders to go for the Western approach and sell the EURUSD for the gap’s closing. However, the disciplined trader following the window approach and interpreting it as a continuation pattern will look at the two windows’ edges to act as support on any move to the downside.
Moreover, the two levels are interchangeable in the sense that, once broken, support becomes resistance, and resistance becomes support. These levels remain on the chart forever and will continue to act as support and resistance for as long as the EURUSD hovers around the area.
It is difficult to imagine such a thing, especially if you consider the market’s reaction after hitting the support given by the upper edge of the bullish window. But what happened with the EURUSD after that proves that the Japanese approach to treating windows as a continuation pattern can lead to great trading results.
- Windows as Continuation Patterns
Based on everything discussed above, a bullish window indicates strength. It acts as a continuation pattern, and traders should not be surprised to see the market pushing aggressively in that direction. Consider the EURUSD reaction after the Macron gap.
The market was already bullish as it formed a series of higher highs and higher lows previously. By the time the bullish window appeared, its upper edge acted as support. On top of that, after it reacted from support, the price action broke the previous high too. With the price continuing to make higher highs and higher lows, shorting it for the sake of closing the gap is not the wisest trading decision one can make.
As a matter of fact, after the window as a continuation pattern formed in 2017, at around 1.08, the price moved to 1.20 before correcting to 1.15. Furthermore, it reached 1.25 before reversing. From 1.08 to 1.25 on the back of a continuation pattern – a strategy worth considering by swing traders and investors alike.
- Windows as Support and Resistance Areas
Another important feature of gaps treated as windows under the Japanese approach is their ability to provide ongoing support and resistance. Effectively, it means that from the moment the window appears on the chart, the market should find continuous support or resistance.
Because the window has two edges or extremes, we cannot refer to both of them as support and resistance. Instead, consider the area between the edges like the one responsible for the horizontal support and resistance levels.
Moreover, the principle of interchangeability between support and resistance (i.e., once broken, support turns into resistance and resistance turns into support) adds value to the windows as the price reacts to the area between the two edges both in a bearish and a bullish trend.
Let us consider the EURUSD chart again from the moment the Macron gap formed. After more than three years, during which the price rose from 1.08 to 1.25, it reached the window, threatening to close the gap.
Because the price reached the window during a falling trend, the window was supposed to offer support. Again, think of the area, not the actual levels of the two edges.
Indeed, the price bounced the first time it reached the 1.0830 area, and, in an almost vertical line, the movement extended to 1.15. Another bearish wave sent it to below the lower edge of the window, but the price still met stiff support.
- “Breaking” the Window
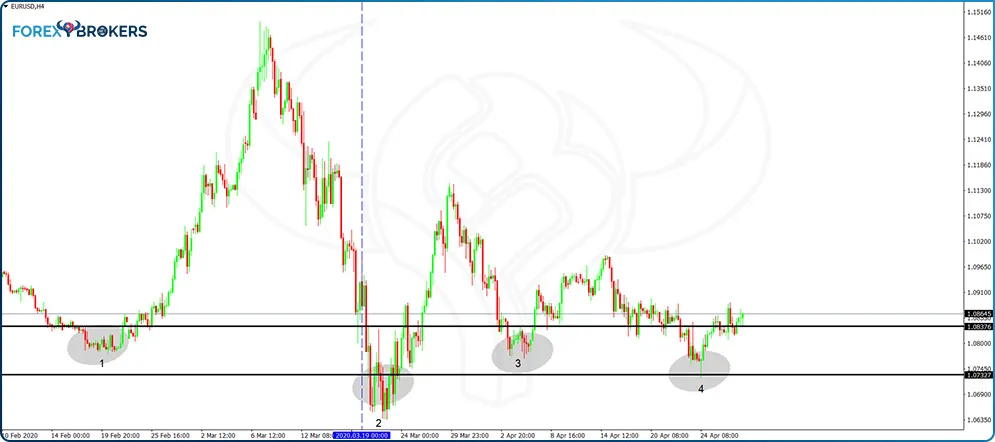
Zooming into the area, we see that the support provided by the window seems to be broken. However, just like in the case of trendlines, a break of support or resistance often refers to a certain distance calculated in percentages. Usually, a 1%-3% decline below support invalidates the level – however not the case here!
Instead, the EURUSD found strength and bounced back above 1.10. However, each move higher was met with more aggressive selling, with the current price pushing to break the support provided by the window.
Bulls would like to see the series of lower highs, characteristics in a bearish trend, broken. This means that the price should move back above 1.10 for the attention from the support level to fade away.
If we consider how much the EURUSD pair struggled to break below 1.07 and hold and couple this price action with the fact that the support level is known for more than three years, we clearly see the power of trading gaps with the Japanese approach. Every attempt in the future at breaking below 1.0830-1.01730 should face stiff support. If broken, support turns into resistance.
- Other Examples Involving Windows
As mentioned earlier, the main advantage of trading gaps under the Japanese approach is that the support or resistance levels remain valid in the future. Therefore, many traders research past data to find out relevant gaps and project those levels using horizontal lines.
We will not do that in this article, but showing another example helps to better understand the concept. Anyway, in case some things remain unclear, make sure to watch the three videos that accompany this article, as they explain in more detail the rationale under which this principle works.
Once again, the EURUSD is the currency pair responsible for another example. This is not by chance. Because the currency market is highly liquid, gaps do not appear so often – not even after the weekend. But during the crisis, especially local ones that do not involve all the currencies in the market, gaps do appear, as already shown by this article.
Shortly after the 2008 financial crisis, the Eurozone experienced another crisis related to sovereign debt. Greece was manipulating its economic reports, and suddenly, the whole world became aware of it. As a full member of the euro area, Greece triggered a crisis that threatened the very existence of the euro.
As a consequence, often during that period the euro pairs opened the next trading week with a gap. Not all of the gaps were significant in the sense that some were quite irrelevant and quickly filled, but some did form, and they left traces we can use as support and resistance from that moment on.
- Building and Interpreting a Window
The EURUSD chart below shows a gap forming in 2010. By measuring the size of the gap (i.e., the empty space on the chart), we can estimate its importance as future support and resistance. The rule of thumb states that the bigger the gap (window), the stronger the support or resistance area it provides. This gap is also about a hundred pips wide, almost equal to the one used in the previous example.
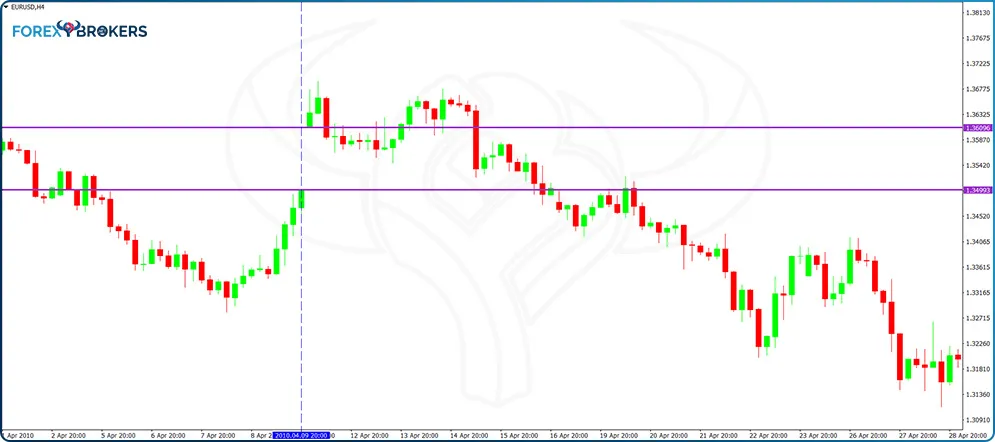
We see that under the Western approach, the market quickly fills the gap. This time, trading to fill the gap proved to be the right decision. But even so, the Western approach of treating gaps ends with the gap’s filling. On the other hand, the Japanese approach continues to provide important technical levels indefinitely.
If we zoom out to see as many candlesticks as possible, the pivotal level played by the window becomes evident. The area acts as support and resistance, and the best way to make the most out of it is to go on the lower timeframes, like the hourly or the five-minute chart, and search for reversal patterns against support or resistance.
Further on the right side of the chart and towards the present times, the window keeps performing as support or resistance, regardless of the actual reason why the market reaches it. After the price broke below support, the window turned into resistance and continued to play a critical role for the pair.
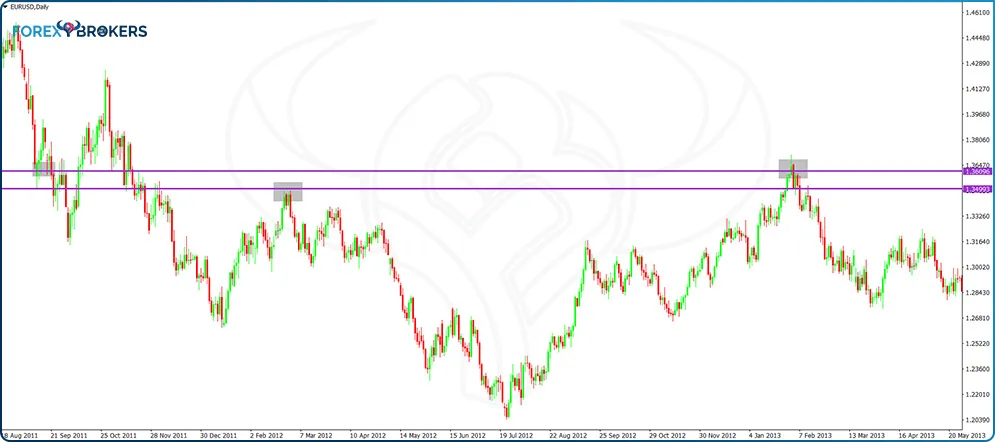
Moving forward, the price dropped below the area highlighted by the window’s edges, and the focus shifted toward the window’s ability to provide resistance to any testing. As mentioned earlier, when the price reaches support or resistance, the ideal thing to do is to move on the lower timeframe and check reversal patterns. This being a resistance area, look for dark-cloud covers, bearish engulfing, Doji, evening stars, or even classic technical analysis reversal patterns.
- Building the Ideal Trading Setup
Consider every instance when the price reached support and resistance given by the window. As this is the four-hour chart, trading reversal patterns on the hourly chart, respecting the 1:3 risk-reward ratio mentioned in previous articles in this trading academy, lead to higher chances for the rr ratio to be reached.
Even the slightest hesitation on the 4h chart may be enough for trade on the 1h timeframe to reach the 1:3 rr ratio. And this is the power of trading reversal patterns against horizontal support of resistance – the setup is known in advance, but finding potential areas that provide support or resistance is difficult. Moreover, projecting them further on the right side of the chart is challenging too. Windows solve this problem easily.
- Bringing All Gaps on One Chart
The image below shows the current EURUSD price action. On the left side, the vertical line reveals the timing of the Macron gap – the gap we started this article with. As such, the two black horizontal lines reflect the edges of that window – to act as support and resistance in the future.
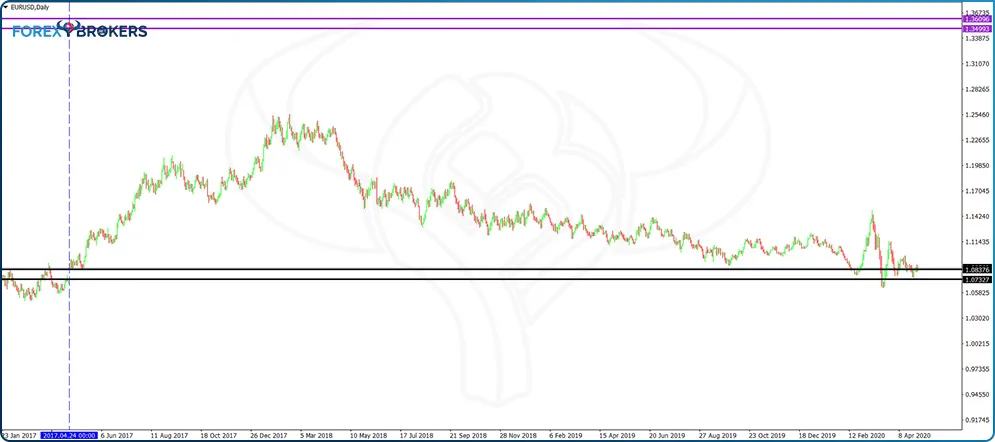
The upper side of the chart shows the other gap discussed in this article. It is quite far away from the current price, but the challenge for traders is to study past prices and mark the relevant windows/gaps with horizontal lines.
When doing that, the relevant support and resistance levels appear on a chart like the one above, knowing when the market might turn.
The counterargument against this setup is that the chart quickly becomes full of horizontal lines. For a currency pair like the EURUSD, given the multitude of gaps that exist, the chart will reflect many windows. However, the idea is only to be aware that price faces support or resistance. Next, traders go on the hourly chart and quickly look for reversal patterns, using 1:3 risk-reward ratios for their trades. This way, sound money management meets the power of trading gaps under the Japanese approach.
Conclusion
Given that currency market gaps are rarely formed, when they do, they create animosity among traders. That is especially true with large gaps because they are usually associated with important events that happened over the weekend. Therefore, most relevant gaps have a name – Macron gap, Cyprus gap, etc.
Because of that, gaps are easily tracked back in time. Just search the Internet for a gap by its name, and the likelihood is that you will find the date when the gap formed.
Unfortunately, sometimes gaps do form during the trading week. In such events, the magnitude of it far outpaces any other gap formed over a weekend. The explanation comes from the high liquidity in the currency market, and if a gap forms during the opening hours, it means that the shock is totally unexpected and big enough to create such a gap. As the SNB gap showed, such events are enough to challenge the entire online trading industry – both traders and brokers.
When trading gaps, the Western approach involves focusing on closing the gap as soon as possible. The two examples presented in this article showed what happens when the gap closes fast, or when it closes after three years or more.
Under the Western approach, the closing of a gap brings the end of the trading opportunity. But under the Japanese approach, the closing of a gap is not mandatory. In fact, the gaps, or windows, have a dual role. One is to act as continuation patterns. Another is to provide support and resistance for future market moves.
Because gaps are not affected by the timeframe, it is easy to spot and measure them accordingly. By correctly identifying gaps and projecting the support and resistance levels on the right side of the chart, traders create the premise for potential trades against support and resistance – selling resistance and buying support, thus having a competitive advantage against random market moves.