LISTEN TO THIS ARTICLE:
An Italian mathematician from the city of Pisa, Leonardo Bonacci, known today as Fibonacci, was born in 1170. His legacy goes beyond the Fibonacci ratios we know and use today – in the year 1202, he wrote Liber Abaci, one of the most important books in the mathematics of that time.
Also known as the Book of Calculation, it set the path for European mathematics. Many of today’s practitioners are surprised to discover that its roots are in the old Hindu positional number system and the Muslim algebraic methods developed by al-Khwarizmi. Familiar with today’s word “algorithm”? – you just found its origin!
He clearly saw the advantages of the two systems for commerce and scholarship and wrote one of the most important and influential books on mathematics of all time. Today, Fibonacci ratios are respected by scientists, researchers, and mathematicians from all over the world.
Technical analysis, as we know it today, would be quite different without the Fibonacci ratios. Traders use them to spot entries and exits on both sides of the market and to measure the length of various market moves.
Fibonacci ratios have extensive use in various trading theories – the Elliott Waves Theory, Gartley, etc. In the Elliott Waves Theory, the entire theory is built upon Fibonacci ratios that tie together the various patterns Ralph Elliott discovered.
In this article, we will look at the most relevant Fibonacci ratios and how they are used in technical analysis. From trading theories to Japanese candlesticks, this article covers the Fibonacci retracement and extension ratios, as well as their use in time analysis.
The Fibonacci Sequence
The Fibonacci sequence is easy to build, as each number is the sum of the previous two numbers. Starting with the first two numbers, 0 and 1, the sequence continues with 1, 2, 3, 5, 8, and so on.
You may wonder what this sequence has to do with the Fibonacci ratios used nowadays in technical analysis, but the ratios are based on the distance between two consecutive Fibonacci numbers.
Leonardo started the Fibonacci sequence from the number 1, but today, 0 is considered the starting point. Also, the Fibonacci sequence, although it took the name and fame of Leonardo, was known and used by Indian mathematicians long before Fibonacci discovered it.
Fibonacci Ratios in Technical Analysis
The Fibonacci ratios have extended use in technical analysis. From simply finding retracement or expansion levels to identifying market cycles or support and resistance, they are present on all the trading platforms available to retail and professional investors alike.
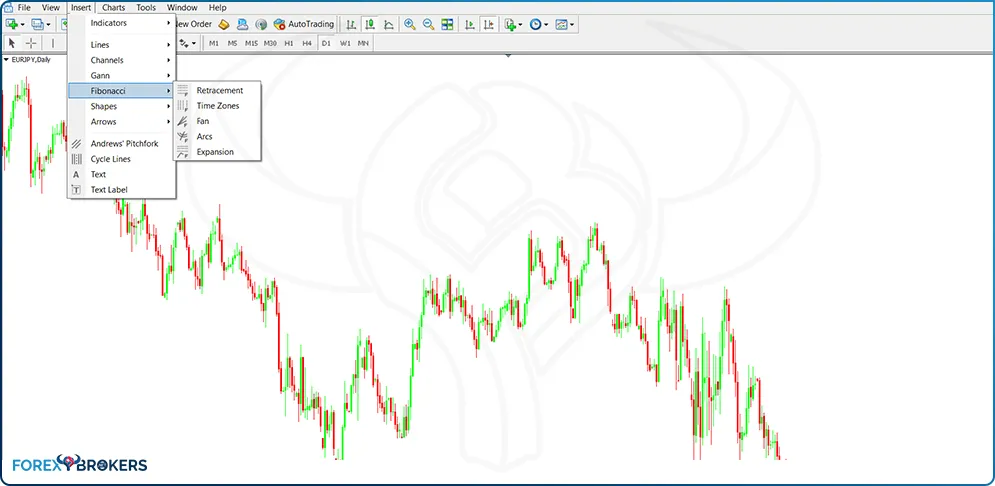
The MetaTrader, for instance, has an array of Fibonacci trading tools integrated into the platform. They are offered with the default settings, but traders can easily import custom-built indicators as well based on various Fibonacci levels.
The Fibonacci retracement and expansion levels are the ones most frequently used by traders. They help to measure the length of specific waves or find possible support and resistance levels.
But some traders use technical analysis concepts like bullish and bearish market cycles based on the time element. For example, the Elliott Waves Theory bases many of its concepts and rules on the time element as well, not only on price. Time is one of the decisive factors helping traders to find out if a market move is impulsive or corrective.
Fibo levels have a key role in trading support and resistance areas. This is particularly true when the price reaches a confluence area where more than one Fibonacci level exists – one level may offer support or resistance on a bigger timeframe, another one on a different timeframe, and so on. On top of that, dynamic support or resistance follows the price and Fibonacci fans and arcs offer a solid indication where the price might react.
Fibonacci Retracement Ratios
The most widely used Fibonacci ratios belong to the retracement category. Trading with pullbacks is extremely popular among traders of all markets, and there is no better place to add to a position or to initiate a new one than on a pullback to a Fibonacci level.
The Fibonacci retracement ratios are used in both rising and falling markets. In a rising market, traders use the Fibonacci Retracement tool to buy dips, and to sell spikes in a rising market.
Explaining the Fibonacci Retracement Tool
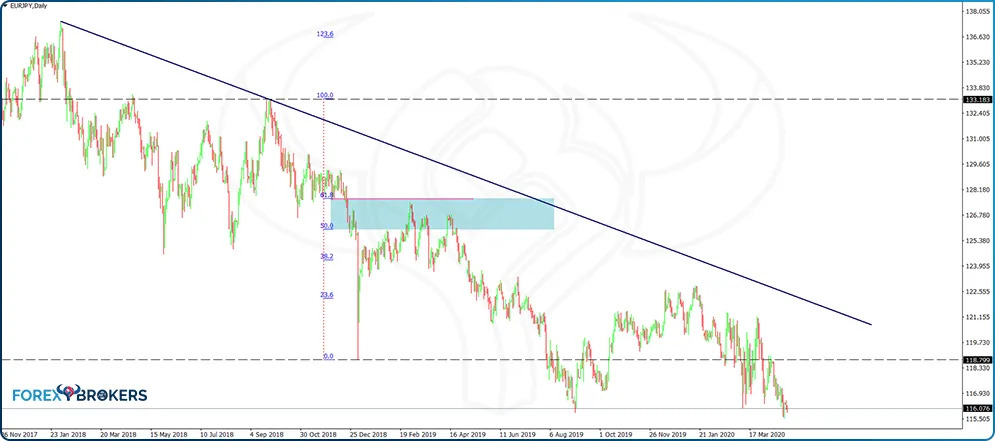
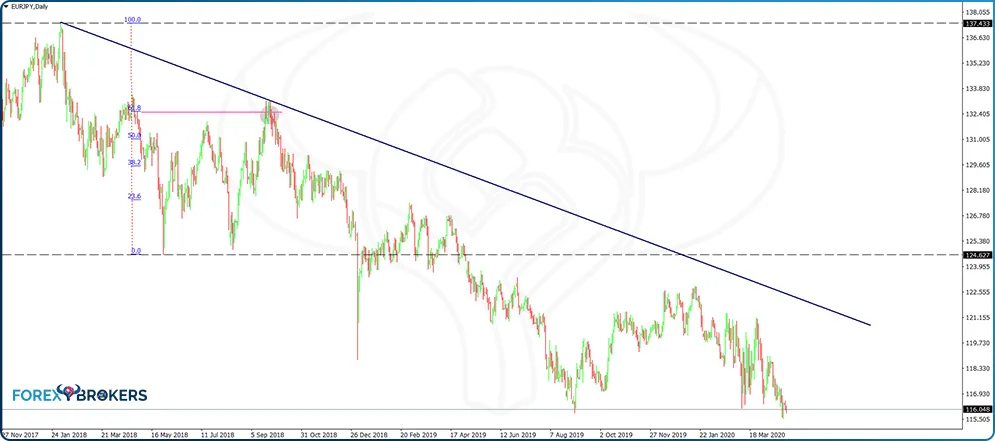
The easiest way to understand the Fibonacci Retracement tool is to use an example. The EURJPY daily chart shows the market in a bearish trend from more than two and a half years ago. More precisely, since December 2017, the EURJPY cross, very popular among retail traders, continues to make lower lows and lower highs – a characteristic of a bearish trend.
For better use of the Fibonacci Retracement tool, consider the following. First, mark the top with a horizontal line. Second, draw a trendline connecting the top with the first swing higher before the market forms a new lower low. This is the minimum condition for a bearish trend, and we have covered this concept in a previous part of the introductory section of this trading academy.
We see that the price broke the trendline, invalidating it as the “line of the trend.” Some adjustments are needed, but only if the price breaks the series of lower high – which it did not. Hence, the opportunity exists to sell the spike using the Fibonacci Retracement tool to find out the right entry.
Take another horizontal line and mark the previous lower low. Finally, use the Fibonacci Retracement tool to measure the entire drop from the top. Hint – do not simply click and drag the tool but try to find a vertical line for it. This way, the resulting Fibonacci retracement levels do not fill the entire chart, making it easier to interpret the data and have a clean chart for other technical studies.
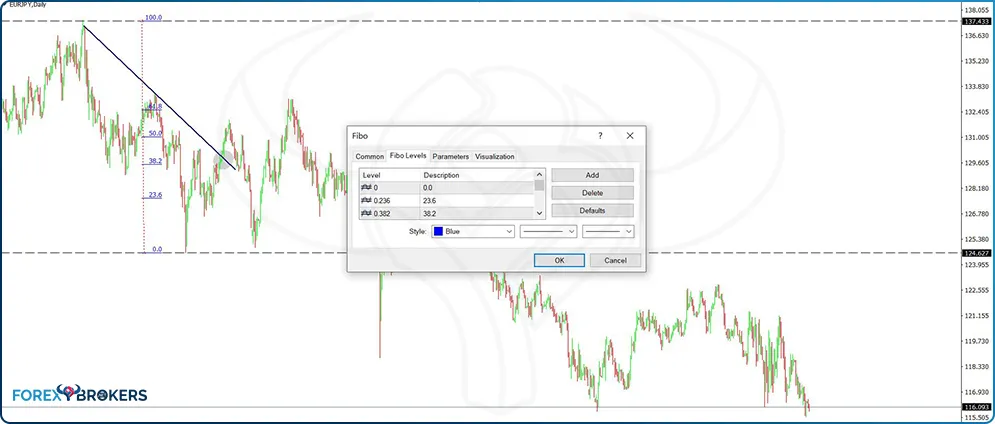
One can also edit the tool by simply selecting it, right-clicking, and choosing Fibo properties. It is easy to add a level – any level – to change the color, or simply to modify the technical tool in such a way as to better serve your needs.
The Golden Ratio
One of the most famous ratios in mathematics, the golden ratio is extensively used in architectural projects and is found in nature as well. In technical analysis, the 61.8% retracement or the 161.8% expansion are viewed as respecting the golden ratio principles.
Many trading theories and concepts use the 61.8% as a key concept in a trading strategy. For instance, the Elliott Waves Theory considers it as critical in defining the flat patterns. More precisely, the b-wave of a flat pattern must retrace beyond the 61.8% level when compared with the previous a-wave’s length.
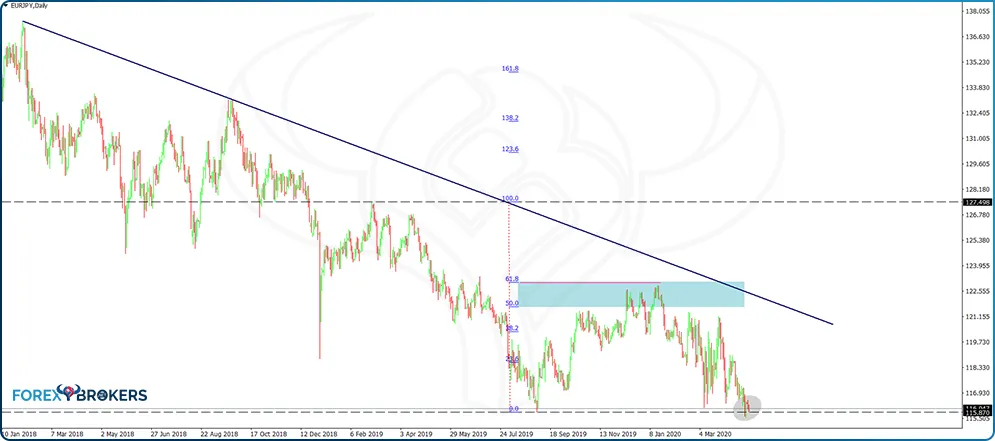
The way to find out the level is by following the steps mentioned earlier in this article and using the Fibonacci Retracement tool. Coming back to the previous EURJPY example, the market retraced 61.8% of the previous swing before turning and making a new lower low. At this point, because of the new lower low, the main trendline suffers changes, as we need to adapt it to represent the new bearish trending conditions.
Using the same principles as earlier, we measure the next market swing lower and use the Fibonacci Retracement tool to find out relevant levels to add to the short side. This time, we see the main trendline holding all the way to the current market price, offering a clear view of the strong bearish trend.
This time the market did not reach the 61.8% retracement level, but it did enter 50%-61.8% territory, enough for many traders to establish new short positions until the market makes a new low while remaining below the main bearish trendline.
Next, history repeats itself – the market makes a new lower low, retraces to the 61.8% level, where traders jump back on the short side and send it to a new lower low. All of this happens while the price remains below the main trendline.
23.6% Retracement Level
The examples used so far were meant to show how to use and edit the Fibonacci Retracement tool and illustrate the importance of the golden ratio. Traders aware of the market moving in swings use the Fibo levels to make the most of the pullbacks that often accompany even the strongest trends.
The 23.6% retracement level is mostly used in the Elliott Waves Theory. More precisely, when trading zigzags or the 4th wave in an impulsive structure, traders do not expect much of a pullback.
For this reason, the 23.6% retracement level is often used as the entry on the long side if the zigzag is part of a bullish trend. The AUDUSD chart from above shows the importance of the 23.6% retracement when trading zigzags.
From left to right, the pair formed a bottoming triangle. It acted as a reversal pattern followed by a strong move in the opposite direction. After a visible five-wave structure, a pullback follows, and the 23.6% is used as the entry on the long side.
In a zigzag, the minimum retracement for the b-wave is only 1%. Because of that, many times the pullback is not strong enough to even reach the 23.6%, not to mention beyond it. In this case, the AUDUSD pullback exceeded the 23.6% and even the 38.2%. However, Elliott traders are aware that the b-wave in a zigzag rarely exceeds 61.8%, and that level acts as an invalidation area. The price did not reach it, and before you knew it, the market reversed and made new highs.
Besides the Elliott Waves Theory, the 23.6% and 38.2% play a key role in identifying horizontal and dynamic support and resistance areas. The following section of this article shows how to use the 38.2% to find such opportunities, and the principle can easily be extended to the 23.6% ratio.
38.2% Retracement Level
One of the most important principles to consider when dealing with support and resistance areas is the fact that they increase in importance the bigger the timeframe is. In other words, Fibonacci retracement levels provide stronger support and resistance on the monthly chart than, say, on the four-hour timeframe.
For this reason, the simplest way to find out relevant support and resistance on any market is to go on the monthly timeframe and find the highs and the lows given by your broker. Ideally, the price action should comprise as much as possible from the historical price data. If the broker does not have all the past data available, you can always import it if you respect the MetaTrader format. Or, if data is still unavailable, find the Fibonacci levels on the yearly charts using some charts from other platforms and then import the levels on your monthly MetaTrader.
The idea is not to trade the monthly chart but to form an educated guess about the possible support and resistance and then go on the lower timeframes and look for reversal patterns. These reversal patterns can take the shape of classic reversal patterns (e.g., head and shoulders, double or triple tops and bottoms, rising or falling wedges, triangles as reversal patterns, etc.) or Japanese ones (e.g., morning or evening stars, hammers, shooting stars, bullish or bearish engulfings, piercings or dark-cloud covers, dojis, etc.).
Key Retracement Level on the Gold Monthly Chart
The gold monthly chart offers the perfect example of how to use Fibonacci retracement levels to find out important support and resistance levels. After putting a top above the 1900 level, the price of gold reversed abruptly.
By using the Fibonacci Retracement tool from the minimum to the maximum points of the chart, we see the price of gold hesitating at the key 38.2% level. Not only did it have a hard time moving much lower, but it formed a classic reversal pattern too – a head and shoulders.
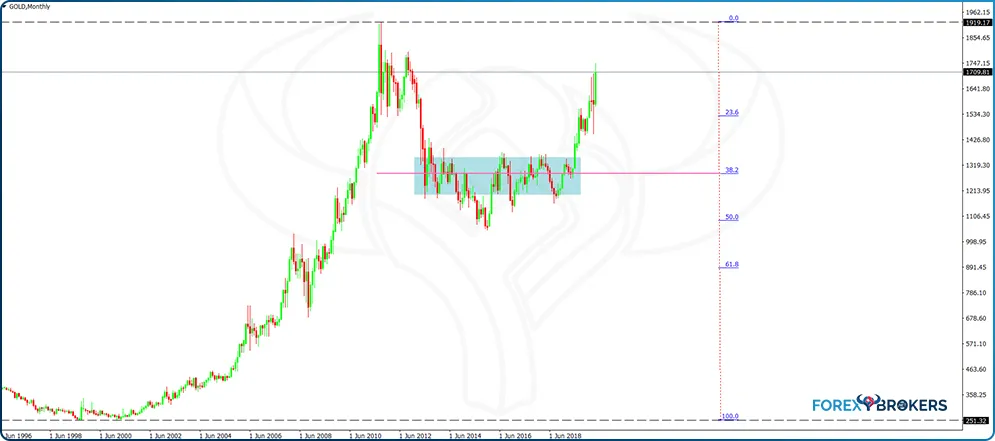
Indeed, the consolidation took a long time. Long consolidations are common during head and shoulders formations, and this one was no different. The right approach here was to notice the reversal pattern and the support offered by the 38.2% level and then to move on to the lower timeframes to study the inversed head and shoulders reversal pattern. This way, by using the information given by the Fibonacci level on the monthly chart, traders have the confidence to trade a reversal pattern on the lower timeframes given that the bigger one met strong support.
Other Important Ratios Used in Combination with Fibonacci Levels
The beauty of the Fibonacci Retracement tool is that traders can edit it by adding new levels, regardless of whether or not they are Fibonacci ratios. For instance, the 50% level is closely watched by traders because the 50%-61.8% area is known as the area where the 2nd wave of an impulsive structure usually ends. Hence, the 50% level used in combination with the 61.8% often helps traders who prefer an area to enter the market, rather than a fixed level.
Also, the 80%, while not a Fibonacci ratio, has a defining importance in the Elliott Waves Theory. It represents the edge that makes the difference between flat patterns with weak retracement and patterns with strong retracement. Because the move that follows such patterns has different aggressivity, knowing the type of the pattern helps traders in the resource-allocation process.
If the market formed a flat with a weak b-wave, the move that follows is typically more aggressive than if the flat has a strong b-wave. Therefore, one may decide to use a bigger risk or volume in the first instance, when compared with the second one.
50% Retracement Level
As mentioned earlier, the main use of the 50% retracement level is in combination with the 61.8% golden ratio. Consider the recent GBPUSD price action from the lows and the move that followed.
Prior to the bounce we see in the chart below, the pair put a triple bottom at 1.15 and bounced aggressively. On its way up, it broke above the previous lower high, suggesting the previous bearish trend ended. As such, with a triple bottom in place and the lower high series broken, the chances were that the market began a new wave, but this time in the opposite direction.
It is exceedingly difficult to know when the first segment ends. But the Fibonacci ratios give an educated guess as most traders look for the 50%-61.8% retracement as a signal that the market has completed the first segment and the second one is underway.
Therefore, a pullback into the area mentioned above is a signal to go long. The previous reversal pattern and the break of the lower highs series come to reinforce the conviction of buying a move to the 50%-61.8% area.
80% Retracement Level
To view this level, we must edit the Fibonacci Retracement in such a way as to display it. Because it is not a Fibonacci ratio, the 80% retracement does not appear with the default settings.
However, following the steps mentioned in the first half of this article should help. First, select the tool on the screen. Next, right-click and select the Fibo properties. Finally, use the Add level tab to add the 0.8 and add the description (80) to know what it means.
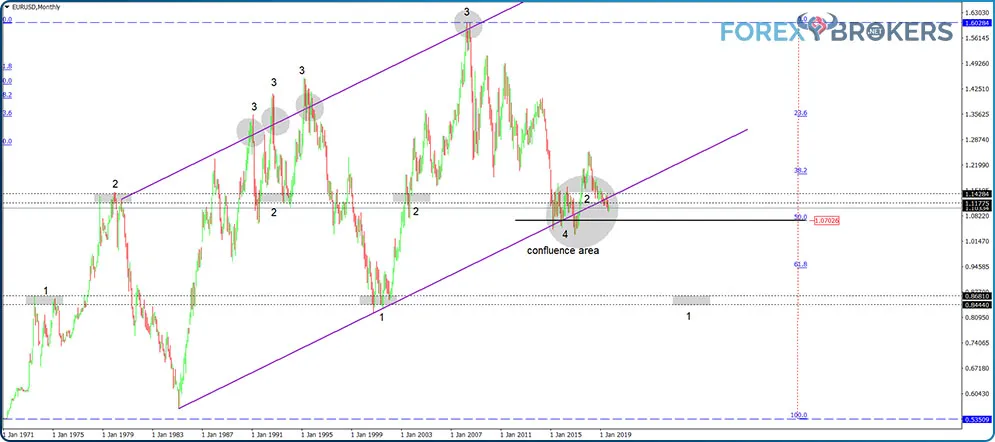
The chart above shows the EURUSD price action for the last month. It bounced from the 1.06 lows but failed to react at the 50%-61.8% area as the GBPUSD did. As such, the chances are that the market formed a corrective wave, rather than an impulsive one. For a quick reminder of the difference between corrective and impulsive waves, make sure you revisit the articles dedicated to the Elliott Waves Theory.
The ability of the EURUSD price action to retrace below the 80% retracement level tells us that the market formed a flat pattern. Moreover, the flat’s b-wave is a strong one, ending beyond the 80% level. This has huge implications for the upcoming move – but traders using the Fibonacci ratios have another similar tool.
Fibonacci Extension Ratios
The MetaTrader uses the term Fibonacci Expansion for the tool that allows us to measure market segments and find targets derived from them. However, some trading theories use the term extension, and so do we.
The main extension ratios are similar to the retracement one. The difference is that traders use 123.6%, 138.2% or 161.8% to form an educated guess about where the market might go. Other levels do exist, like 261.8% or 423.6%, but they pale in importance when compared with the other ones.
What is interesting here is that traders may use both the Fibonacci Extension tool offered by the MetaTrader platform and the Fibonacci Retracement. To use the latter, simply edit the tool and add the desired levels.
161.8% Extension Level
The most important Fibonacci extension level is the 161.8%. Traders counting waves the way Elliott did are in constant search of the 161.8%. Elliott stated that in an impulsive wave, at least one wave extends. Moreover, he added that the extension refers to 161.8% of the first segment, projected from the end of the second one. Furthermore, this should be the minimum distance that the market must travel for an impulsive wave to form.
If we use the GBPUSD earlier example, the 161.8% level’s importance becomes obvious. Remember that initially, the golden ratio (61.8%) gave us the entry level. Now, using the Fibonacci extension level, we can derive the target for the extended wave.
The first step is to find the 161.8% extension –using either the Fibonacci Retracement or the Extension tools. In this case, the Fibonacci Retracement was edited to show the 161.8% applied to the first segment.
The second step refers to projecting the 161.8% extension from the end of the second swing. Or, from the lowest point in the dip into the 61.8%. The outcome is the educated guess about the place where the market might turn.
Because it is used by so many technical analysis practitioners, the market reacts incredibly well to it. However, always keep in mind that this is only the minimum distance the price should travel. In strong third waves, the 261.8% or even 423.6% extensions are easily reached.
123.6% Extension Level
This extension level mostly refers to market corrections. More precisely, the key here is to interpret the area between the full retracement (100%) and 123.6%.
Often traders use the previous market high or low as the place for the stop-loss. However, in highly volatile markets, like the currency market, it is common to see the market fully reversing a swing, tripping all the stops that it may find, and then resuming the original trend.
The 123.6% level helps filter such moves. It can be used in combination with the 138.2% or alone. Also, it has applications in the Elliott Waves Theory as it helps traders differentiate between irregular flats and flats with an irregular failure.
When used from a purely market geometry and price action view, the 123.6%-138.2% area provides key information. In a rising market, if a new higher high fails to break 138.2%, the expectations grow that the price will reverse and threaten the previous higher low belonging to the bullish trend. Ideally, the new higher high should not even reach the 123.6% extension when compared with the distance the price traveled in the previous higher low.
Conversely, in a bearish trending market, the new lower low’s inability to exceed the 138.2% extended level shows weakness. It is typically accompanied by a bullish divergence on the RSI or other oscillators, and the tendency is that it will reverse the move completely.
Such price action often leads to double tops or bottoms. While the technical analysis theory refers to fixed levels for double tops or bottoms, in reality we talk about an area that comprises 100%-123.6% retracement.
- Examples on the NZDUSD Weekly Chart
Before looking at some relevant examples, it is worth mentioning that the extension refers to the previous market segment. To calculate it, simply use the Fibonacci Retracement tool and drag it from the highest to the lowest point of the higher low (in a bullish trend) or lower high (in a bearish trend). The move that follows should extend less than 138.2%, ideally between 100% and 123.6%.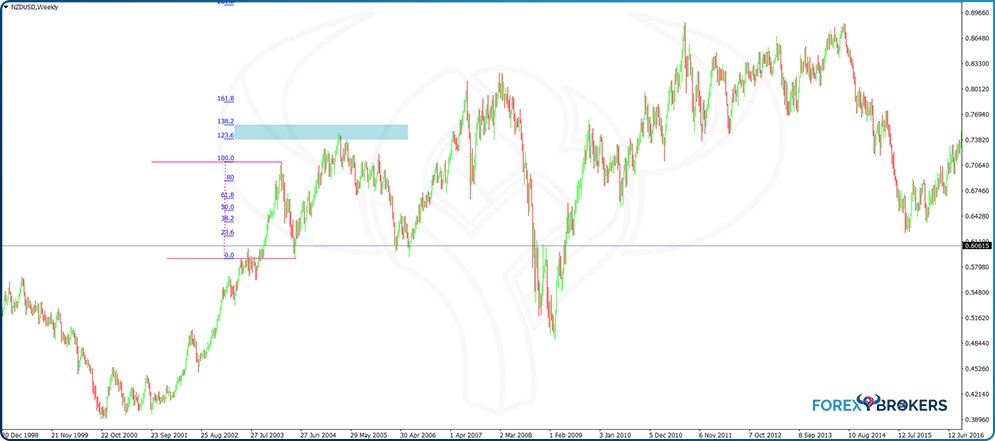
On its way to the 0.86 area where it formed a double top, the NZDUSD pair advanced in a bullish trend. However, just because a market is rising or falling, it does not mean that traders cannot take the other side of it.
From left to right on the chart above, the price broke higher. It advanced for almost three years without a decent pullback. Suddenly, a pullback appeared and then the market reversed, only to make a new higher high.
By using the Fibonacci Retracement tool to find out the 123.6%-138/2% extension, we can check if the price manages to reach the 138.2% level. If not, by the time it retraces back into the previous lower high territory, the market conditions favor a return to the lowest point of that swing.
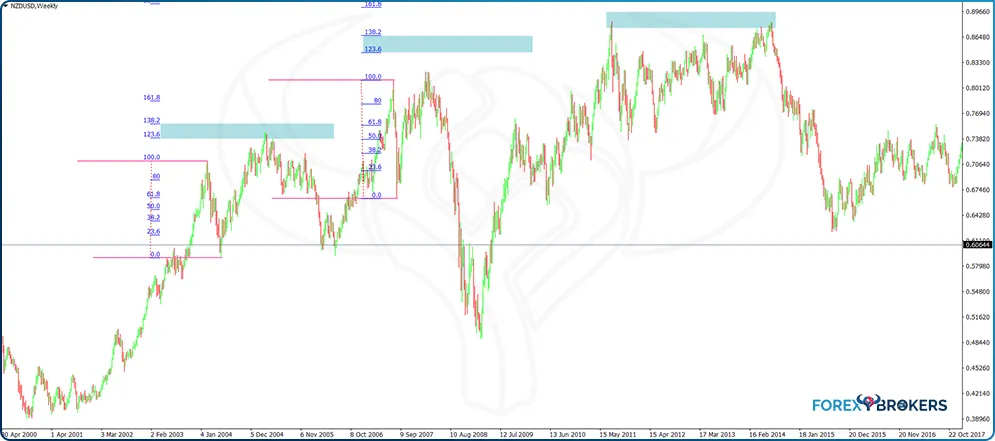
Another example forms on the same chart. A similar pullback followed by a new higher high was quickly retraced, once again confirming the power of the 123.6%-138.2% extended levels.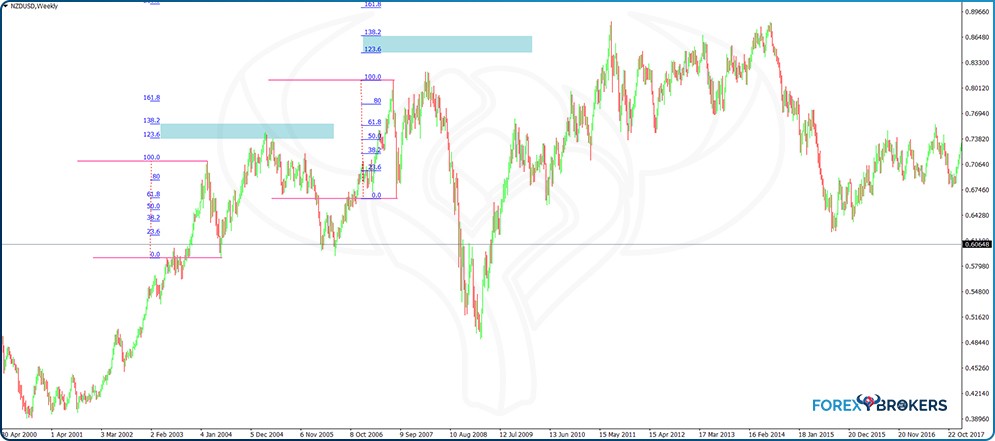
As mentioned earlier, a similar principle leads to the formation of market tops or bottoms. This is especially true in the case of double tops or bottoms. As it happened, the NZDUSD pair formed a double top several years later, following the same pattern – a higher high unable to break the 138.2% extension level.
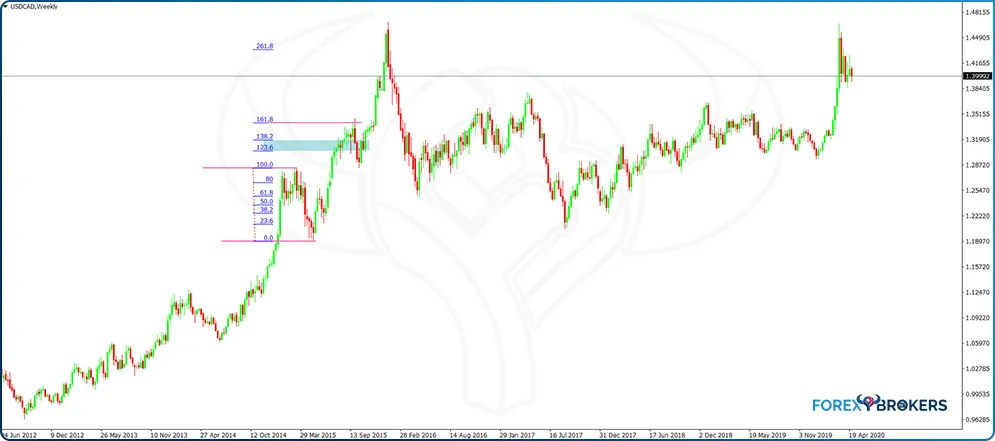
138.2% Extension Level
What happens when the market extends beyond 138.2%? In this case, it validates the previous higher low (in a rising market) or lower high (in a falling market) and the implications are that the market continues to trend. That is especially true of the higher high or lower low, which have the power to extend beyond the 161.8% Fibonacci level.
Let us use the USDCAD weekly chart for an example. The market formed a higher low and then reversed and reached the 123.6%-138.2% area. It managed to close above 138.2% and did not return to the previous swing’s territory. Moreover, the price blew beyond the 161.8% extension, fueling the rally further.
Fibonacci Time Zones and Their Role in Calculating Market Cycles
Some traders believe that everything happens for a reason. More precisely, they trade under the assumption that history repeats itself. This may or may not be true, but the cycle’s theory is embraced by many traders, especially the ones that use a mix of technical and fundamental analysis.
The Fibonacci Time Zones tool derives its levels from the Fibonacci sequence mentioned at the start of this article. The idea is that, just like the business cycle that has expansionary and contractionary phases, the same happens with the market as it follows the economic performance.
The Fibonacci Time Zones tool gives traders the ability to measure the time of a corrective phase and project the time on the right side of the chart using the Fibonacci sequence. Obviously, the aim is to find when the next correction begins.
Such a tool is increasingly used on the stock market. Because a correction on the stock market is typically associated with an economic recession, fundamental traders use technical inputs to find elements that might support a fundamental thesis to trade or invest.
Finding Corrections with the Fibonacci Time Zones Tool
Below is the weekly Dow Jones Industrial Average (DJIA) chart. As one of the most important stock market indices in the world, it is closely watched by traders and investors from around the world, with an interest in various markets – currencies, fixed income, and equities.
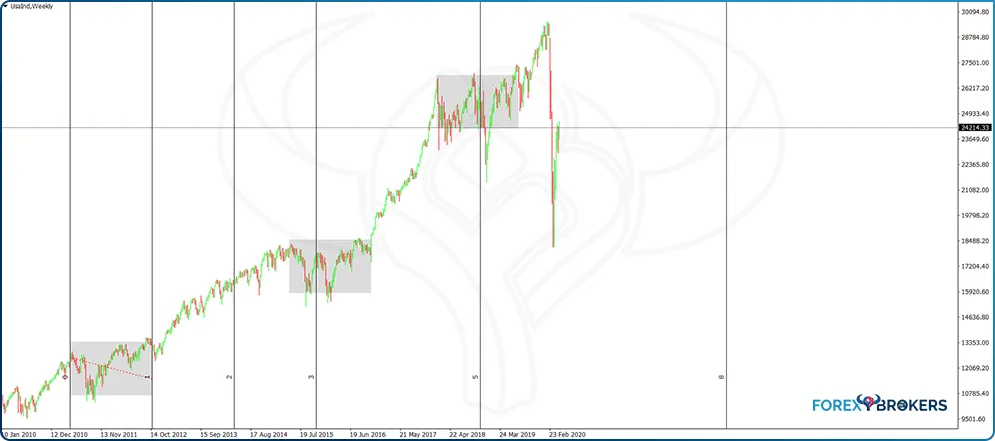
To use the Fibonacci Time Zones tool, consider first measuring a corrective phase. Ideally, the timeframe used is weekly, monthly or even yearly, and the market is a stock market index.
The explanation is that a correction forming on a stock market is typically associated with a recession or at least a turn in the business cycle. Such a correction has implications in all markets – the Dollar Index, other stock markets in the world, the emerging markets’ currencies performance, and so on. Hence, by interpreting the cycles on the US stock market, one can use correlations based on fundamental aspects.
By clicking and dragging the Fibonacci Time Zones, traders measure the entire corrective phase. On the chart above, that is the first grey area from left to right. The tool automatically projects the time on the right side of the chart by using the Fibonacci sequence: 1, 2, 3, 5, 8, and so on. Thus, the Fibonacci Time Zones tool offers a clue about when in the future the market may correct using historical data.
Naturally, the more historical data at hand, the better. This is one of the reasons why this approach is used on the stock market, because the data is available and all the boom and bust cycles can be spotted.
Another technical area to use the Fibonacci Time Zones is the Elliott Waves Theory. During impulsive waves’ formation, there is a time element that the price action must respect. More precisely, the non-extended waves relate to a Fibonacci ratio in time.
Fibonacci Fans and Arcs
Using the same principles as the Fibonacci Time Zones tool, the Fibonacci fans and arcs further expand the use of the Fibonacci numbers, ratios and sequence. The derived support and resistance levels follow the price, making it easier for traders to spot the pullbacks in rising and falling trends. Therefore, they are used in spotting dynamic support and resistance and confluence areas in any market.
Conclusion
This article covered only the most common Fibonacci ratios and levels. As technical analysis changes constantly, the concepts change too.
However, despite a rapid change in technical analysis concepts, the Fibonacci ratios continue to be part of them. Besides trendlines, the Fibonacci ratios and levels are the most commonly used technical analysis tools by both professional and retail traders.
Of all the Fibonacci tools mentioned here, the Fibonacci Retracement tool is commonly used. Its ability to reveal both the relevant retracement and the extension levels makes it the preferred tool to use.
As for the Fibonacci ratios, the 61.8% and 161.8% are, by far, the most important ones. The Elliott Waves Theory is built on such ratios, but also on the 123.6%, 23.6%, 38.2%, or 138.2%.
Technical analysis is used for the purpose of having an idea about what the market (i.e., traders) will do next. Some levels are more important than other ones. Armed with the information provided by the Fibonacci ratios and numbers, traders find it easier to spot and use such levels.
In some cases, the Fibonacci levels offer strong support or resistance – the bigger the timeframe, the stronger the levels. Other times, Fibonacci proportions reveal the timing of a possible market reversal.
To sum up, the Fibonacci ratios are crucial to technical analysis. Just like technical analysis studies would be impossible without trendlines, we can argue the same with regard to the Fibonacci tools.
This trading academy has used many examples involving Fibonacci ratios. Moving forward to the advanced sections, the Fibonacci tools and ratios remain among the most widely used as they combine technical concepts and principles in complex trading theories.