As we move deeper into the Elliott Waves Theory, you’ve probably noticed that it isn’t as simple as many believe. Impulsive and corrective waves forming on various degrees and belonging to different cycles aren’t easy to follow.
That’s especially true when the market forms Elliott Waves’ complex corrections. When the market forms a simple correction, the price action that follows the corrective wave must confirm it.
More precisely, for a flat pattern to be a simple corrective wave, the price action that follows the c-wave must fully retrace it. It also needs to do so in a limited time. The same goes for zigzags. As for triangles, the key is with the e-wave: The market must break the b-d trendline in less or the same amount of time it took the e-wave to form.
These are the conditions for simple corrective waves, as presented in the previous article. The reason this article starts with them is to reiterate their importance.
A complex correction is the next step in the Elliott logical process. If the price action that follows a simple correction doesn’t confirm it, there’s only one conclusion – the market is forming a complex correction.
Part of the Elliott logical process is figuring out what kind of complex correction is forming. There are various types, but they all have one thing in common: the intervening or connecting wave, also known as the x-wave.
The x-wave is subject to considerable controversy among Elliott traders. Some use different letter combinations for it, such as "w" or "y" or "z." But Elliott simply stated that the x-wave's role is to connect simple corrections. The way it does so is something of great debate.
Introducing the X-Wave
The x-wave is an intermediate or connecting wave. Any complex correction has at least one x-wave and at most two.
All x-waves are corrective. They can be either simple or complex, but they are always corrective. The x-wave creates confusion among Elliott traders, but the logical approach explained in the articles dedicated to the Elliott Waves Theory so far should make it easier to understand.
Elliott traders can anticipate the x-wave. It may not be clear from the start if it’ll be a simple or complex correction, but at least traders can know whether the market is forming a corrective structure.
If the market doesn’t confirm the corrective structure as simple, it must be complex, and at least one x-wave will follow.
Therefore, the key to complex corrections is identifying if the first correction is simple or not. If the time rule and the 0-b trendline requirements (as explained in the previous article) aren’t met, the market is forming a complex correction, and an x-wave will follow.
The x-wave is key in both understanding and trading complex corrections. It is responsible for determining the type of complex correction and offers clues about its structure.
Depending on the degree to which the x-wave retraces into the previous correction’s territory, traders differentiate multiple complex corrections. Elliott identified many of them – many more than simple ones.
The bias is that if the market forms a corrective wave, there is a high probability that the correction is complex. After all, the conditions for the market to confirm a simple correction are so difficult to meet that when it happens, many traders are caught by surprise.
The 61.8% Fibonacci ratio, coupled with the x-wave's length, reveal the nature and type of complex correction. Also, the x-wave has some restrictions in terms of the corrective wave of a lower degree that might form.
What Makes a Complex Correction?
A complex correction is nothing but a combination of simple corrective waves – flats, zigzags, and triangles. Think of all the combinations of these three patterns, and you have all the types of complex corrections.
One important thing to remember is that a complex correction never starts with a triangle. It always starts with either a flat or a zigzag.
There are multiple types of complex corrections, depending on the x-wave's retracement and the number of simple corrections (i.e., two or three) in the pattern. For instance, flat-flat-flat is a complex correction called a triple flat, and flat-zigzag-triangle is called triple combination. For both, the two x-waves retrace less than 61.8% of the previous simple correction. Called "corrections with a small x-wave," they appear much more often than corrections with a large x-wave.
As the name implies, corrections with a large x-wave have an intervening wave (or waves) longer than 61.8% of the previous simple correction. If they end with a triangle, they're called double or triple three combinations. If they don't end with a triangle, they're just double or triple threes.
The ability of traders to label complex corrections determines their success counting waves with the Elliott Theory. The difficulty of properly labeling complex corrections is the reason why many Elliott wannabees give up.
Types of Complex Corrections
Elliott used two criteria to distinguish complex corrections – the length of the x-wave and the final part of the x-wave (i.e., whether the complex correction ends with a triangle or not). More precisely, the first division is determined by the length of the x-wave, and then, depending on whether the complex corrections end with a triangle or not, Elliott made a further distinction.
Complex Corrections with a Small X-Wave
Complex corrections with a small x-wave are the most common ones to form. If the logical process leads to the conclusion that a market formation is not simple (and thus must be complex), the default assumption is that it is one with a small x-wave.
A small x-wave means that the intervening wave(s) should not end beyond 61.8% of the previous simple correction. This is important because sometimes parts of the x-wave retrace beyond this ratio but finish in line with the rule after all.
If the complex correction has three simple corrections connected by two intervening waves, both x-waves must respect this rule. The x-wave as a corrective pattern may be simple (zigzag, flat, or triangle) or complex (any type is possible).
- Rules to Follow
The first thing to do is to analyze the first simple correction. It can only be a zigzag or a flat, so the focus is on the element of time to confirm it as a simple correction. If the price action that follows doesn't respect the element of time, the market is forming a complex correction. At this point, we don't know if it has a small or a large x-wave, but we do know a complex correction is in the makings.
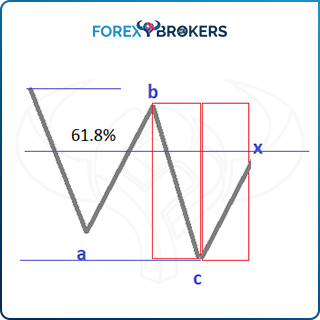
Note in the above graphic that the time expires and the market swing labeled a x-wave doesn't confirm the a-b-c structure as simple. Thus, it must be complex. Because the x-wave ended below 61.8% of the entire a-b-c structure, this is a complex correction with a simple x-wave.
Moving forward, the next question is the kind of complex correction with a small x-wave it is. It could be a pattern combining two simple corrections and one x-wave or one that combines three simple corrections and one x-wave. In the first instance, the market is forming a double combination. Another thing to consider is the complexity of the x-wave – look for it to be of a lower degree of complexity than the two or three corrections it connects.
- Double Combinations
By far the most common type of complex correction, double combinations start either with a flat or zigzag. For a complex correction to be a double combination, it must end with a different correction than the one it started with.
For instance, the previous example shows a flat pattern that wasn't confirmed by the price action as a simple correction. If the market forms a double combination, the second correction in it should be either a zigzag or a triangle.
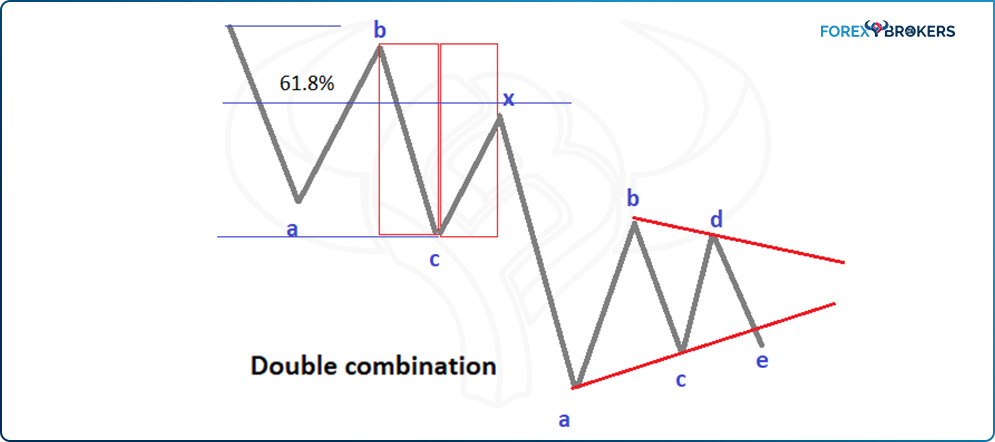
The pattern shown above is a double combination that ends with a triangle – the most common type of double combination that the market may form. The second correction in it can also be a zigzag, although this happens infrequently.

So far, all the rules discussed in the article dedicated to simple corrections remain valid. For instance, the zigzag must respect the element of time between the a-wave and the c-wave, and the b-d trendline in a triangular pattern must be broken in less or the same amount of time it took the e-wave to form.
The Elliot count for a double combination that ends with a triangle is a-b-c-x-a-b-c-d-e, where the first a-b-c is either a flat or a zigzag. In the case of a double combination that ends with a zigzag or a flat, the counting goes a-b-c-x-a-b-c, where the first a-b-c structure is a flat or a zigzag and the second a-b-c is the respective other.
- Triple Combinations
Sometimes the market continues in a correcting mode for a longer period. This is especially true when the second correction in a complex structure is not a triangle.
Remember that the Elliott Waves Theory is a logical process. Very often, the second correction of a double combination is a triangle. If it isn't, like in the above example, the market may be forming a double combination that ends with a zigzag, but that's highly unlikely. Instead, traders tend to suspect an even more complex structure – a triple combination.
Triple combinations always end with a triangle. We already have two rules for this structure that involve triangular patterns – it can’t begin with a triangle, but it must end with one, and almost always, the triangle is a contracting one.
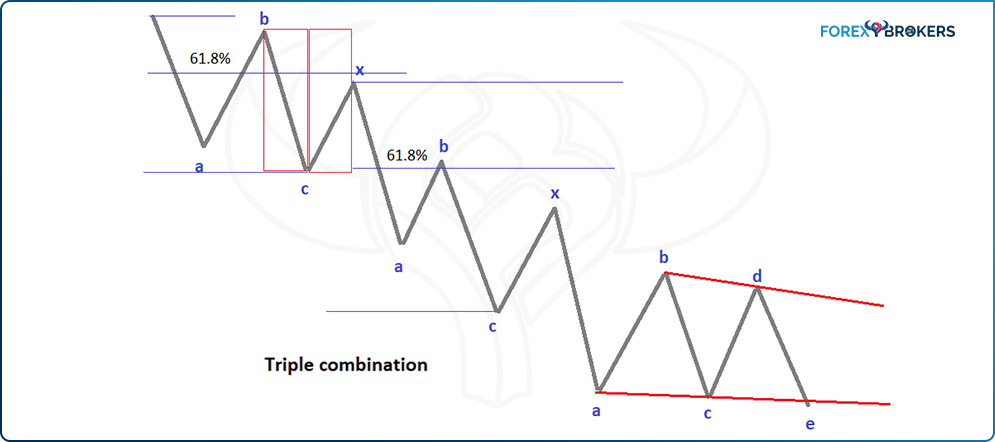
The second x-wave in a triple combination must also be a small one. Traders should measure the length of the second corrective phase from top to bottom and figure out the 61.8% level. That’s the level to watch for the x-wave to not close beyond.
As for the triangle at the end of a triple combination, it's almost always a contracting one. It's possible for it to be an expanding one, but contracting triangular patterns, especially complicated, special ones, often appear at the end of triple combinations.
When a triple combination forms on bigger timeframes like the daily chart and above, traders get the impression that the market is going nowhere and has no direction. Many Elliott newbies become discouraged and give up. That's understandable when you consider that out of the 13 segments in the triple combination illustrated above, only three are impulsive (the first two c-waves – one in the flat and the other one in the zigzag – and the second a-wave in the zigzag).
- Double Flats
Two flat patterns connected by a small x-wave form a double flat. Double flat patterns are rare formations. However, on the currency market, especially on currency pairs that correct a lot (e.g., cross pairs), they do appear.
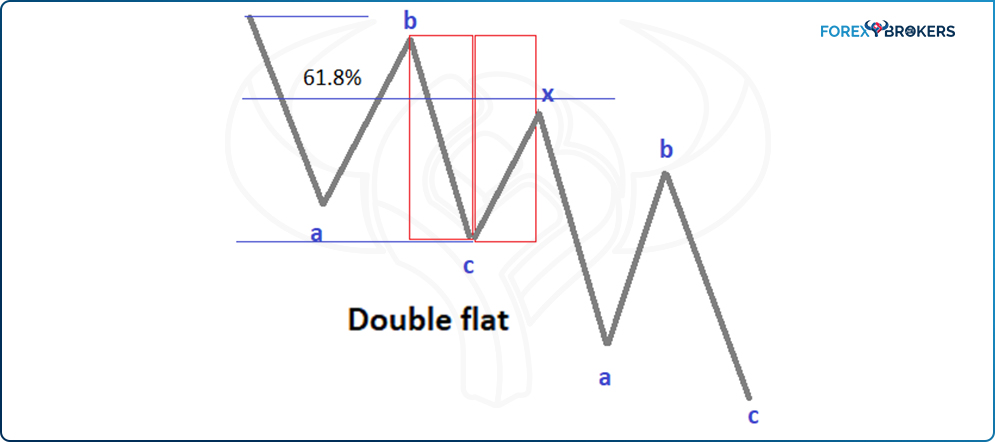
A double flat pattern's Elliott count is a-b-c-x-a-b-c. The two a-b-c structures are the two flats, and the x-wave is the intervening wave. To complicate things even more, the x-wave may be a flat pattern on its own, but to a lower degree. That means that all segments have the potential to be retraced by a minimum distance of 61.8%.
Traders can expect the two simple structures in a double flat pattern to be any type of flat. For instance, the first flat might be irregular and the second one a flat with a failure, and so on.
- Triple Flats
As the name suggests, the triple flat pattern has one more flat and one more x-wave. Triple flats are extremely confusing patterns. Basically, only two segments do not retrace more than 61.8% of the previous one, making it difficult to trade on a trend-trading strategy.
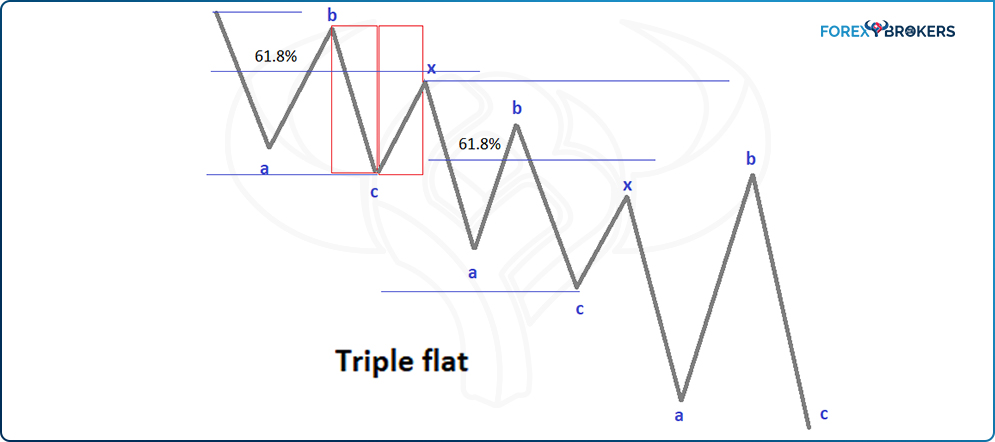
Triple flat patterns may appear as the leg of a contracting triangle, the second wave of an impulsive move, or the a-wave of a flat. These are only some examples, as triple flats may appear anywhere a corrective wave is possible.
Fortunately, this is the rarest pattern of all six patterns of complex corrections with a small x-wave. Even on the currency market, the likelihood of a triple flat forming is quite small.
- Double Zigzags
A double zigzag has little to no pullback. The x-wave therefore rarely retraces more than 38.2% of the first zigzag pattern.
Moreover, because Elliot’s double zigzags have four impulsive waves and small corrections between them, traders confuse them with an impulsive move of a larger degree. To add to the confusion, during the formation of a double zigzag, the price action is so fast (due to the small corrections) that traders have no chance to get out of a trade if caught on the wrong side of the market. Remember that in an impulsive move, the two corrective waves take some time to consolidate, so to label a double zigzag as an impulsive move of a larger degree, the two corrections should be visible.
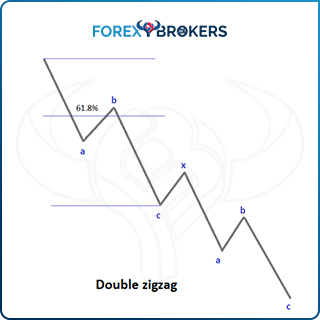
Another thing to consider when counting a double zigzag is that the pattern channels well, something that is not possible in a classic impulsive move. Therefore, if you ever find yourself trying to label an impulsive move that's channeling really well, interpret it as a double (or triple) zigzag.
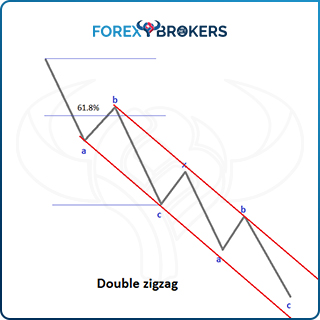
Double zigzags appear as the a-wave of a flat or a leg of a contracting triangle. The interesting thing is that double (and triple) zigzags are never fully retraced by a wave of the same degree.
- Triple Zigzags
Elliot’s triple zigzag is one of the most vicious complex patterns in the Elliott Waves Theory. It has six impulsive waves followed by little or no retracement.
Because the mandatory retracement of the b-wave in a zigzag is only 1% and it rarely retraces more than 38.2% of the a-wave, this market move is powerful enough to scare any trader thinking of taking the other side of a trade. In a triple zigzag, there are three b-waves, and the two x-waves retrace a very small distance into the territory of the previous correction.
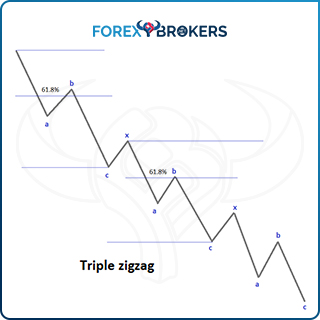
Triple zigzags are never fully retraced by a wave of the same degree. Also, a triple zigzag typically forms during the longest wave of a contracting triangle – the a-wave of a horizontal contracting triangle or the b-wave of an irregular contracting triangle.
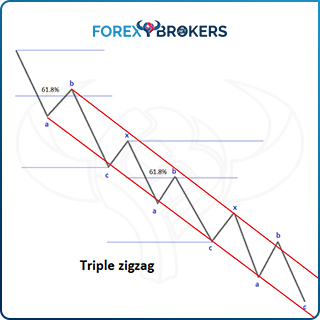
The channeling component is what reveals the true nature of a triple zigzag. Because of its aggressivity, triple zigzags are often confused with an impulsive wave of a larger degree. However, as explained earlier, impulsive waves do not move in a channel with parallel lines.
Complex Corrections with a Large X-Wave
A large x-wave retraces beyond 61.8% of the previous correction. This is the minimum retracement level – in some cases, it easily exceeds the 100% level and beyond.
A clear distinction between complex corrections with a small x-wave and those with a large x-wave is that the former evolve against the underlying trend, while the latter typically form on the horizontal. In other words, if, for example, a double combination appears as the second wave in an impulsive move, it will retrace deep into the first wave’s territory. Conversely, if, in the same place, a complex correction with a large x-wave forms, it'll evolve on the horizontal.
The more time it takes for it to form, the more powerful the market move in the third wave is. Also, the more complex it is, the more aggressive the third wave is.
Only the length of the x-wave differs when comparing complex corrections with a large intervening wave with those with a small one. Between the two categories, corrections with a small x-wave appear more often, especially on the currency market.
Like with complex corrections with a small x-wave, a triangle can’t appear at the start of a complex correction with a large x-wave, either. However, a triangle can form at the end of some of the patterns in this category, influencing the name of the patterns.
For instance, two corrective waves connected by a large x-wave form a complex correction with a large x-wave. If the second correction is not a triangle, it is called a double three. The name suggests two corrective waves (i.e., threes). On the other hand, if the second correction is a triangle, it is called a double three combination.
- Rules to Follow
Elliott traders don't know what the market will form when a simple correction appears. Provided it is not a triangle, the first thing to do is to wait and see if the price action confirms it as a simple correction.
For this, draw the 0-b trendline and wait for the price to break it in less time than it took for the c-wave to form. If that happens, also look for the price to fully retrace the c-wave. A key aspect here that creates confusion among Elliott traders is that sometimes, the b-wave doesn't end at a high. If it ends with a triangle, the c-wave begins from the moment the triangle ends. In such a case, the 0-b trendline has a different angle, so traders must pay attention to these kinds of details.
If the market doesn't confirm the correction as a simple one, it must be complex. The next thing to do is measure the length of the first correction using a Fibonacci Retracement tool and determine the 61.8% level. If the x-wave retraces beyond this level, the market is forming a complex correction with a large x-wave.
The x-wave is always a corrective structure. Because of its unusual length, expect it to be from the zigzag family – a zigzag, double zigzag, or triple zigzag – and for the market to move fast during its formation.
We mentioned earlier that a complex correction cannot start with a triangle. But in the case of complex corrections with a large x-wave, it is also unusual for them to begin with a zigzag. Therefore, if you see the x-wave retracing over 61.8% of the first correction and the first correction is not a flat, quickly double-check the count, as the probability of an error is very high.
- Double Three Combinations
Whenever you hear or see the word “combination” together with “double three,” it means two things – one is that the market is forming a complex correction with a large x-wave, and the other is that the last part of it is a triangle.
Also, because rarely do we see a zigzag at the beginning of such patterns, expect a flat to form first before the market accelerates in the opposite direction during the x-wave. Finally, keep in mind that all corrections in this category form more or less on the horizontal and not do dive much into the previous market swing.

In the structure in the previous image, only the first c-wave (i.e., the one belonging to the flat pattern) is impulsive. The rest of the eight segments are corrective, of a lower degree, and either simple or complex.
A double three combination (and pretty much all complex corrections with a large x-wave) that appears in an impulsive wave is never the fourth wave but always the second one. The explanation is that after a long consolidation period like the one here, the market accelerates in a strong trend, typically the third wave of an impulsive wave of the same degree.
Interesting enough, the labeling of a double three combination is similar to that of a double combination: a-b-c-x-a-b-c-d-e. Only the length of the x-wave and the fact that double three combinations form on the horizontal distinguish the two.
- Double Three
Like a double three combination, double three is likely to start with a flat. It can be any kind of flat, but try to avoid labeling one as a double three if it starts with a flat with a failure (i.e., a flat with a b-failure, a flat with a c-failure, a flat with double failure, a flat with irregular failure).
The reason is that a flat with a failure is a sign of countertrend strength. If a complex correction begins with such a flat, it is unlikely that the market will further consolidate.
However, it is very likely that the second corrective phase of the double three will be a flat with a failure, suggesting an explosive move in the opposite direction.
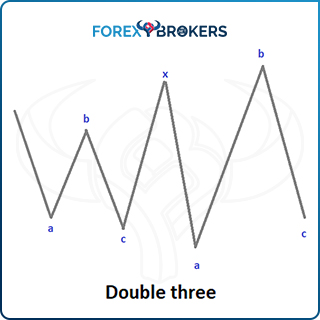
In this arrangement, the double three has two flats and one x-wave. It is similar to the double flat both in structure and labeling (a-b-c-x-a-b-c). Again, the only difference is the x-wave, which retraces much more than the first flat.
Any type of flat can appear during a double three pattern. Here, the first flat is a common flat – the b-wave retraces more than 80% of the previous a-wave, and the c-wave only marginally exceeds the start of the b-wave.
The second flat is an irregular failure. While the b-wave fully retraces the previous a-wave, the c-wave is not strong enough to retrace the b-wave completely. It fails to do so, which signals a powerful countertrend move.
- Triple Three Combinations
Because the word “combination” appears in the name of this correction, we already know it ends with a triangle, and because we’re talking about complex corrections with a large x-wave, the first correction is likely to be a flat.
Does a move like the one below ring a bell? Often in the currency market, you’ll find such structures impossible to count at first glance.
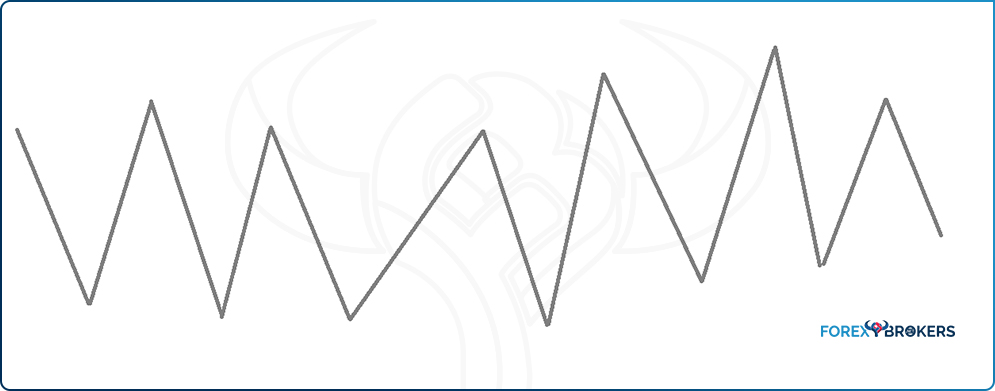
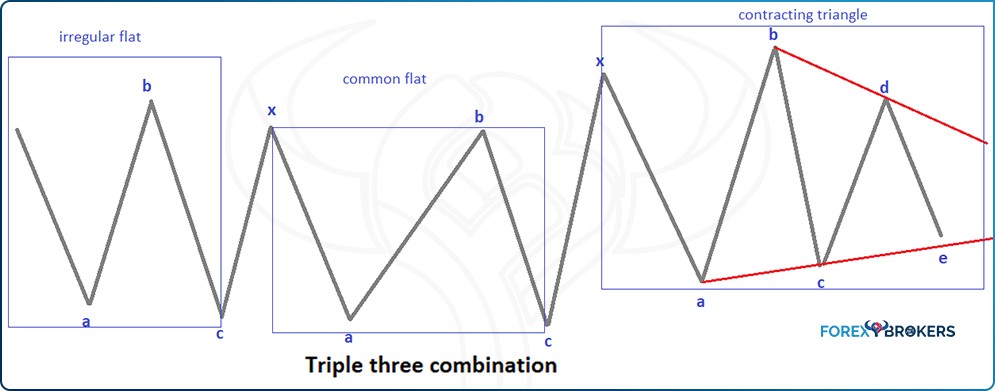
However, following the rules set by the Elliott Waves Theory and the logical process behind it, we note that the pullback after the first flat exceeds the 61.8% level. That’s enough to give us a clue about how to label the pattern.

Now it isn't that complicated anymore. But it could be – for instance, the a-wave of the triangle could be a flat on its own, as could the b-wave, and so on. That means that it is possible to have even more horizontal market swings than what is seen in the picture above.
In any case, regardless of how many swings the price makes, in the end, Elliott traders must end up with only three corrections connected by two large x-waves. In this case, the flat-flat-triangle combination is labeled similarly to the triple combination discussed earlier in this article: a-b-c-x-a-b-c-x-a-b-c-d-e.
- Triple Three
The triple three pattern doesn't have a triangle at the end of it but rather, most likely, another flat. If the market forms a flat with a failure as the last corrective phase of a triple three, the next market segment of the same degree as the triple three will be very powerful.
A triple three is similar to the triple flat pattern, with two distinctions – one is that the market consolidates on the horizontal during the triple three pattern, and the other one is that the two x-waves exceed the previous corrective phase by 61.8%.
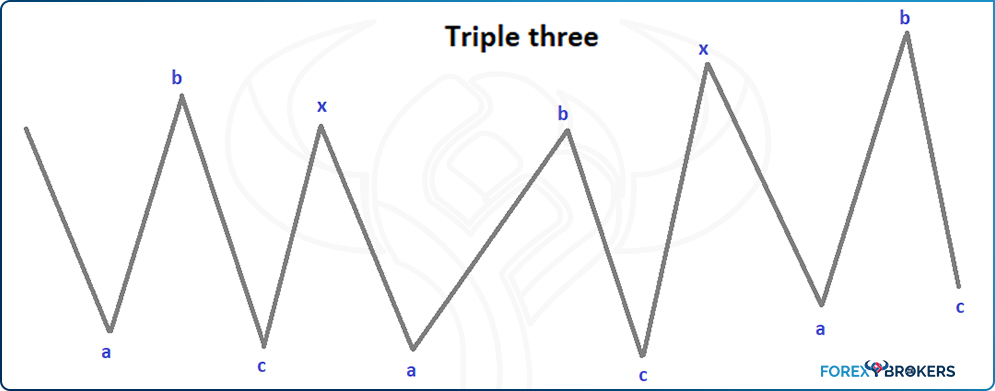
As rare formations, triple threes seldom appear in the currency market. The likelihood of seeing one is increasingly high the lower the timeframe is. Essentially, the daily, weekly, and monthly time frames are rarely capable of showing such confusing market price action.
Running Complex Corrections
One of the most difficult concepts in the Elliott Waves Theory is the running concept, where a correction ends up above (in bullish patterns) or below (in bearish patterns) where it started. Most traders simply refuse to accept that such patterns exist, but they do – in the currency market, they appear quite often.
If we were to rank different types of complex corrections in terms of frequency, running corrections would come in second tightly behind double combinations. There are many types of running corrections, and we won't list them all here. Ultimately, they follow the same rules as everything else thus far – simple corrections connected by large x-waves.
However, this time, the x-wave(s) are very large – so large that it is very easy to interpret them as impulsive waves when the market is, in fact, forming a double or triple zigzag.
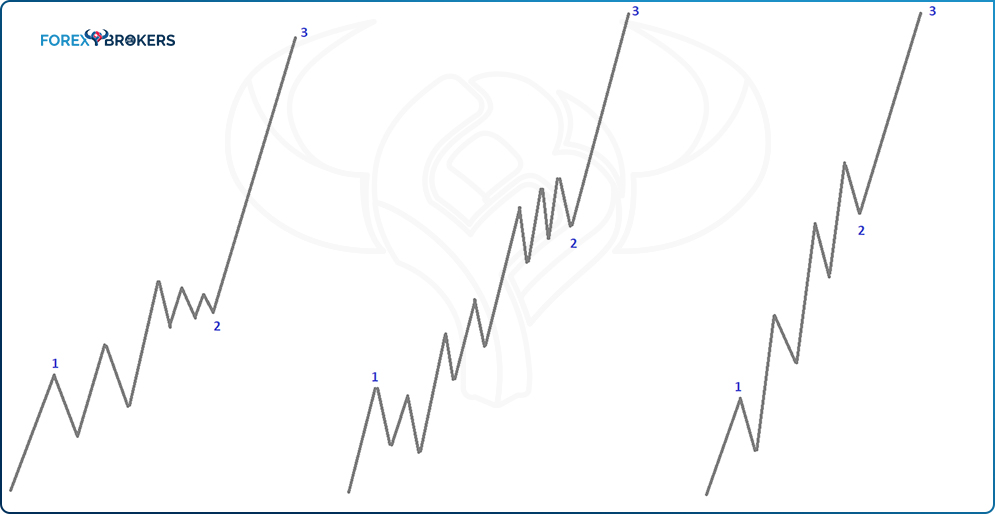
The typical place for a running complex correction is in the second wave of an impulsive move. When it forms, the third wave is always the extended wave.
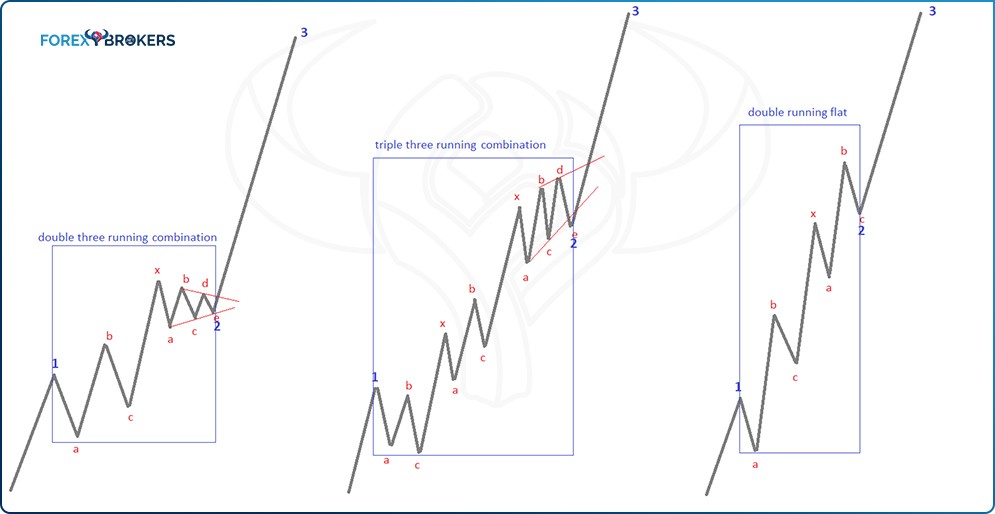
The three examples above show a running complex correction forming between the end of the first wave and the end of the second wave. Focus on the start and end point of the second wave, and you'll understand why these corrections bear the name "running."
Double Three Running Combination
The first example is a double three running combination. Again, because it ends with a triangle, its name ends with "combination."
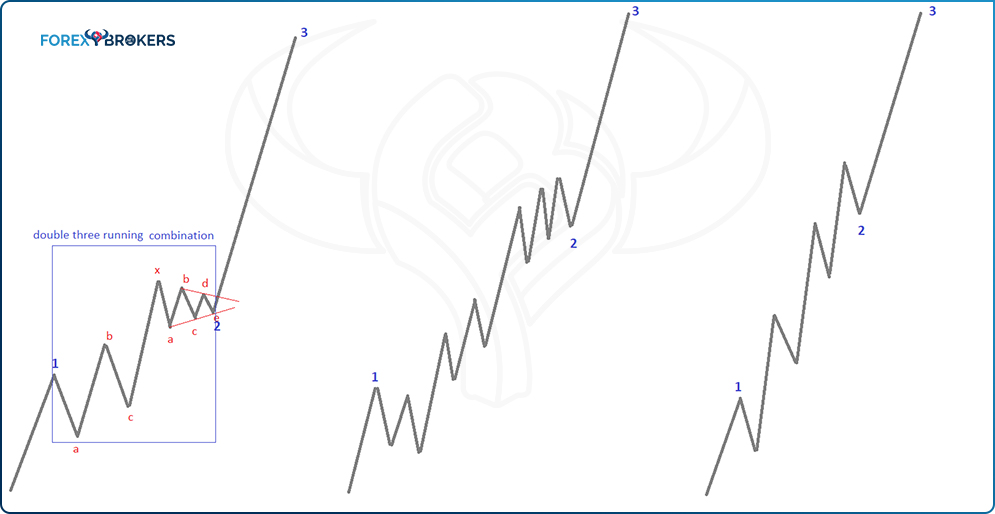
It starts with a flat with an irregular failure and then a very large x-wave. The x-wave is most likely a type of zigzag (double or triple zigzag) or an irreversible double combination that starts with an elongated flat – the elongated nature of the flat pattern gives way to the strong move in the large x-wave. In this case, it ends with a horizontal contracting triangle, but it could end with any type of contracting triangle or even expanding one, including a running triangle.
Triple Three Running Combination
A triple three running combination has one more correction before the final triangle. One thing to remember here is that the second correction in a triple three running combination pattern can't be a triangle – it must be a flat or a zigzag.
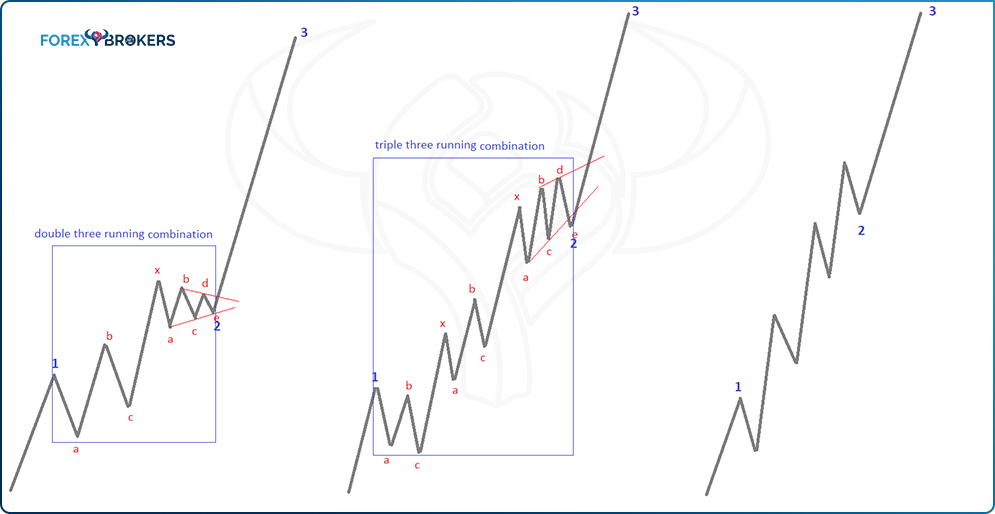
Check where the first and second waves end in relation to where they start, and you have a good example of what a running correction looks like. The labeling is similar to that of a triple combination or triple three combination: a-b-c-x-a-b-c-x-a-b-c-d-e.
Double Running Flat
The third example shows a double running flat pattern forming as the second wave of a third-wave extension impulsive structure. It is just an example, as the market may also form a simple running flat or a triple running flat, but no more than three running flats will form in any single complex running correction.
Real Market Examples of Elliott Waves Counts
So far, this trading academy has covered theoretical aspects of the Elliot Waves Theory. This is normal, as the theory is nothing but a very long set of rules for traders to respect.
In practice, market movements differ from the lines we’ve drawn to explain the patterns. For this reason, this academy also uses videos to illustrate how Elliott patterns look in the currency market. Here are some examples of what labeling the FX market looks like when using the Elliott Waves Theory.
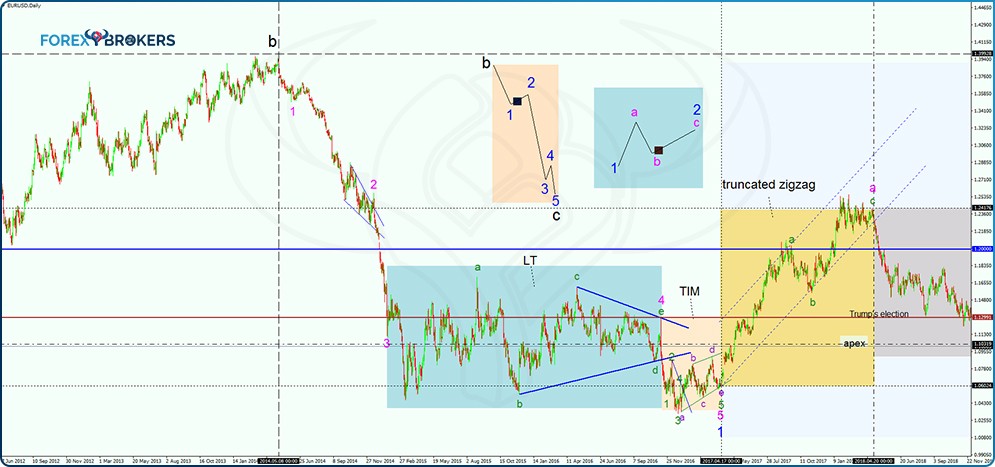
This is the price action for EURUSD in recent years. The market ends with a b-wave in gray (the colors show different Elliott cycles), followed by an impulsive wave as the c-wave of a flat.
However, the c-wave in gray has barely started, according to this labeling, and the first swing lower is wave 1 of a lower degree (blue). The internal count shows 1-2-3-4-5 in pink, where the second wave is a running correction and the third wave extends it. The black squares on the top of the chart show where the market lies from a bigger perspective – the c-wave of a flat and the second wave of an impulsive move of a lower degree.
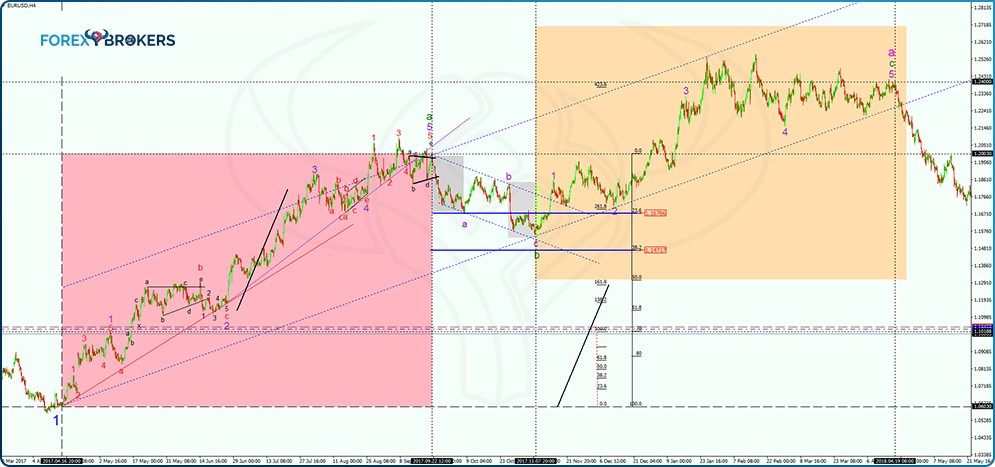
The internal structure of the truncated zigzag (wave a in pink) appears here. I’ll let you follow the count, keeping in mind that the market must confirm the truncated zigzag by retracing a minimum of 80% from start to end. It does so on the move to 1.10 from the 1.25 high in the truncated zigzag pattern.
Check out our video about Elliot Waves’s Complex corrections:
Conclusion
There’s a big difference between theory and practice. Like in any field, a full understanding of how the Elliott Waves Theory works requires years of experience and practice.
Traders who believed that counting waves following the Elliott principle was easy have no doubt changed their mind – and we’re only just getting started.
So far, this trading academy has presented the basic principles and structures, but more finesse is to come in the future sections. We'll deal with concepts like the importance of a top/down analysis, detailed double combinations structures, the waterfall concept, and how terminal impulsive waves form.
The top/down analysis will put together everything discussed so far about the Elliott Theory. It is only natural that the academy will continue with this topic.


