LISTEN TO THIS ARTICLE:
Perhaps few would dedicate a full article on a trading academy to the Reserve Bank of New Zealand (RBNZ). However, we would.
The RBNZ is a unique central bank from all points of view. It is the central bank that initiated and probed for the first time in history the notion of inflation targeting. From that moment on, the rest of the developed nations in the world followed suit.
The New Zealand model remains in place decades after its implementation and brought price stability in many parts of the world. The courage to apply inflation targeting in New Zealand brought the RBNZ worldwide fame.
For this reason, this article treats the historical perspective of inflation targeting, how it was implemented first in New Zealand, and what convinced other central banks to embrace the concept. Also, we will have a look at the particularities of the New Zealand economy, its place in the world’s economy and the role of the New Zealand dollar (NZD) on the FX dashboard.
Moreover, the article will cover in-depth the monetary policy decision process in New Zealand and how the central bank changed its mandate recently. Finally, we will have a look at central banks’ digital currencies and their role in twenty-first century central banking.
There is something unique for currency traders interested in speculating on NZD pairs. For example, NZD pairs require one of the smallest margins on the FX dashboard to open a position. This is especially important from a money management perspective and for how to execute a trading plan. Traders willing to profit from a risk-on move (i.e., a lower USD across the board) will be better off buying NZDUSD instead of GBPUSD because of the margin requirement.
Particularities of New Zealand’s Economy
The New Zealand economy, while small in comparison with other countries, is one of the most developed economies in the world. The island nation has a population of only five million people, which is why it was easier for it to contain the coronavirus pandemic. Since we are on this subject, the relatively small number of people coupled with a strong government reaction and natural physical, natural boundaries made it possible for New Zealand to effectively eradicate the virus’ spread.
New Zealand has one of the star economies in the southwestern Pacific Ocean, exporting its goods throughout the region and beyond. Wines from New Zealand are well known all over the world, for instance. Therefore, it not only exports in the region, but worldwide.
If we are to deliver some statistics, over half of New Zealand’s exports typically go to Asian countries. On top of that, about 15% go to other Oceanic countries, mostly to its main neighbor – Australia. Finally, about 11% of exports reach the United States and a little under 19% go to Europe.

The Reserve Bank of New Zealand
The RBNZ sets the monetary policy for the economy and fulfills all the roles of a central bank – it acts as a lender of last resort and, at the same time, acts as a banker’s bank. The bank became famous in worldwide central banking due to the pioneering of inflation targeting in the late 1980s.
More precisely, after 1988 when the RBNZ pioneered inflation-targeting, all major central banks in the developed world adopted a similar framework. In the 90s, it became clear to developed nations that certain levels of inflation around a target stimulate economic growth. As such, inflation-targeting translated via price stability around a target.
Fast forward to the twenty-first century, and the RBNZ is a modern central bank using both conventional and unconventional tools to reach its mandate. Price stability sits at the core of modern central banking in the developed world. However, the targeted inflation differs from central bank to central bank. For instance, the European Central Bank considers price stability achieved if it manages to bring and keep inflation below, but close to two percent.
Also, the Federal Reserve of the United States looks at a similar definition, although it changed it in 2020. The Fed used the 2020 Jackson Hole Symposium to announce that it was shifting the price stability definition of its mandate from the 2% as defined by the Personal Consumption Expenditure (PCE) to an Average Inflation Targeting (AIT).
Policy Target Agreement at the RBNZ
It is only normal for a central bank to change its price stability target from time to time. In the case of the RBNZ, the inflation target has also changed over the years. Nowadays, the RBNZ uses a Policy Target Agreement (PTA) last revised in 2018. It targets inflation as measured by the Consumer Price Index (CPI) between 1% and 3%, with average inflation near the midpoint, or 2%.

As the above chart shows, the current CPI as measured in September 2020 sits at 1.4%, within the price stability range defined by the PTA.
Historical Background
The RBNZ has a long history, and so does the New Zealand economy. The central bank was founded in 1934 and issued its first notes series in the same year. It took another six years until the RBNZ issued other notes series. Originally having a staff of only twenty people, the bank ended up employing over 200 people by 2009 and the number continues to grow as the role of the bank expands in areas like statistics, research, regulation, supervision, etc.

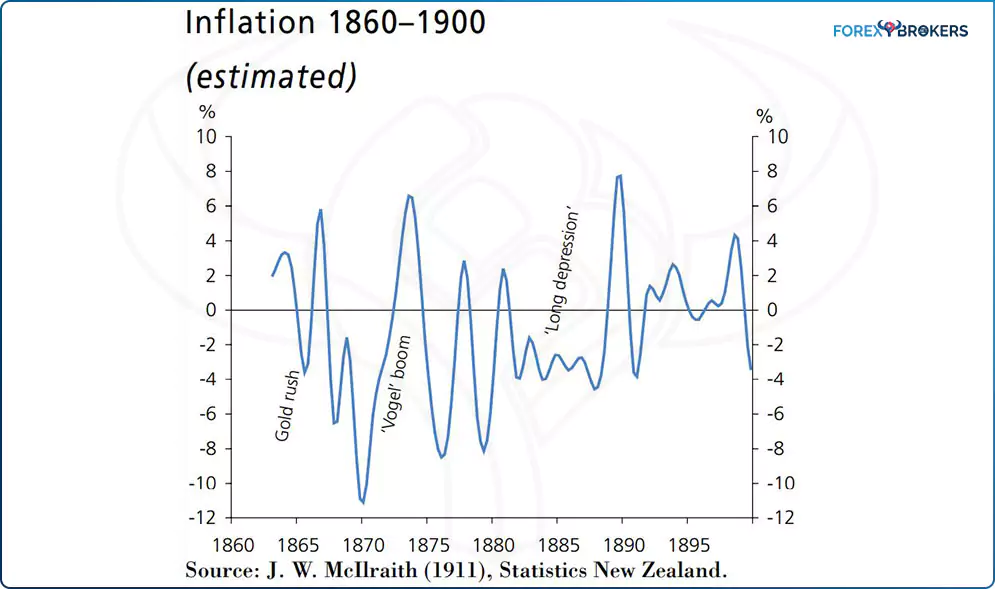
Prior to the RBNZ’s existence, the pre-1840 period is known as the Maori economy. After Europeans arrived, an economy emerged and 1840-1890 marked the period of the Colonial economy in New Zealand. The period between 1860 and 1900 was marked by swings of inflation from +8% to -11%, generated by various phenomena like the gold rush or the long depression in the 1880s.
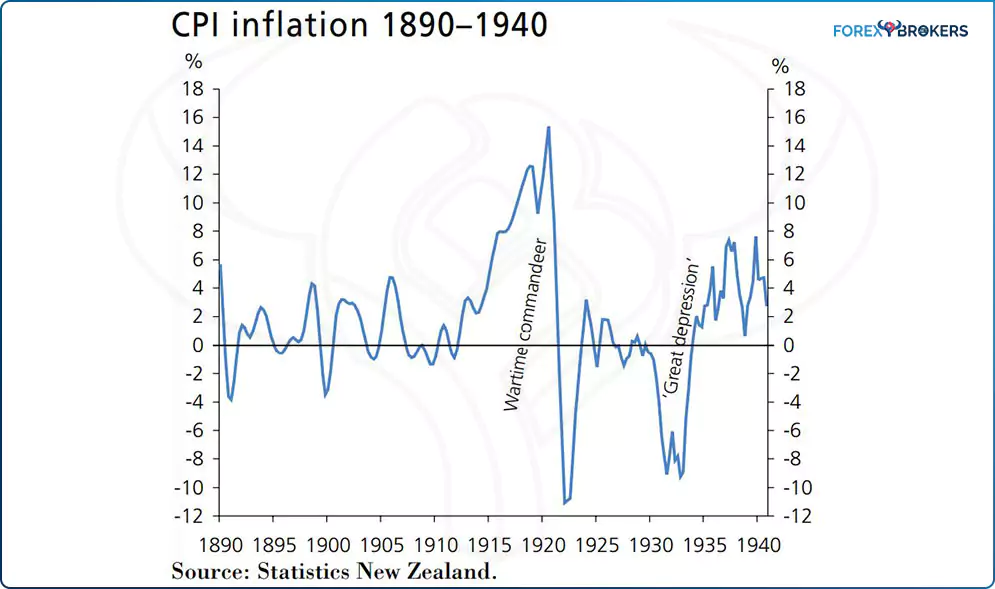
A notable change in price stability was seen by the time the RBNZ appeared. Shortly after the Great Depression, inflation climbed back into positive territory, and the GDP continued to grow as New Zealand was a net exporter of goods during both wars.
Nowadays, the RBNZ is responsible for setting the monetary policy, it has a supervision and regulatory role, and closely monitors economic developments before releasing its interest rate decision. It sets the Official Cash Rate (OCR) currently at 0.25% (November 2020) and is also involved in unconventional monetary policies.
What Is Inflation Targeting and When Was It Implemented for the First Time?
The inflation targeting model was first introduced by the RBNZ in 1989. Ever since, developed countries adopted a similar framework, although the targeted inflation differed from country to country. However, following the RBNZ example, everyone agreed that it is easier to reach sustainable economic growth with stable and moderate inflation. As such, central banks tried to avoid inflation declines below zero and into deflationary territory.
In 1989, the RBNZ was given operational independence, in the sense that it was the sole institution to decide on the best measures to take to achieve the inflation target. For the first time in history, a central bank was free to raise or cut the interest rates as appropriate to achieve its target.
This does not mean that the New Zealand government threw the responsibility away. All it meant was that the central bank gained independence but was still held accountable for its actions by the government and therefore the population who elects the government members.
At that point in time, the RBNZ was only operationally independent, as it is today. But some other central banks in the meantime adopted a dual role, by deciding to be both operational and target independent. This means that some central banks (e.g., European Central Bank) took the idea of the RBNZ to new lengths by also specifying a time horizon to achieve the inflation target.
Going back to 1989, the agreement between the Minister of Finance at that time and the governor of the RBNZ was based on four main points: price stability, how inflation may vary around the target, what the policy target is, and how future communication between the two parties will take place.
New Zealand’s Monetary Policy Meetings
The RBNZ decides and communicates the monetary policy seven times a year. With some exceptions (e.g., Reserve Bank of Australia) all central banks in the developed world evaluate the monetary policy stance every six weeks. It used to be more often, like monthly, but that changed in recent years.
Also, something else changed with the RBNZ decisions – the timing of the release. The dedicated day for the RBNZ decision is Wednesday. Each central bank follows a specific calendar and has certain days associated with their monetary policy announcement. For example, the ECB and BOE make their announcement on a Thursday, the RBA on a Tuesday, and the Bank of Canada, RBNZ and the US Fed, on a Wednesday. Depending on the time of the year, some days may have two or more central banks releasing their policy.
For many years, the RBNZ monetary policy announcement came one hour after the FOMC Statement and press conference. Because the Fed is the most important central bank in the world due to it setting the federal funds rate on the world’s reserve currency, the RBNZ decision was often ignored by market participants.
Another thing that contributed to the change in the timing of the release was increased market volatility. Because of the Fed’s decision and press conference, the volatility increased, and so did the spreads. By the time the RBNZ announced its decision it was almost midnight in Europe and late in the United States and so the spreads increased dramatically, especially on NZD pairs that are not so liquid. Recently, the RBNZ changed the release to 03:00 CET time or 02:00 London time, to avoid overlapping with any potential Fed decisions.
Monetary Policy Decisions in New Zealand
When it communicates the monetary policy, the RBNZ uses different channels to do so. The pillar of every decision is the official cash rate. Any change in the rate is usually priced in the market because central bankers prefer to communicate their intentions well ahead of the decision.
Next, traders’ attention focuses on the future. While the interest rate decision may be priced in, the future projections often offer surprises. This is when the market moves. For instance, consider the November 2020 RBNZ interest rate decision. Coming out on November 11th, it left the official cash rate unchanged at 0.25%.
However, the NZD pairs reacted positively, with the NZDUSD pair climbing above 0.69. This came in the context of USD strength against the EUR and other major pairs, so one can easily attribute the reaction to the RBNZ statement.
Speaking of the RBNZ monetary policy statement, it includes details about how the central bank plans to achieve its mandate focused on inflation targeting. More precisely, the steps the bank is willing to take to bring inflation between 1% and 3%, with the focus on the middle of the range. In doing so, it looks for a horizon of five years in the future and also interprets what has happened in the six weeks since the previous meeting.
One hour after the RBNZ’s decision on the cash rate and the monetary policy statement, a press conference starts at 04:00 CET or 03:00 London time. The reason why we mention the European times is that, despite Brexit, London remains the most important financial center in the world and most of the trading is done during London hours, especially when New York traders come in too.
RBNZ Including Employment In Its Mandate
Between the monetary policy decisions and announcements, the RBNZ uses various other channels to prepare the market for shifts in its policy – or, even in its mandate.
For example, throughout any given calendar year, the RBNZ gives more than one hundred presentations to various business groups, organizations, and so on. It also uses its Twitter channel to communicate its intentions as well as speeches at different events.
What is the purpose of such efforts? Sometimes the market does not understand the central banks’ message. Or some other times the bank fails to properly communicate its message.
For example, in October 2020 the ECB failed to properly communicate its dovish stance. Instead, the market took the press conference as slightly hawkish, sending the EUR higher across the board. It took one day for the ECB to publish a blog on its website to correct the market and to explain what it really meant. As a consequence, the EUR gave up the earlier gains.
The RBNZ used these channels to communicate its change in mandate. It now looks at employment levels, not just inflation data, before setting the official cash rate and overall monetary policy. If follows the Fed’s model of having a dual mandate based on job creation, targeting full employment and price stability.
Another coincidence is that the Fed altered its mandate this year, too. It now targets average inflation, something that may soon be embraced by other central banks.
Whether that is the case or not, remains to be seen. One thing, though, is certain. The RBNZ pioneered inflation targeting as we know it today and remains one of the most innovative central banks in the world.
The New Zealand Dollar
The NZD has a long and interesting story. Nowadays it is known as one of the currencies that free-float on the currency market and is part of some interesting currency pairs.
It is liquid enough for a retail trader to trade it in decent sizes. However, in large volumes, consider slippage as an additional cost for most NZD pairs.
The NZDUSD used to have a positive carry for many years. Supported by a very long economic expansion in Australia that lasted decades, the New Zealand economy “imported” some characteristics of its biggest neighbor. As such, interest rates in Australia and New Zealand outpaced those in the United States, for example. With a positive interest rate differential, many traders adopted strategies that involved carrying positions overnight and mostly favored long positions on the NZD and AUD pairs.
Consider the economic recession prior to the 2020 coronavirus pandemic recession– the 2008-2009 Great Financial Crisis. Economic theory states that the business cycle evolves around the long-term growth rate of an economy. When an economy contracts, the contraction leads to a recession or, in the case of a severe recession, to depression.
The crisis started in the United States and quickly led to a recession. The recession then spread to Europe, but failed to reach much of Asia, not to mention Australia and New Zealand. Next, the European states faced the sovereign crisis in 2012 – another recession not seen in New Zealand and Australia. Therefore, the NZD benefited from the interest rate differential as long as the economy remained in the expansionary phase of the business cycle.
Historical Perspective
The history of the NZD is strongly connected to the British Empire and, therefore, with the British pound, or sterling. The NZD traded at parity to sterling and at that point in time it was called the New Zealand pound. This is an important piece of information for traders searching historical data on the New Zealand dollar when they want to interpret long-term patterns. For the correct interpretation, traders must also find the New Zealand pound data and add it to the New Zealand dollar data to obtain the full evolution of the local currency. This is important information when trading historical cycles or when interpreting and counting waves of bigger degrees with the Elliott Waves Theory.
The Sterling Period
Up to 1914, one hundred New Zealand pounds equaled 100 pounds sterling. And then the First World War broke out, and with it the gold standard was abrogated.
By 1931, 110 New Zealand pounds equaled 100 pounds sterling. Furthermore, in 1931 the exchange rate moved to 125. As mentioned earlier, the Reserve Bank of New Zealand was established in 1933 under the Reserve Bank Act. One of the requirements for the RBNZ was to provide sterling liquidity against the local notes issued. Also, it was required to hold a minimum 25% of notes issued in reserves.
Another milestone to mention in the history of the New Zealand’s pound was the 1948 revaluation to restore parity with the sterling. Effectively, the New Zealand pound appreciated 25% and the parity held even one year later when the pound sterling declined almost a third in value against the U.S. dollar. In fact, by holding the parity, the RBNZ managed to devalue the currency and so its exports became even more competitive on the international markets. As a sidenote, a strong currency favors imports because the population perceives foreign goods and services as being cheaper than local ones. In contrast, a weaker currency favors exports, because the opposite is true.
The Smithsonian Agreement
Known as the Smithsonian Agreement, this event refers to New Zealand’s decision to elect the US dollar as the intervention currency. To do so, New Zealand severed ties with sterling and in December of 1971 the agreement came into place. At that time, the exchange rate for one NZD was 1.1952 USD.
The middle of 1972 brought a major change in the international financial markets. Eighteen currencies, including sterling but excluding the USD, began floating. The USD continued to weaken and because New Zealand maintained parity with gold, 1 NZD ended up valued at 1.3511 USD in February 1973.
And then the United States allowed the USD to float. The move created chaos on the international financial markets, and was responsible for New Zealand terminating the link with the USD.
The Nixon Shock – Free Floatation
The world’s financial order as we know it today came into existence after the Nixon shock in the 1970s. In a surprise move, the United States announced that it was giving up on the gold standard, in place since the Bretton Woods Agreement a few decades later.
Suddenly, the world realized that there would be no gold to redeem in exchange for fiat dollars. Therefore, the model was quickly copied around the world and free-floating began.
It was the birth of the currency market as we know it today. If you want, it was the incipient phase of the FX market.
Then in 1978, the United States announced that both the U.S. Treasury and the Federal Reserve would intervene in markets to support the USD. The decision triggered the suspension of trading for all currencies except for the USD, sterling, and the Canadian dollar.
Starting in 1985, the New Zealand dollar was allowed to flow against all currencies. Following the Nixon shock, for a few years a “crawling peg” was in place that allowed the New Zealand dollar to compensate for differences between inflation in New Zealand and in the countries of their trading partners.
Things to Know When Trading the New Zealand Dollar
For the FX trader, the NZD pairs present many particularities. Of all the NZD pairs, some are more popular than others, due to the different liquidity levels as well as different market conditions.
One of the biggest advantages of the New Zealand dollar pairs is that they require less margin than most of other currency pairs in a regular brokerage house offering. Because of that, the broker blocks less margin (therefore, more available margin for new positions). This is important especially if we consider the fact that the FX industry has changed in recent years and now most brokers in the developed world only allow 1:30 as leverage.
Another thing to consider is the dairy market prices. Just like Australia is looking at the changes in the commodity prices indexes, the New Zealand economy depends on the dairy prices evolution. Demand from countries in the region plays a key role for the New Zealand economy.
When trading the NZD, the first thing to consider is the RBNZ and its monetary policy. However, unlike other currencies, for the NZD the dairy prices play an even more important role than inflation or the unemployment rate.
Liquidity
As a rule of thumb, the liquidity is relatively poor on the NZD pairs. For this reason, traders that plan to trade large volumes on the NZD pairs should consider splitting their positions into smaller ones.
Therefore, if one trader intends to sell, say, one hundred lots on the NZDUSD, or fifty lots, the ideal trading strategy should consider splitting the positions into smaller ones, like ten lots per position. By doing that, unnecessary slippage is avoided.
Slippage happens especially when the trader uses an ECN (Electronic Communication Network) account or STP (Straight-Through Processing). By doing so, the broker guarantees the execution if there is a market. However, when using a pending order, or even when trading at market, it is difficult to fill the orders at the expected level. Therefore, slippage is a cost that must be considered when trading NZD pairs with larger than normal volume.
Another thing to consider is the number of liquidity providers that the broker has. This is kind of difficult information to find out, but the more liquidity providers, the better. An ECN broker routes all the orders to the liquidity pool and from there picks up the best quote. When more liquidity providers exist, there are better chances for the order to be filled as close to the market as possible.
NZDUSD
Needless to say, the most actively traded NZD pair is the NZDUSD. Traders should be aware that it has a direct correlation with the AUDUSD pair. This positive correlation is easy to spot by looking at the cross pair that reflects the differences between the two majors – the AUDNZD cross. In recent years, the cross hovered around parity, trading a few big figures either above or below parity.
Therefore, it reflects the direct, positive relationship between the two majors. Rarely will the NZDUSD pair differ from the AUDUSD pair’s price action. However, when it does, most of the time the divergence is caused by the RBNZ.
Take the November 2020 interest rate decision, for example. The RBNZ kept a hawkish tone and the NZDUSD reached 0.69. At the same time, the AUDUSD traded with a bid tone as well, but its advance was literally dwarfed by the NZDUSD move higher.
Central Banks’ Digital Currencies – Will RBNZ Get Involved?
Digital currencies have had a great year so far. At the time of writing this article, Bitcoin is trading close to $18,000, while most of the classic FX market are moving in tight ranges. Also, gold diverged from its direct correlation with Bitcoin.
This year brought intensive discussions between central banks around the world regarding the benefits of central banks’ digital currencies. The increase in popularity of cryptocurrencies like Bitcoin and Ethereum made central banks look into the area. As such, many central banks dedicated important resources, both financial and human, to the subject.
Not long ago the ECB announced that it had applied for the trademark for a “digital euro”. Other central banks, including the US Fed and Bank of Canada, announced that they are studying the subject closely.
More importantly, the Bank for International Settlements, based in Basel, Switzerland, published a paper in which all major central banks discussed the potential benefits and dangers of a CBDC (Central Bank Digital Currency).
The point here is that we should not be surprised to see the RBNZ and other central banks in the developed world (and elsewhere) make a swift transition to the digital space a few years from now. CBDCs will not create direct competition to Bitcoin or other cryptocurrencies currently circulating. Instead, they will use the blockchain technology benefits and expand the fiat currency into the crypto space.
In other words, a digital Kiwi dollar will be just an extension of the fiat currency. Or the digital euro will be just an extension of the fiat euro.
The major advantage here would be that new regulations in the crypto space will make it safer and trustworthy. Moreover, the CBDC will benefit from all the functions of money and the full faith of the central bank. Knowing the proactiveness of a central bank like the RBNZ, we should not be surprised to see a digital Kiwi dollar introduced sooner rather than later.
Conclusion
After the 1970s and the Nixon shock, inflation and inflation expectations became the key elements in setting the monetary policy. As the first central bank that pioneered inflation targeting, the RBNZ remains in history as the one that opened the doors to decades of developments in monetary policy.
As we saw in the last several years, monetary policy changes continuously. What seemed to be impossible, suddenly becomes possible. For example, before the 2008-2009 Great Financial Crisis, lowering the interest rate below zero (i.e. setting negative interest rates) was considered to be impossible without dramatic economic consequences.
Yet, not one, but many central banks did so. The ECB, Bank of Japan, and the Swiss National Bank, are only a few examples. Quantitative easing, or the process of a central bank buying government bonds with the aim of lowering the yields on the yield curve, is another example.
Innovation seems to be the name of the game. Just as the RBNZ innovated with inflation targeting, the Fed did so with quantitative easing. This is just an example of how decades of monetary policy did not change the ultimate purpose of a central bank – to fulfil the mandate entrusted by the government.
The RBNZ model remains to this day the most copied model in the world. Nowadays, as this article pointed out, the RBNZ also targets a certain employment level, besides the traditional inflation targeting. It does so by being the first central bank in the developed world to copy the Fed’s dual mandate.
Once again, the RBNZ is a pioneer. By copying the model applied by the Fed, it tests the waters to see if the principles applied in America work in New Zealand, too. I guess all central banks have something to learn from the RBNZ and its courage to experiment with new monetary policy measures.