LISTEN TO THIS ARTICLE:
Trending markets offer plenty of opportunities for successful trading. Speculators and investors alike find it easier to ride trends than to bet on market reversals.
The previous section of this trading academy laid out the rules of a trending market. We’ve said that a rising market continuously forms a series of higher highs and higher lows, while a falling market similarly forms lower lows and lower highs. This definition is enough to ride a trend and profit from it.
However, technical analysis has evolved over time. While trend indicators aren’t anything new, it has become more comfortable to use them now that traders have access to computers.
This article aims to present the most relevant trend indicators, their features, and how to use them to profit from the currency market’s moves. Further down the road, we’ll have some articles dedicated to individual trend indicators to further detail their use, building trading setups for different trending conditions.
Besides presenting the most relevant trend indicators, we’ll also use a controversial concept: looking at oscillators to determine the trending conditions. While to many traders, it sounds impossible for an oscillator to show trending conditions, we’ll prove that some of the most successful approaches to riding a trend come from oscillators and not from the standard trend indicators.
We’ll cover the basics of trading with classic trend indicators like moving averages, Bollinger Bands, and the parabolic SAR. In fact, this article covers all the trend indicators offered with the default settings of the MT4 platform.
However, there exist many more. Therefore, be prepared to dive into a world where trend indicators are supposed to show us the future market direction clearly. When they don’t, there’s always the stop-loss order to protect your trading account.
Following the Trend Indicators
Before the personal computer (PC), traders used pen and paper to track the stock market movements. Simple indicators like a simple moving average (SMA) were not difficult to compile.
But once computers arrived, technical analysis expanded with new trend indicators and oscillators. Computers made it easy to compile huge amounts of data and to apply sophisticated math formulas to historical market data.
Most trend indicators have something in common – they appear on the main chart window. That means that the trading platform plots them right on the main chart, above or below the actual price levels. In contrast, oscillators appear in a separate window, usually at the bottom of the main chart.
As the name suggests, trend indicators do just that – follow the trend. But why would traders need trend indicators when trending conditions are easy to spot? Just watch for the market to form lower lows and lower highs or higher highs and higher lows, and you know a bearish or bullish trend, respectively, is in place.
Trend indicators offer a new perspective on trends. They make trends visible and difficult to miss. Trend indicators also offer an educated guess regarding where to add to a new trend.
Swing traders and investors (i.e., traders that have a medium- to long-term horizon for their trades) focus on two things when trading the markets. One is the entry; the other is where to add to a trade.
Buying during a bullish trend makes sense, as does selling during a bearish one. After all, if the market is trending, adding to the initial position means more profits when closing the trades. However, buying may occur on a dip or on new highs (buying strength) or on a spike or a new low (selling weakness). Trend indicators help to identify such entries.
Bollinger Bands
One of the most famous trend indicators, Bollinger Bands are part of any trading platform. Later in this academy, there’s a dedicated article on how to trade with the Bollinger Bands indicator that contains strategies and examples as well as looks at its formula.
At this point in the trading academy, it is important to know that Bollinger Bands are formed of three lines (bands) that follow the price everywhere it goes. They form a kind of channel, and the price remains inside the upper and lower edges over 90% of the time. On rare occasions, it manages to break above or below the upper or lower edges, and traders use this as an opportunity for a breakout.
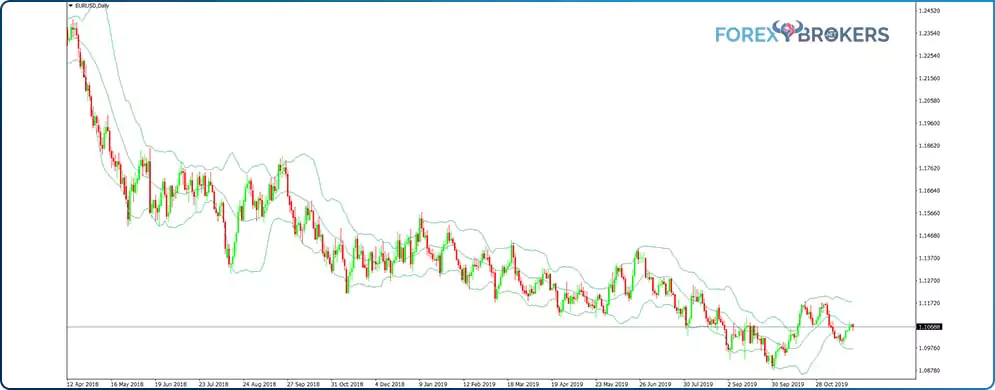
There exist numerous trading strategies involving the Bollinger Bands indicator. Mainly, it is used as a trend indicator – when the price remains between the lower Bollinger Band (LBB) and the middle Bollinger Band (MBB), it represents a strong bearish trend. On the other hand, when it travels between the upper Bollinger Band (UBB) and the MBB, the price action is showing a bullish trend.
Everything about the Bollinger Bands is fascinating, but the most interesting part is that they represent a gauge of upcoming volatility levels. That means that when the distance between the UBB and LBB shrinks more than normal, the volatility is ready to tick to the upside. Such situations occur right before important economic releases like the Non-Farm Payrolls (NFP) in the United States or before announcements from critical central banks, such as changes in the interest rates.
A great indicator for following trends and not only that, the Bollinger Bands reflect the changes in the price action accurately – all the strategies presented in this article are related to them.
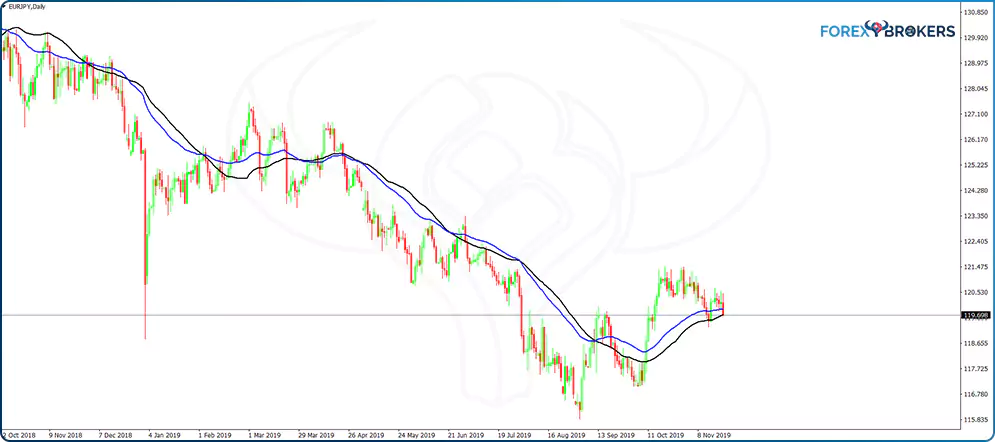
Moving Averages
The moving average considers historical data and plots a value corresponding to the current period. Its most significant advantage is that it makes bullish or bearish trends obvious. For this reason, moving averages are popular among traders.
Moreover, the moving average provides support or resistance during a trend, which is essential because traders use it to add to their initial position. As with support and resistance, the bigger the timeframe, the stronger the support or resistance level is.
The more periods the moving average considers, the most significant the implications for the analysis are. For instance, fast-moving averages consider ten or twenty periods, but slow ones can go up to two hundred periods.
Various trading strategies involve moving averages, such as trading with the perfect order, using the golden and death crosses, and finding dynamic support and resistance levels. We will cover all of these in a future article in this trading academy.
There are also different types of moving averages. The basic one is called Simple Moving Avarage, or the SMA, and it represents the sum of the prices in the given periods divided by the number of periods. MetaTrader4, as well as other trading platforms, offers traders the possibility to use various prices to plot moving averages – opening, closing, the high, the low, or even a combination of all four.
Exponential moving averages (EMA) have a different computation method, and they’re famous for appearing closer to the price, reacting faster to changes in the price’s direction. For this reason, some technical indicators work better with an EMA instead of an SMA (e.g., the MBB in the Bollinger Bands indicator should be an EMA and not an SMA).
Parabolic SAR
A standard indicator included in the default settings of any trading platform, the Parabolic SAR is a series of dots plotted above or below the actual candlesticks. It shows bullish and bearish trends – when the dots appear above the price, they show bearish conditions, and when they are below the price, they indicate bullish conditions.
The Parabolic SAR in Forex is a trend indicator that reveals the true nature of a market – bullish or bearish. Its main problem is that it lags behind the price action.
Just like in fundamental analysis, where some economic indicators lag behind the business cycle (e.g., the unemployment rate), there are also some indicators in technical analysis that lag behind the market – especially trend indicators.
However, traders can overcome this by using an innovative approach when trading. If traders shift their focus from the actual price to the Parabolic SAR dots, the true trend becomes obvious.
The acronym SAR stands for “stop and reverse.” The original idea of the inventor (J. Welles Wilder Jr. – the same person that developed the famous Relative Strength Index oscillator) was to build a stop-and-reverse system by the time the dots changed direction. However, the indicator was built on the stock market, meaning the conditions on different markets, especially volatile markets like the currency one, require different interpretations.
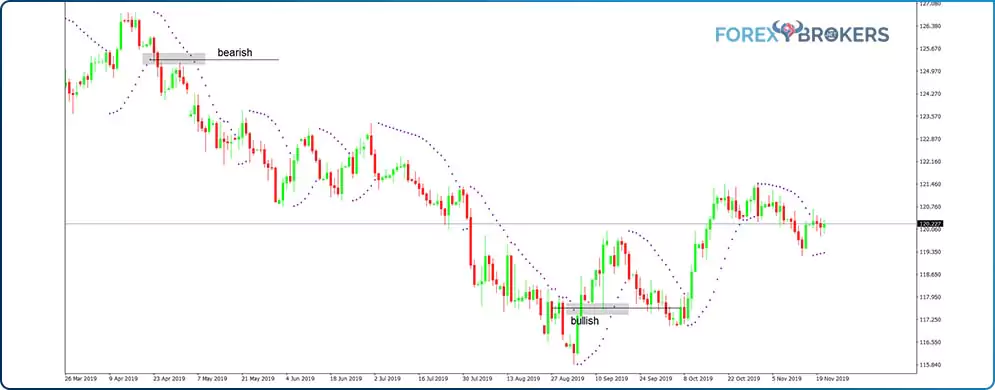
Applied on a chart like the EURJPY above, the Parabolic SAR is represented by a series of dots. The color and size of the dots can be customized using the editing options on the platform.
The cross pair drops from 127 to the 115 area before making a meaningful bounce. However, during the drop, the market bounces several times, and the Parabolic SAR reacts by changing the dots’ position from bearish to bullish.
How to Use the Parabolic SAR Indicator
The critical aspect of trading with the Parabolic SAR indicator is to focus on the dots, not on the price. In other words, use the dots to spot trend reversals and to filter out false ones.
For instance, the EURJPY moved lower from the 127 area. What is the right entry on the short side according to the Parabolic SAR indicator? If the focus is on the dots and not the price, the confirmation of the previous bullish trend’s reversal appears when the bearish dots break the previous series of ascending dots.
The chart above shows precisely the moment it happens. This is what a bearish reversal with the Parabolic SAR looks like!
Moving to the right side of the chart, no bullish dot sequence succeeds in plotting a dot above the lowest dot of the previous dovish series. That means that the bearish trend remains valid and there’s no need to close short trades. In fact, we may even use the new bearish series as a new entry on the short side, basically adding to the short position or selling the spikes in the bearish trend.
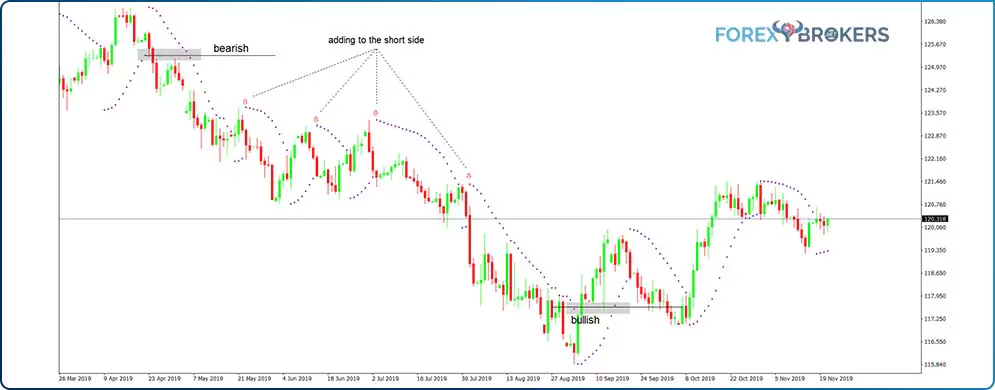
In the above chart, the market offers four distinct possibilities to add to the short position and ride the bearish trend until it ends. To find the end of the trend, look for similar conditions to form in the opposite direction.
More precisely, if the Parabolic SAR indicator plots a dot above the lowest dot in the previous series, that’s a bullish reversal. From that moment, the thing to do is to close all your short positions and start trading on the long side.
This is one of the primary advantages of using technical analysis – you don’t fall in love with any one market direction. Fundamental traders often fall prey to their own beliefs and don’t listen to the market (i.e., ignore reversals). However, technical traders couldn’t care less about where the price goes as long as it moves and there’s a profit to make.
Ichimoku Kinko Hyo
Part of Japanese technical analysis, Ichimoku is famous for revealing the market’s state of equilibrium. Ichimoku is a complex indicator wherein different elements come together to help traders understand the market.
It is such an interesting indicator (perhaps the most famous one from Japan) that it has a special article dedicated to it in the next section of this academy. Its elements reveal not only current, past, and future support and resistance levels but also the strength of a trend.
Known by many traders also as the Ichimoku cloud, the indicator projects a “cloud,” or “kumo” in Japanese, on the right side of the chart. More precisely, 26 periods ahead of the current candlestick, the Ichimoku projects an area that provides support and resistance for future prices.
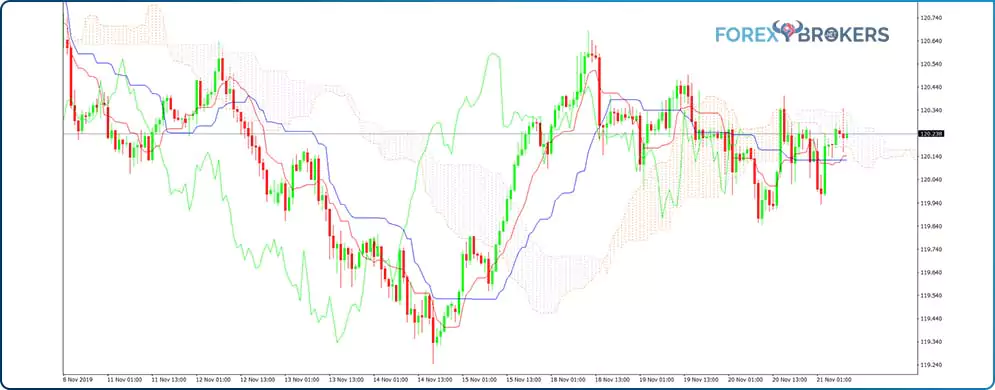
The blue and red lines on the above chart represent the trending elements of the Ichimoku indicator. When the red line (Tenkan) moves above the blue line (Kinjun), that’s a bullish cross, pointing to an upward change in market direction. On the other hand, when Tenkan moves below Kinjun, that’s a bearish cross, signaling a new trend to the downside. These two elements (Tenkan and Kinjun) are NOT moving averages. They have a different formula but do act in a similar way to moving averages.
The shadow on the chart is the cloud, comprised of different colors to signal bullish or bearish conditions. Interpreting the cloud together with the actual price is a difficult and confusing task for traders who don’t understand how Ichimoku works.
For instance, the cloud’s projection on the right side of the actual price is clearly visible on the current candlestick, but what if the trader were trying to determine where the cloud was on a price level in the past? The trick is to find the candlestick of interest and simply measure 26 periods to the right side to find out what the shape of the cloud was and how the market reacted when it reached it.
Average Directional Moving Index
The Average Directional Moving Index (ADMI) is a trend indicator in Forex like no other. It appears in a small, separate window at the bottom of the main chart. For this reason, it is very easy to confuse it with an oscillator.
The ADMI has multiple elements that point to trending or ranging conditions. When using it, traders must consider all the elements together, not separately.
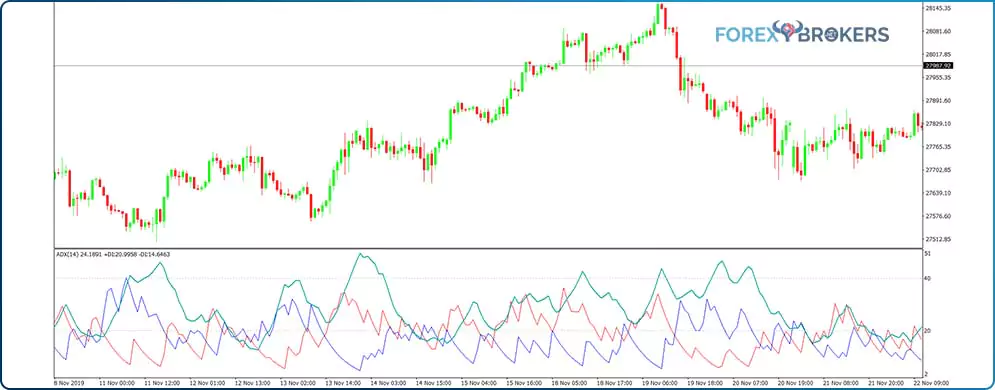
Above is the Dow Jones Industrial (DJIA) hourly chart with the ADX on a small window below. Currency traders monitor closely the stock market in the United States due to its implications on all financial markets and because it correlates with some currency pairs (e.g., USDJPY has a direct correlation with the US stock market).
Also called ADX, this indicator has three lines that move only in positive territory, between 0 and 100. The ADX line (green) derives its values from two directional movement indicators (DMI) presented in blue and red. Some trading platforms use +DMI and -DMI, but MetaTrader4 uses only +DI and -DI when referring to the two lines.
The standard interpretation of the ADX is that the higher its values are, the stronger the trend is. Values above 20 show incipient trending conditions. Above 50, and the market is forming a very strong trend. Above 75, and the move represents extremely strong trending conditions.
Even during strong trends, the market takes its time to consolidate. Either because a less liquid trading session (e.g., the Asian session) has started or simply because the market is waiting for an important economic release, consolidation zones often appear on a chart. During these times, the ADX falls below the 20 level, signaling a ranging market for a while.
How do we know a trend has ended and the recent consolidation is not a continuation pattern? The answer comes from the number of periods for which the ADX remains below 20. If it remains below 20 for a long time, the trending conditions have disappeared.
How to Use the Average Directional Moving Index
The ADX works best in intraday trading. If we check the earlier DJIA hourly chart, there were three distinct trades when the market trended higher. The sign in front of the two DI lines reflects the direction of the potential trend – bullish or bearish.
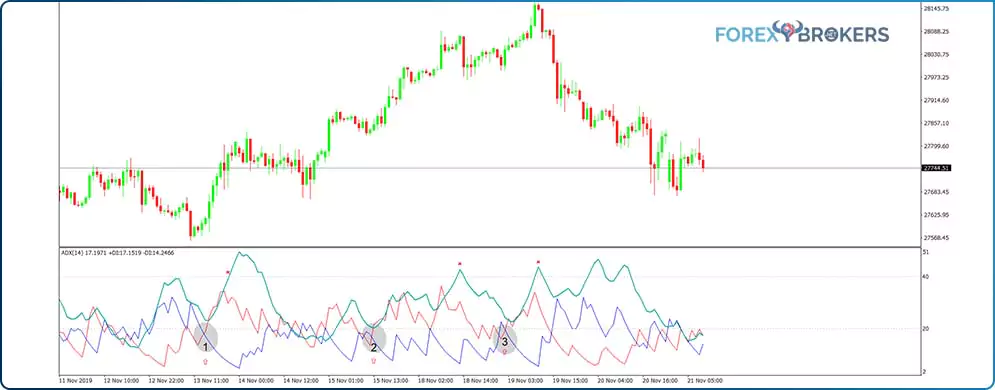
The key when looking for bullish trends is to wait for the +DI line to cross above the -DI one. That shows that a bullish directional movement is to come. Next, focus on the ADX line. It should be on a rising path and ideally close to the 20 level, where trends typically start.
The first example shows the ADX close to the 20 level and the +DI crossing above the -DI. That’s a bullish signal. When the ADX begins to rise, that’s the entry to go long. It coincides with the market putting in a bottom and galloping up from that moment on. The 40 level is often used to exit because of how often consolidations form on financial markets.
We see the price then corrects when the spot market closes and only futures are open. In the meantime, the ADX drops below the 20 level. However, it can’t remain below the 20 for a long time, suggesting the bullish trend has more upside potential. The +DI crosses above -DI again, but the ADX is below 20, so that signal doesn’t respect the rules.
The second and the third trades do respect all the rules of a long trade with the ADX indicator – the bullish cross of the +DI and -DI lines while the ADX line remains above but close to the 20 level. For a bearish trend, look for the opposite to happen – the +DI line moving below -DI with the ADX remaining above but close to 20.
Alligator
The Alligator indicator in Forex is one of the many indicators developed by Bill Williams that uses three different moving averages to spot trend market conditions. Bill Williams indicators have a dedicated tab on the MetaTrader4 platform, symbolizing their importance in technical analysis.
The first thing to consider when looking at the Alligator indicator is that the three moving averages are shifted to the right of the current price by various periods. This little particularity is important when running historical back-tests on how a trading strategy with the Alligator indicator has worked in the past.
As for the three moving averages, the default settings use the smoothed moving average and a combination of the highs and lows of each period. However, traders may change the settings to better follow the price – the chart above shows Alligator moving averages using the closing price and the SMA.
The periods used by Bill Williams are for fast moving averages. The slowest moving average (the blue line) is the SMA-13, the red line is the SMA-8, and the fastest one (the black line) is the SMA-5. Bill Williams used a funny name for this indicator, and the moving averages are a part of it: The fastest-moving average is called Lips, the average one Teeth, and the slow one Jaws.
The names illustrate what happens with the trending conditions. If the price is strong enough to go through the slowest moving average (Jaws), trending conditions no longer exist.
How to Use the Alligator Indicator
The Alligator indicator uses a combination of various moving averages to show trending markets. When the three moving averages align in order, the market is in a trend.
The problem here is the same as with all trend indicators – the Alligator lags behind the actual price action. However, due to its shifting characteristic, the Alligator reduces this handicap considerably.
The first example on the chart above shows a bearish trade. By the time the red line moves below the blue one, the three moving averages show trending conditions.
But that’s not the actual entry for the short trade. Remember that the red line is shifted to the right when compared with the actual price – in this case, by five periods. Therefore, to determine the entry place, we should count five candlesticks from the vertical line to the left side of the chart.
The idea is to remain in a trade for as long as the moving averages remain aligned. For the exit, the fastest moving average offers the solution: If it crosses the red line more than two times, that’s a signal that the trend is not that strong anymore and that getting out is a wise move.
The second example perfectly illustrates this phenomenon. The vertical line shows when the red moving average establishes the trending order. As mentioned above, the entry point is five periods earlier, and the faster moving average crosses below the median one twice. When the second cross appears, that’s a signal that the trend isn’t that strong anymore and traders should think of closing their long position or moving their stop-loss to the break-even point and booking partial profits.
Oscillators
Some traders use oscillators to follow the price action. Some oscillators reveal trending conditions when they move from overbought to oversold territory, for instance.
The main use of an oscillator is to spot false moves that the market may form. For instance, divergences with oscillators are great reversal patterns. However, what happens after the price reverses? The oscillator travels in small trends until it reaches the other extreme. Depending on the time frame the trader uses, these trends have the potential to yield nice returns.
Most oscillators reveal trading conditions, too. We list two of them below just to show how to use them in a different way. But others, such as the Relative Strength Index (RSI), also show trends. The RSI moves only in positive territory, between 0 and 100, spending most of its time between 30 and 70. One way to make the most of small trends is to trade when the RSI crosses the 50 level. In bullish trends, traders buy the 50 cross and stick to the trade until the RSI reaches the overbought territory (above 70). Similarly, in bearish trends, when the RSI moves below the 50 mark, trend traders get on board for a move the oversold territory (below 30).
Oscillator of Moving Averages
The Oscillator of Moving Averages (OsMA) is an oscillator that plots a histogram under the main chart. The histogram shows bullish or bearish conditions for three moving averages – the EMA-26, EMA-12, and SMA-9.
When the OsMA histogram shows positive values, that means the three moving averages are aligned one on top of the other, from slowest to fastest. As long as the conditions hold, the histogram remains positive.
For trend trading, the key here is to spot the decline in the bars in the histogram and trade the move from positive to negative or from negative to positive. This way, traders benefit from the price transition from the overbought to oversold levels and from correctly interpreting the market consolidations.
How to Trade with the OsMA
Typically, oscillators prove their worth when used to trade divergences. When they are used to ride trends, the approach differs.
In the case of the OsMA, here are two examples from the EURUSD hourly chart. They illustrate perfectly how to use the OsMa as a trend indicator.
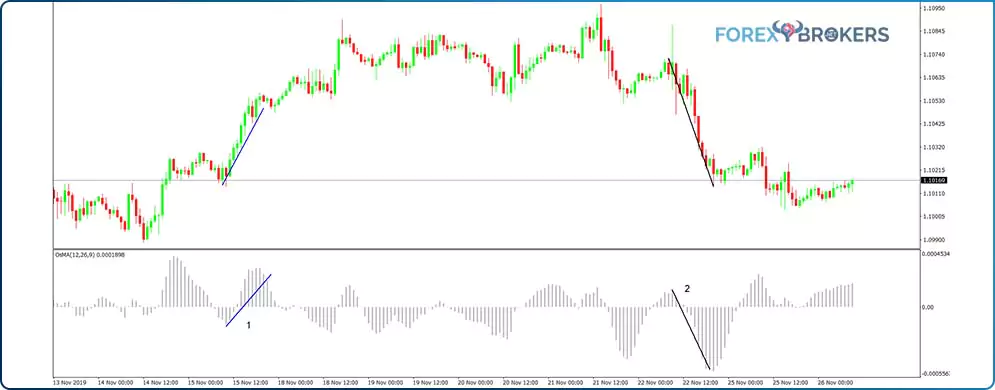
The first example shows the market consolidating for a while without retracing much of the previous segment. This suggests the price just made a correction, and the prediction is for it to continue to the upside.
But it won’t start the move until the OsMA histogram plots rising bars. When that happens, wait for the bars to turn positive before going long, and when the bars begin declining again, simply close the trade.
The second example on the right side of the chart shows a bearish setup. The market consolidates without a meaningful pullback, and the signal appears when the bars begin declining again. At the moment the bars become negative, go short with the exit when the OsMA bars stop the decline.
The easiest way to understand how the OsMA plots the histogram is to add the three moving averages to the main chart. This way, the positive and negative histogram levels are obvious, and the info helps traders better visualize the entries.
Moving Average Convergence Divergence
The Moving Average Convergence Divergence (MACD) is a similar indicator to the OsMA, plotting a histogram in a similar fashion. On top of that, the MACD shows a signal line that reflects the bullish or bearish potential.
One way to use the MACD is to interpret the heights of the bars in the histogram and compare them with the price action. If the price forms two consecutive higher highs but the histogram doesn’t show it, that’s a divergence.
Also, if the signal line (red line) is rising and the MACD bars are rising too, that’s a bullish trend. If the bars do not touch the signal line, that reinforces the bullish trend.
The MACD and OsMA are similar oscillators in the sense that the OsMA’s values are derived from the MACD. Therefore, consider using one of the two indicators but not both on the same chart.
Trend Trading with the MACD
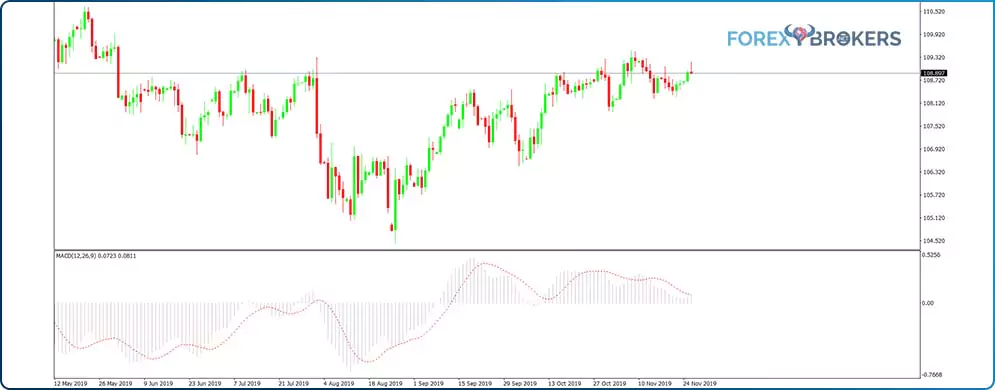
The USDJPY daily time frame below shows three instances where the MACD works as a trend indicator. From left to right, the first case shows a strong bearish trend forming after the MACD bars drop below the zero level. Traders wishing to ride such a trend should remain on the short side until the bars become small enough to close above the signal line.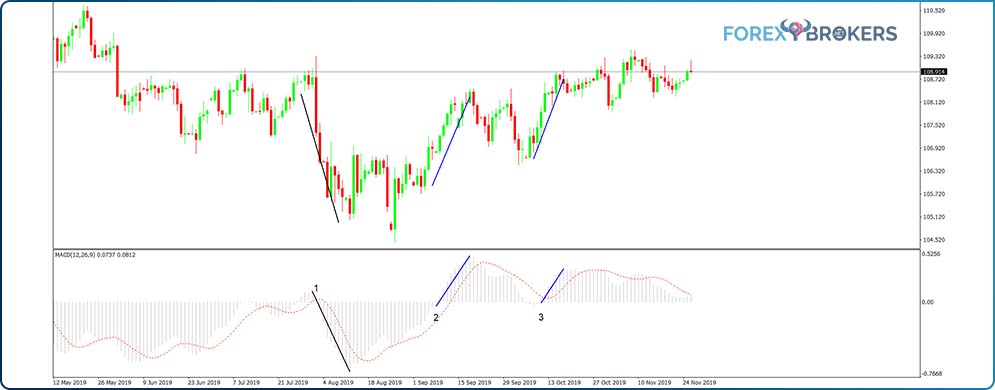
When that happens, sit tight until the MACD crosses the zero line again – only this time from negative into positive territory. At that point, go long and remain on the long side until the bars close below the signal line.
Sometimes the entries generated fail to yield a profit. If you check the third example, the bars turn negative, triggering a short trade. However, they switch quickly into positive territory – traders should also switch direction to avoid being caught on the wrong side of the market.
In a future article in this academy, we’ll have a closer look at different oscillators and how to use divergences with the most important ones. In this article, the idea was just to show how oscillators can yield results when used as trend indicators.
Conclusion
Trend indicators lag behind the price action. But even so, they prove their value, especially when the market travels for a long time.
A bullish trend is a series of higher highs and higher lows, and Forex trend indicators follow such series and provide viable information on where to enter the market. A bearish trend forms lower lows and lower highs, and trend indicators provide entries on market spikes during such trends.
Nowadays, the price action on the currency market (as well as other markets) is determined by algorithmic trading. Robots buy and sell automatically at certain levels based on their programmed strategy. That means that trends are no longer what they were when most of the trend indicators presented in this article were developed. For this reason, the job of a trader is to make the most of them when using them, always looking for alternative strategies.
There is a saying in trading that all trend indicators show the same thing and that all you need is one indicator to follow, and that’s it.
It makes sense to pick a trend indicator from the ones presented here and use it on all charts. Sticking to one indicator for a longer period will help you master the strategy and learn more about its advantages and disadvantages.
To sum up, keep it simple, and don’t use more than one trend indicator on the same chart. That complicates the analysis and generates conflicting signals.
All indicators just offer an educated guess regarding where the price might move next. If traders don’t use a proper money management system with strict risk control and appropriate reward levels, no indicator can save them.