LISTEN TO THIS ARTICLE:
Part of the logical process behind the Elliott Waves Theory is deciding if a market move is impulsive or corrective. If you conclude that it is corrective, the next thing to look at is whether it is a simple or complex correction.
The answer always lies within the next market segment: The price action that follows a market move tells traders if the corrective wave was simple or complex.
A previous article introduced simple corrective waves and their types – flats, zigzags, and triangles. It is now time to study each pattern and see how to interpret the different types of flats, zigzags, and triangles.
A study found that the currency market spends most of its time in consolidation. That means corrective waves form more often, but it doesn’t mean impulsive activity is not present.
A flat pattern has one impulsive wave, a zigzag has two impulsive waves, and a triangle has impulsive activity on the waves of a lower degree.
In other words, corrective and impulsive waves are present in all market moves. However, if you look at the types of corrective and impulsive activity, the corrective sections dominate the Elliott Waves Theory.
This article presents simple corrective waves and the conditions for a wave to be considered one. In other words, we look at what the price action must do after a corrective wave so that traders can interpret it as a simple correction.
Despite identifying only three types of simple corrective waves, Elliott found various types of each pattern. For instance, there are ten types of flat patterns and three types of zigzags. As for triangles, they are the most common corrective waves to form.
The next article in this academy presents complex corrections, but to understand them, traders need to master the simple ones first.
Trading Flats
Of the types of waves in the Elliot Waves Theory, flat patterns have the most different types. That doesn’t mean they’re the most common pattern, though (triangles form more often than flats).
As a simple correction, a flat may form as the second or fourth wave of an impulsive move. However, if there’s a case where an impulsive wave develops a flat pattern on both the second and fourth waves, chances are that the structure is corrective, not impulsive.
Remember the principle of alternation? It calls for a variation between the two corrective waves of an impulsive move, and they should differ.
Another place where a flat pattern may appear is the a-wave or b-wave of a flat of a bigger degree. The x-wave in any complex correction or any leg of a contracting or expanding triangle may also be a flat pattern.
As you can see, flats are everywhere, and for this reason, it comes as no surprise that so many types of flat patterns exist. Before studying the various types, let’s have a quick look at what makes a flat pattern.
What Makes a Flat Pattern?
A flat is a three-wave pattern. A corrective wave labeled a-b-c, it has two corrective waves of a lower degree (waves a and b) and one impulsive structure (wave c).
The a-wave in a flat pattern is either a simple or complex correction. If it is a simple correction, wave a can’t be a triangle.
As a rule of thumb, no correction, simple or complex, begins with a triangle, except for a triangle itself.
The b-wave in a flat pattern may also be simple or complex. Once again, if simple, it can’t be a triangle on its own.
Any type of impulsive wave may form as the c-wave of a flat. However, the most common one is the third-wave extension impulsive move.
The rules of a flat tell us that the most important thing to consider is the retracement of the b-wave. It must end (attention: always interpret the end of the b-wave, not its highest or lowest point) beyond the 61.8% retracement point compared to the previous a-wave. If not, the entire structure is not a flat.
Multiple types of flats exist, depending on the strength of the retracement. We can say that the b-wave is critical in determining the category of the flat pattern, while the c-wave is responsible for its final name, structure, and interpretation.
Types of Flat Patterns
When looking at a potential flat pattern, traders should always consider three retracement intervals. For this, editing the Fibonacci Retracement tool is mandatory because some of these levels do not appear in the default settings.
Here are the three intervals:
- 61.8%–80%
- 81%–100%
- >100%
While 61.8% is the golden ratio, the famous Fibonacci level, the other two levels have no connection with the Fibonacci sequence. However, as you’ll find out later in this article, flats that have a b-wave exceeding the 100% retracement level still depend on other Fibonacci numbers.
The three intervals define the strength of the b-wave. More precisely, the ability or inability of the b-wave to retrace beyond certain levels says a lot about the strength or weakness of the market.
Moreover, in some cases, the flat pattern acts as a sign of countertrend strength. For instance, such flats often appear as the second wave of an impulsive move, when the b-wave and sometimes even the c-wave fails to retrace the previous wave completely.
Flat Patterns with a Weak B-Wave
Flats in this category have a b-wave that ends between the 61.8% and 80% retracement levels of the previous a-wave. The b-wave’s inability to retrace beyond 80% is the reason why these flat patterns are called “flats with a weak b-wave.”
In this category, there are three types of flat patterns:
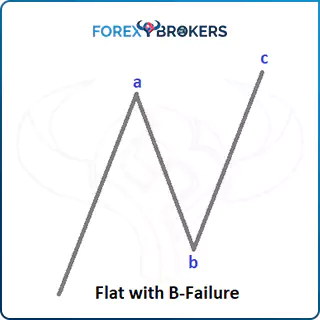
- flats with a b-failure
- the c-wave retraces between 100% and 123.6% of the b-wave
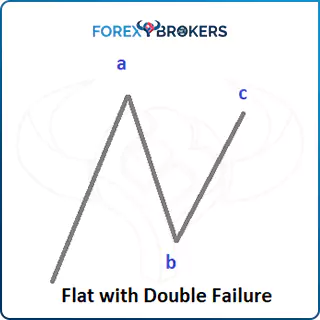
- flat with a double failure
- the c-wave retraces less than 100% of the b-wave
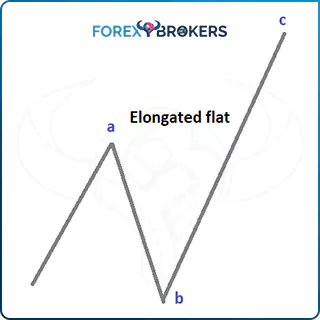
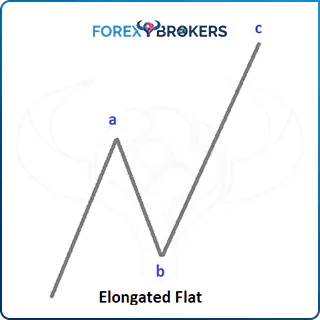
- elongated flat
- the c-wave exceeds 123.6% and often 161.8% of the b-wave
We won’t go into detail regarding all the types of flats here, as that will be the subject of a different article. However, keep in mind that if the b-wave gives way to a flat pattern, the length of the c-wave is responsible for its type.
Flats with failures are more powerful than elongated flats. That means that the price action that follows is more eloquent and the market is more active, moving much faster.
Because the c-wave is an impulsive structure, the market forms a wave that is ultimately retraced by the next market segment. Therefore, trading flat patterns is difficult, as the price action in the impulsive wave often tricks traders.
A good question here is what happens if the c-wave ends between 123.6% and 138.2%. What type of flat would that be? The answer is an elongated flat, but a special one. The thing with elongated flats is that if the c-wave can retrace more than 138.2% of the b-wave, the next market segment is unlikely to reverse the c-wave entirely. However, if it retraces only up to 138.2%, most likely, the next segment will reverse the entire c-wave and confirm the flat as a simple correction.
Flat Patterns with a Normal B-Wave
A normal b-wave ends between 80% and 100% of the previous a-wave. To make the 80% level visible, edit the Fibonacci Retracement tool accordingly to add it. On the MetaTrader4 platform, that’s an easy thing to do.
First, select the tool and drag it onto the chart from the start to the end of the a-wave. Second, right-click on it and select Fibo Properties. Finally, look for the Fibo levels tab and simply add the 80% retracement.
A flat with a b-wave that retraces between 80% and 100% is considered normal. There are three types of flat patterns in this category:
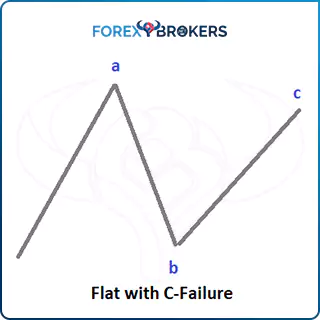
- flat with a c-failure
- the c-wave fails to retrace the previous b-wave fully
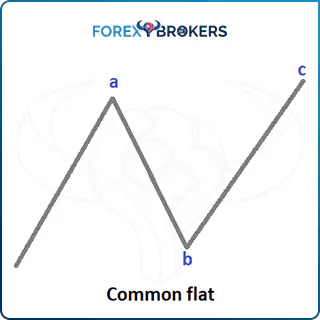
- common flat
- the c-wave ends between 100% and 123.6% of the previous b-wave
- elongated flat
- the c-wave exceeds the previous b-wave by 123.6% and often travels as much as 161.8% or more
Once again, the flat with the failure in this category is the most powerful one. As a matter of fact, any time you see a flat with a failure, regardless of the category it belongs to, it is a dominant pattern signaling countertrend strength.
Flat Patterns with a Strong B-Wave
A strong b-wave exceeds the previous a-wave by 100%. Depending on where the c-wave ends, we have yet another three types of flats:
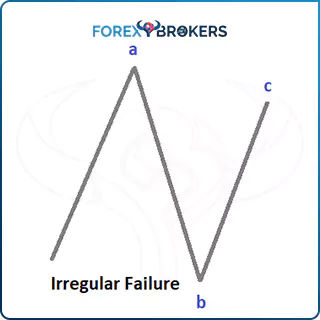
- irregular failure
- the c-wave fails to retrace the previous b-wave completely
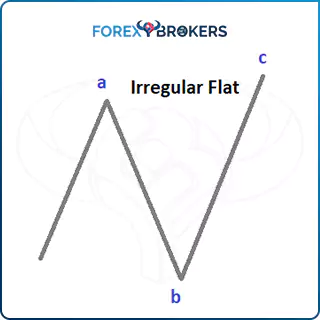
- irregular flat
- the c-wave fully retraces the previous b-wave and ends between the 100% and 123.6% levels
- elongated flat
- the c-wave fully retraces the previous b-wave, exceeding 123.6% and often even 161.8% or more
One more time, the failure pattern here is powerful, signaling countertrend strength. But the trickiest pattern of the three listed in this category is the irregular flat.
For such a pattern the form, the market must first fully reverse the previous a-wave. Next, the c-wave forms an impulsive structure that fully reverses the b-wave.
It is a tricky pattern because traders have the tendency to place the stop-loss level for a trade at the top or bottom of the previous market swing. With full reversals on two consecutive waves, the irregular flat triggers stops on both the long and short side before moving yet again in the opposite direction.
The Running Flat
So far, we’ve listed nine types of flat patterns, three in each category. But there’s one more: Please consider this an introduction to the fascinated field of running corrections.
The running concept of the Elliott Waves Theory tells us that a corrective pattern does not necessarily need to end in the previous wave’s territory. In fact, in a bullish trend, a corrective wave may end above where the last wave ended. For instance, consider a bullish five-wave structure. The second wave, if it is a running correction, may end above the end of the first wave.
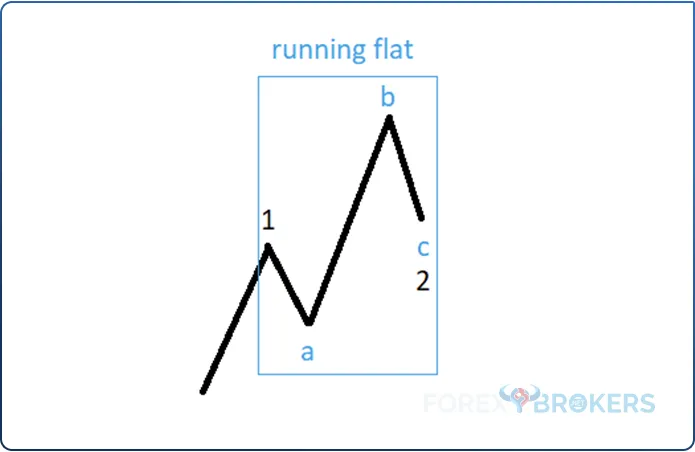
Whenever a running correction forms, it is the market’s way of telling you the move that will follow will exceed all expectations in terms of time and distance traveled. More precisely, it’ll travel the most in as little time as possible.
The Elliott Waves Theory contains many types of running corrections, and we’ll study them all in this academy. The first one is covered in this article and is called a running flat.
The conditions for the running flat are the same as the others: Wave a and wave b are corrective, and wave c is impulsive. However, expect a very strong b-wave, often exceeding much more than 161.8% of the previous a-wave.
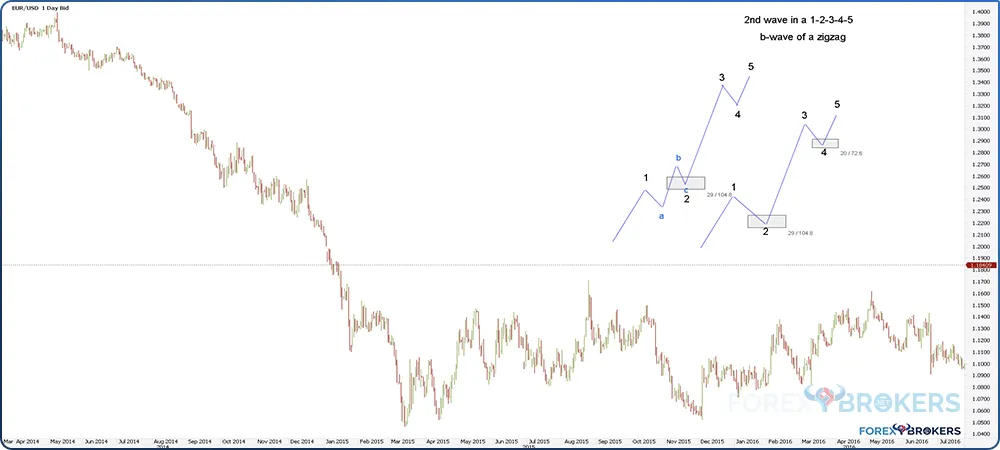
A running flat appears mostly as the second wave of an impulsive move, just before the extended third wave. Rarely does a running correction form as the fourth wave of an impulsive move, but it may appear as the b-wave of a zigzag.
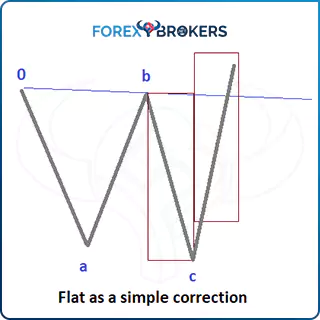
When is a Flat Pattern a Simple Correction?
Elliott traders must always stay alert and consider the next logical pattern the market will form. A simple correction is followed by precise market price action. Some conditions must exist for traders to say that the market has created a flat as a simple correction and label it accordingly.
For this, we must consider two things. The first is the so-called 0-b trendline. This is a trendline that connects the start of the flat pattern (the beginning of the wave a) and the end of the b-wave. Just draw a line connecting the two points and project it on the right side of the chart.
Second, the element of time makes a difference. Measure the time it took for the c-wave to form and project it to the right of the end of the wave.
For a flat to be a simple correction, the price action that follows (in the opposite direction) must pierce the 0-b trendline in less time than it took for the c-wave to form. However, that alone is not enough: It must also fully retrace the entire c-wave in less time than it took the c-wave.
In other words, this is tricky as tricky can be. Imagine the c-wave of a flat, which is already an impulsive move. In this case, the market travels is traveling enough to scare any trader with the intention of taking the other side of the market.
But when a flat is a simple correction, the price action that follows the c-wave is even stronger. Able to fully retrace the c-wave in less time than the c-wave took, it establishes the flat as a simple correction.
In this way, Elliott traders manage to make the distinction between simple and complex corrections. If the price action that follows a flat pattern doesn’t respect these two rules, the flat is part of a complex correction.
Trading Zigzags
Still a three-wave structure, zigzags differentiate themselves from flats by having not one but two impulsive waves. The corrective wave resembles impulsive activity, with many traders getting it wrong due to the very similar market conditions.
Zigzags don’t form as often as flats, and for this reason, there aren’t as many types of zigzags as there are flat patterns. Only three types of zigzag patterns exist, but they are all very important.
Remember that corrective waves form more often than impulsive ones. A flat, for instance, has two corrective waves, the a-wave and the b-wave, and both may have at least one zigzag in their structure.
What Makes a Zigzag?
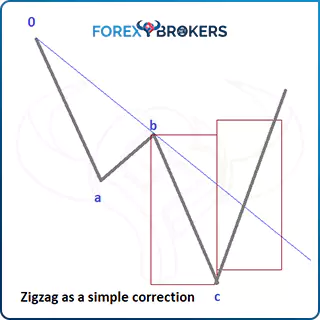
Labeled a-b-c in reference to the corrective structure, a zigzag only has the b-wave as a correction of a lower degree. The minimum distance for the b-wave to retrace is 1% into the a-wave’s territory.
The b-wave can’t retrace over 61.8% of the a-wave. If that happens, the market structure is not a zigzag and most likely a flat or a leg of a triangle (either contracting or expanding) instead.
As a tip for when you trade zigzags, never consider viable zigzags where the b-wave retraces much more than 38.2% into the a-wave’s territory. Even 38.2% is a big retracement but is nevertheless seen in the currency market.
Because the a-wave and the c-wave are both impulsive, the b-wave takes very little time to consolidate and retrace. Often, it is barely strong enough to reach the 23.6% level, and even that is sometimes is far from the actual retracement levels common when trading on the currency market.
For the impulsive waves of a zigzag, there are no limitations in terms of the type of impulsive wave that might appear, with one condition – the a-wave can’t be a fifth-wave extension impulsive move. Therefore, we can see either a first-wave or third-wave extension for the a-wave. The c-wave in a zigzag has no restrictions in terms of what type of impulsive wave the market can form.
Types of Zigzags
The c-wave determines the type of zigzag. Its length defines the zigzag and offers plenty of valuable information to traders looking to forecast the next market swing.
Essential to consider here is that the length of the c-wave compared to the length of the a-wave determines the type of zigzag. Yet again, the 61.8% ratio plays a critical role.
When the c-wave is shorter than 61.8% of the a-wave, the market is forming a truncated zigzag – a pattern to trade because truncated zigzags are always heavily retraced by the next market move. Almost always, the next market move fully retraces a truncated zigzag, and the minimum retracement level is 80%. Therefore, when you find what looks like a truncated zigzag but the next market swing doesn’t meet the minimum retracement, the pattern is not a truncated zigzag.
If the length of the c-wave falls anywhere between 61.8% and 161.8% of the length of the a-wave, the market is forming a normal zigzag. We may say without a doubt that this type of zigzag forms the most often. Over 80% of the zigzags that ever appear are normal ones.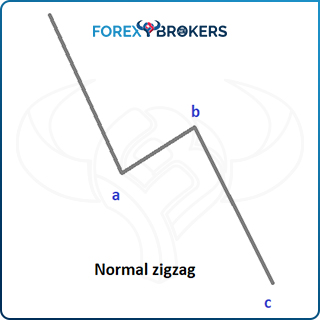
The last type of zigzag is an elongated one. Just like in the case of flat patterns, an elongated zigzag has an extremely long c-wave, exceeding the previous a-wave by more than 161.8%. A tip regarding elongated patterns is that, especially in the case of zigzags, they very often appear as an entire leg of a contracting triangle or at least part of a leg.
When is a Zigzag a Simple Correction?
Everything described above makes a pattern a zigzag, but that alone is not enough to call a pattern a zigzag. One other condition plays a decisive role – the element of time.
As a rule of thumb, in any zigzag, the two impulsive waves (a and b) must take a similar amount of time to form. Now, in the currency market, this is a bit difficult, so don’t be picky and consider to be zigzags only movements with the exact same number of candlesticks for both waves. Instead, look for waves a and c to simply resemble each other in terms of the time it took to form.
When is a zigzag a simple correction? The same confirmation rules as in the case of flats also apply here. That means the first thing to do is to draw a trendline connecting the start of the zigzag with the end of the b-wave. Called the 0-b line, it is essential in determining if the zigzag will end up as a simple or a complex correction. The next thing to do is to project the time the c-wave took to form from its end to the right.
For a zigzag to be a simple correction, the price action that follows should pierce the 0-b trendline in less time than it took the c-wave to form. Moreover, it must fully retrace the entire c-wave before the time expires.
Anything less than that isn’t enough for the zigzag to be a simple correction. Instead, the market is forming a complex correction.
Trading Triangles
The favorite way for the market to consolidate, triangles are literally everywhere on charts. The Elliott Waves Theory puts a lot of emphasis on triangular patterns, with plenty of rules and various types of triangles.
As corrective patterns, triangles have five segments. A triangle is the only simple correction that has five segments. Nonetheless, traders still refer to triangles as three-wave structures, only to point out that all five segments or legs of a triangle are corrective.
This is another distinction that triangles have from flats and zigzags. No segment of a triangular pattern is impulsive, whereas a flat has one impulsive wave and a zigzag two impulsive waves. Like any corrective pattern, triangles are labeled with letters: a-b-c-d-e.
What Makes a Triangle?
The easiest way to spot a triangle is to draw its two trendlines. Ultimately, the two trendlines define the triangular shape.
The way to do so is to connect the ends of the a- and c-waves with a trendline and project it to the right. Next, do the same with the ends of the b- and d-waves. The a-c and b-d trendlines then define the triangle’s shape.
During a triangle’s formation, the market forms a series of lower highs and higher lows. The series takes various shapes and forms depending on the type of triangle.
Elliott established several strict rules for triangular patterns. This way, traders avoid confusing them with other patterns.
For instance, the b-d trendline should not be pierced by any part of the c-wave. If that happens, the triangle either is incomplete and has a different shape or the pattern is simply not a triangle.
Alternatively, the price usually (depending on the type of triangle) pierces the a-c trendline during the formation of the e-wave. Another variation is parts of the d-wave piercing the b-d trendline. The list goes on.
Look for elongated patterns to appear as entire legs or part of a leg. More precisely, look for elongated flats or elongated zigzags, with the former appearing more often.
Across the Elliott Waves Theory, triangles appear mostly at the end of complex corrections. For instance, a double combination ends with a triangle most of the time, and a triple combination always ends with a triangular pattern.
However, due to its five segments and the volatility of the currency market, triangles can take very different shapes and be easily mistaken for other patterns.
Types of Triangles
There are different categories and subcategories of triangles, mainly distinguished by the angle of the two trendlines.
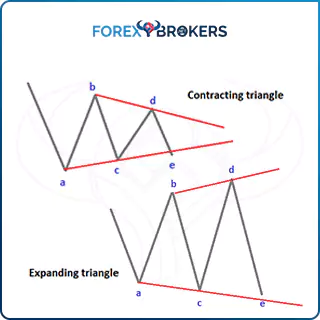
If the a-c and b-d trendlines meet somewhere in the future (to the right of the pattern), the market has formed a contracting triangle. By converging to a future common point, the two trendlines create the contraction aspect of the triangle. The name of this converging point is the apex, and it is critical in interpreting the price action that follows particular triangles (i.e., limiting triangles).
If the two trendlines diverge, the triangle is expanding. However, regardless of whether it is expanding or contracting, the rule regarding the legs of the triangle holds true – all of them are corrective.
Another distinction Elliott made is between limiting and non-limiting triangles. The former are triangles that limit the price action, meaning that after formation, the price has a hard time advancing or declining. A non-limiting triangle, on the other hand, has no limitations regarding the price action following the consolidation. Between the two types, the non-limiting triangles are by far the more common ones.
Finally, the market may also form a special type of triangle. These are patterns that classic technical analysis interprets differently, but Elliott labeled them as triangles. For instance, the head and shoulders pattern is a triangle in the Elliott Waves Theory, provided the price that breaks the trendline respects the rules set by the theory.
Contracting and Expanding Triangles
Triangles that contract form more often than expanding triangles. Even the currency market, with its wild fluctuations and complex structures, doesn’t form many expanding triangles.
Contracting and expanding triangles contain the same subtypes, just with the trendlines pointing in a different direction. Therefore, we discuss only the types of contracting triangles, but everything also applies to expanding ones.
A horizontal contracting triangle is known as a symmetrical triangle in classic technical analysis. The a-wave is the longest one, and each segment that follows is smaller than the previous one.
An irregular contracting triangle resembles a horizontal triangle, with one exception: Each wave is bigger than the next. This is the irregularity that gives the triangle its name.
Finally, the running variation of a contracting triangle is a complex pattern that ends above (in a bullish trend) or a below (in a bearish trend) the start.
All these types (horizontal, irregular, and running) also appear in expanding triangles. The only difference is that the market doesn’t form expanding triangles that often.
Limiting and Non-Limiting Triangles
Limiting triangles appear in only two situations – either as the fourth wave of an impulsive move or the b-wave of a zigzag. That’s it.
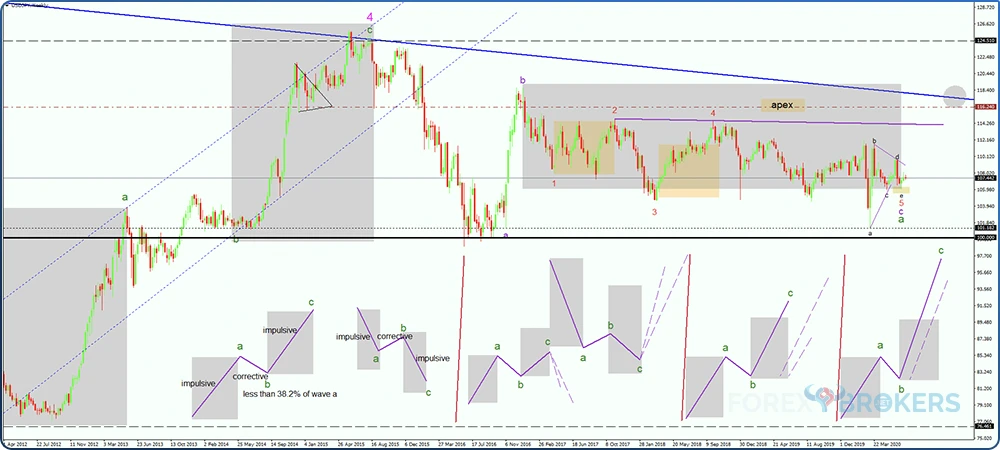
This tells you how rare the pattern is, but that doesn’t mean they never form. Recently, the currency market formed a few limiting triangles on bigger timeframes, like the one below on the EURUSD daily chart. It took the price over two years to form the limiting triangle, but what followed clearly shows its “limiting” nature and how it controls the future price action.
Non-limiting triangles form more often. Either as the x-wave or final wave in a complex correction, limiting triangles are everywhere. We will address both limiting and non-limiting triangles in more detail later in this academy.
Special Types of Triangles
Special triangles are variations of the triangles listed earlier. For instance, one special type of triangle is the so-called “triangle in the a-e base,” where the triangular shape is no longer defined by the a-c trendline but rather the a-e trendline that replaces it in the overall pattern.
When is a Triangle a Simple Correction?
For a triangle to be a simple correction, the element of time once again plays an important role. The Elliott rule states that the price must break the b-d trendline in less or the same amount of time it took the e-wave to form.
All traders must do is first correctly identify the e-wave. Next, they must measure the time it took to form and project that to the right from the end of the e-wave. Finally, traders need to check if the price breaks the b-d trendline, respecting the rule in the previous paragraph.
If it does, the triangle is a simple correction. It can be the fourth wave in an impulsive move (i.e., a third-wave extension impulsive structure), the b-wave in a zigzag, or the x-wave in a complex correction. In the last case, it is a non-limiting triangle, and in the other two instances, it is a limiting one.
But this rule doesn’t apply only to interpreting whether a triangle is a simple correction or not. It applies to all triangles, creating confusion among Elliott traders.
Know this – right after the end of a triangle, the price must break the b-d trendline in less or the same amount of time it took to form. That’s enough to correctly identify them all, whether they’re simple corrections or part of a complex correction. Because a triangle as a simple correction appears only in the instances listed above, it rarely forms a simple correction, especially in today’s currency market.
Conclusion
The Elliott Waves Theory uses precise rules to define impulsive and corrective waves. By checking whether a market segment respects the rules of an impulsive or corrective structure, traders start a logical process with multiple steps. Each step goes into more detail until a clear path for future price action becomes evident.
Simple corrections with the Elliott Waves Theory represent the basis for understanding corrective waves. This article only touched on them briefly, but later in the academy, it’ll become evident that labeling complex corrections without mastering the simple ones is not possible.
All three types of simple corrections (flats, zigzags, triangles) have a clearly defined role in the theory. There’s no one more important than the others. They form the base for complex corrections, as the next step in the logical process.
If the price action that follows a simple correction does not confirm it as simple, the implications are that the market is forming a complex correction. From that point on, the trader should focus on identifying what type of complex correction the market is forming and how to interpret it in the overall puzzle.