LISTEN TO THIS ARTICLE:
The Elliott Waves Theory defines impulsive waves in Forex as five-wave structures. Also called motive waves, impulsive waves form everywhere.
One of the great things about the Elliott Waves Theory is that it starts from a simple concept—each market swing is either impulsive or corrective. This is a breakthrough in the logical process of counting waves with the theory.
In other words, there’s no other way to look at a market swing. No other alternative exists, and traders use a dual approach. For instance, one may look at a market to interpret if the last swing is impulsive or corrective. To do that, the trader concludes that the move is not an impulsive wave (for instance, there’s no extension). If it’s not impulsive, it must be corrective.
The next thing to do then is to check the kind of correction—simple or complex—and so on. The same is valid the other way around. When a trader tries to prove a corrective wave and the market doesn’t respect the rules, it means the move is impulsive. The next quest on the logical process is to find out what kind of impulsive wave it is.
The best way to look at the Elliott Waves Theory is to think of it as a logical process. Impulsive or corrective waves are the pillars of this process, and they interconnect.
For example, an impulsive wave has corrective segments too, or a corrective wave has impulsive waves too. There are no shortcuts in understanding the Elliott Waves Theory, and many traders fall prey to the so-called simplicity of it.
In reality, this is one of the most complex trading concepts in the world. In addition, it all starts with understanding impulsive waves and how they form.
Third-Wave Extension
The most common impulsive wave structure is the third-wave extension. By extension, Elliott refers to the longest wave of the three impulsive waves of a lower degree.
For a wave to extend, its length must exceed 161.8% of the next longest wave. Traders must compare the length of the first and the fifth waves and pick the longest one. Next, they must find out the 161.8% extension. Finally, they must project that outcome on the third wave’s length. The third wave must be longer.
The minimum extended level is only 161.8%. Many times, the market moves so aggressively during the extended wave’s formation that it exceeds the level multiple times. It is common to see 261.8%, 461.8%, or even more in strong impulsive waves.
In a third-wave extension, therefore, the third wave is the longest. On its own, it can be either a first-wave extended move of a lower degree or a third wave one. It is never a fifth-wave extension of a lower degree.
The fifth wave in a third-wave extension almost always ends beyond the end of the third wave. In other words, consider a bullish impulsive wave. The fifth wave usually makes a new high when compared with the end of the third wave. In a bearish impulsive wave with a third-wave extension, the fifth wave usually makes a new low. If it doesn’t, the market forms a pattern called a fifth-wave failure, discussed later in this article.

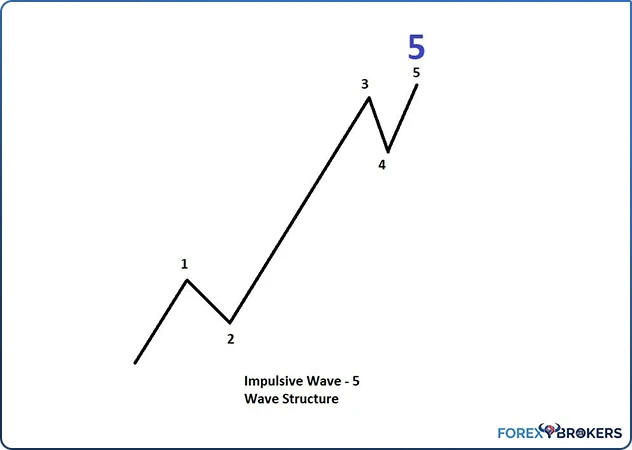
We can see in the image that the third wave is the longest one. We don’t need to check the extension because it is obvious that the third wave exceeds 161.8% of the first wave’s length. In fact, it is much longer, probably three or four times longer.
Trading the Third-Wave Extension
Because a third-wave extension is the most common impulsive wave, it’s the first trader’s option when counting waves. If the previous analysis required an impulsive wave to form next, a third-wave extension is most likely to form.
To trade it, we need Fibonacci ratios. The key here is to catch the extended wave as there is the time when the market moves the fastest.
A standard approach to trade the third-wave extension impulsive wave is to wait for the first wave to complete. When that’s done, place a pending buy limit order (in a bullish impulsive wave) or a pending sell limit order (in a bearish impulsive wave) at 50%–61.8% retracement level. That’s the entry for the trade.
The start of the impulsive wave must be the place for the stop-loss order. One of the rules of an impulsive wave states that no parts of the five-wave structure must move beyond the start of it. Hence, if the price goes there, the entire analysis is wrong.
To set the appropriate target, measure the length of the first wave and find out the 161.8% extension. Afterward, project it from the entry point to find out the minimum distance for the extended wave.
Because there’s no way to know where the extended wave ends, another approach is to book half of the profits by the time the price exceeds the end of the first wave. Next, move the stop loss to breakeven. Finally, trail the stop after the price reaches the 161.8% level.
The advantage is that it protects the account when being wrong while keeping the trade for a possible extension beyond the 161.8% level. The disadvantage is that sometimes traders get stopped on a small pullback.
Tips and Tricks on the Third-Wave Extension
Besides the standard trade in a third-wave extension, other setups exist. Remember that when counting an actual wave, we don’t know how the market unfolds. As Elliott traders, we do have an educated guess about where the market might go. However, that’s all.
In other words, by the time the order gets filled, as per the earlier example, we don’t know the extension. However, according to Elliott, the third-wave extension is the most common possibility. Therefore, there’s a high probability the market will form one. Trading financial markets is all about probabilities and tight money management rules.
Let’s assume the market does form a third-wave extension. It travels all the way beyond the 161.8% level and reaches the take profit. At that point, we know the first three waves in the impulsive move.
Simply wait for a correction. When it starts, measure the length of the extended third wave using a Fibonacci retracement level. Afterward, find out the 23.6% and 38.2% levels.
Rarely, the fourth wave retraces beyond the 38.2%, and if it does, it seldom reaches 50% retracement of the third wave’s length. Thus, a new setup would be to go long at 23.6%–38.2% retracement with a stop loss at 50%–61.8% and target new highs when compared with the end of the third wave.
While the risk-reward setup is not that generous, it is a way to trade the fourth wave in an impulsive move. Because there’s no room for a better risk-reward ratio, the volume traded here should be substantially smaller.
First-Wave Extension
The first segment of a first-wave extended impulsive move is the longest in the entire five-wave structure. This immensely helps in interpreting the other waves because one of the rules of any impulsive wave, regardless of its type, is that the third wave can’t be the shortest when compared with the first and fifth waves.
If the first is the longest and the third can’t be the shortest, the only possibility left is that the fifth wave is the shortest in the structure. Therefore, the simplest way to check the extended wave is to measure 61.8% of the first segment and compare it with the third wave. If the third wave is smaller than 61.8% of the first wave, we have an extension.
All three waves (first, third, and fifth) are impulsive, while the second and the fourth are corrective. The entire five-wave structure may be the first wave of an impulsive move of a larger degree, the c-wave of a flat, or wave a or c of a zigzag.
When finding a first-wave extension, an important thing to consider is the bigger context. More precisely, where does the structure fit?
As a rule of thumb, the price action following such a pattern must return to the end of the fourth wave. Check the image above—whatever follows after the end of the fifth wave must return to the end of the previous fourth wave.
Moreover, when the first-wave extension is the third wave of a larger degree impulsive move, the price action might even return to the second wave’s price zone.
Trading the First-Wave Extension
The main trading setup for the first-wave extension is similar to the one of the third-wave extension. More precisely, the main idea is to trade the pullback after the first wave, targeting the end of the third wave.
However, unlike in the case of the third-wave extension, this time, the risk-reward differs, and the distance until the target is smaller as well.
One good question here would be, how could anyone know what is the type of the impulsive move if all there is to study is the first wave? The right answer is that there’s no way of knowing it. However, we do have an educated guess by looking at the time taken by the second wave to form.
The way to go is to measure the time it took the first wave to form and project it on the right side of the chart from the start of the second wave. If the second wave (the correction) takes longer, the probability is high that the market forms a first-wave impulsive move.
To trade it, draw a Fibonacci retracement from the start until the end of the first wave to find out the 23.6%, 38.2%, 50%, and 61.8% retracement levels. The second wave should not retrace beyond 61.8%, and rarely part of it does exceed the 50% retracement.
An ideal entry is anywhere between 23.6% and 38.2%. The closest the 38.2%, the better, as the risk for the trade becomes smaller too.
For the stop-loss order, 61.8% will do a great job. If the pullback is strong enough to reach that level, most likely, the market forms a different pattern (probably a corrective structure). As for the target, use a smaller distance than 61.8% of the first wave; thus, the extended rule remains valid.
Tips and Tricks on the First-Wave Extension
One of the easiest ways to check if a market segment might be a first-wave extension is to examine the overlapping between the second and the fourth wave. They should NOT overlap. If they do, the segment is not impulsive but corrective.
As a reminder, overlapping refers to any part of the fourth wave should not travel into the second wave’s territory. If it does, the overlapping rule is not respected, and the move is not impulsive.
Another tip to consider comes from the second wave. It should consume the most time when compared with all the segments in the pattern. While not a mandatory condition, look for its presence to reinforce the first-wave extension.
To check that, simply use the shape form in the MT4 platform, copy it, and project it over the other waves. Alternatively, use the crosshair tool and count the periods. The second wave should have the most of them.
Look for the second wave’s retracement to not reach the 50% level when compared with the first wave. If that happens, that’s most likely only part of the second wave but not its end.
The fifth wave usually is small, barely making a new high (in a bullish impulsive move) or low (in a bearish structure).
Another thing to consider (this is valid for all types of impulsive waves) is that the fifth wave always exceeds 38.2% of the fourth wave. This is the minimum distance the fifth wave must travel; otherwise, the entire five-wave structure is not impulsive but corrective. As a matter of fact, the fifth wave almost always exceeds the fourth wave’s length; however, in the rare cases when it doesn’t, the 38.2% distance is a must.
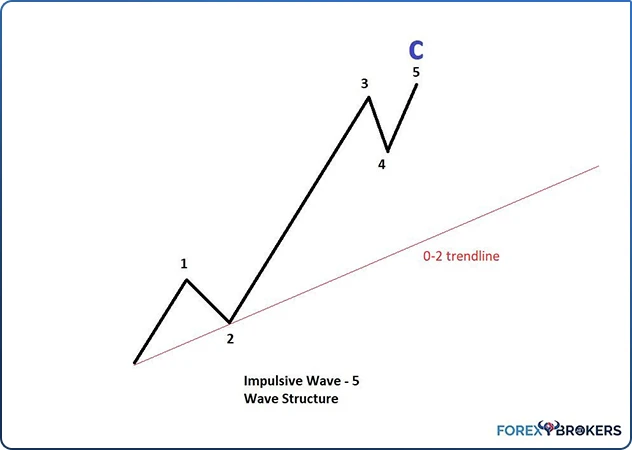
Fifth-Wave Extension
The rarest form possible of an impulsive move, the fifth-wave extension, forms most of the time as the c-wave of a flat or as the fifth wave of a fifth-wave extension. Confused? You shouldn’t be.
Check the image below. It shows how a fifth-wave extension impulsive move looks like. Well, the fifth wave in that picture might well be a fifth-wave extension of a lower degree.
This is the trickiest type of impulsive wave, so tricky that it involves hitting the stop-loss order once to profit from it. More about that in the upcoming paragraph.
As usual, all the impulsive waves’ rules remain in place. Namely, waves one, three, and five are impulsive as well. Moreover, there’s no overlapping among the corrective waves. Finally, the third wave is not the shortest when compared with waves 1 and 5.
Having said that, the problem with this impulsive wave is that it looks like a correction. That’s especially true at the start of it.
Remember that there’s no way to know what type of an impulsive wave the market forms after the first wave. Traders begin hunting a third-wave extension and buy the dip in the second wave on the 61.8% retracement, as explained earlier in this article.
However, while the market moves in the right direction, it stalls shortly after it exceeds the end of the first wave and begins correcting. In a third-wave extension, that’s not possible; however, traders also know that the fifth-wave extension rarely appears.
Therefore, they’re inclined to change the analysis and scenario to a corrective wave, labeling the first swing with the letter a and the second and the third ones with b and c, respectively.
Trading the Fifth-Wave Extension
Needless to say, by the time the pullback in the fourth wave starts, most traders are short (assuming a bullish impulsive wave), having a stop-loss order at the top of the third wave in the picture below.
When the stop is hit, the fifth-wave extended impulsive structure becomes obvious, and the savvy Elliott trader quickly switches to the new direction. In a bullish structure, the perfect entry is at the top of the third wave and the stop-loss order at the fourth wave’s bottom.
As for the target, measure the third wave using a Fibonacci retracement tool and find out the 161.8% distance. Afterward, project it from the end of the fourth wave to find out the minimum distance that the fifth wave travels.
The fifth wave rarely goes much more than the 161.8% level. In fact, by the time it approaches that level, that’s a great opportunity for a trade in the opposite direction. Later in this trading academy, we’ll look at that situation too.
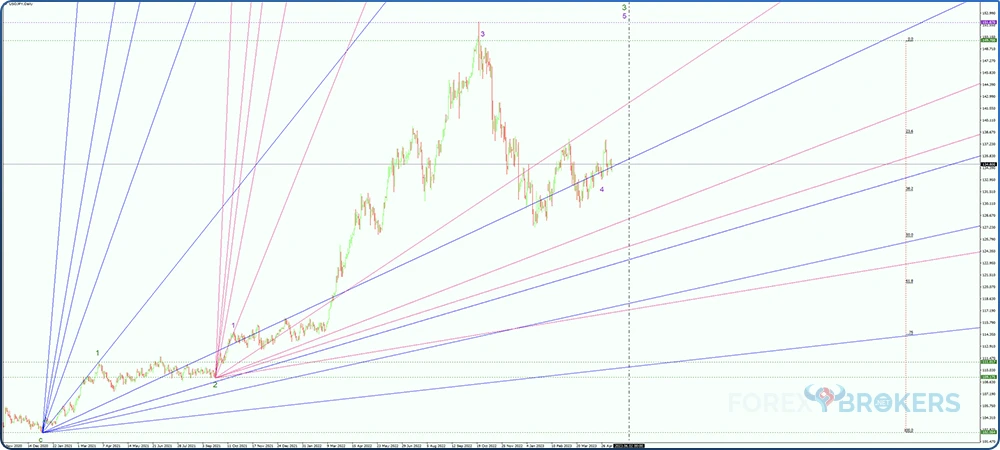
For today’s currency market, the above picture suffers some changes. More precisely, because of high volatility, the fifth-wave extension impulsive move has the third wave much longer than the first one. In fact, it relates to 161.8% of the first wave’s length.
The fifth wave also suffers some changes when interpreting the currency market. Most of the times, it exceeds 161.8% from the entire distance from the beginning of wave 1 to the end of wave 3, naturally added from the end of the third (or sometimes the fourth) wave.
Tips and Tricks on the Fifth-Wave Extension
Spotting this type of impulsive wave is the most difficult part. However, some clues exist regarding how to properly filter the information and to follow the Elliott logical process.
The key here is to interpret the first waves correctly. In an impulsive structure, regardless of its type, the first wave is impulsive as well. However, in a fifth-wave extension, the second wave retraces more than 61.8% of the first wave. For a corrective move, that’s not possible because only a zigzag has the first segment as impulsive.
In other words, the only explanation is that the market forms an impulsive wave of a larger degree. Considering that the third wave is slightly longer than the first one but there’s no extension, the only other possibility is that the fifth wave extends.
In retrospect or in theory, that’s easy to say. However, in practice, it takes a lot of time to filter all the Elliott rules and reach such a conclusion.
As a tip regarding this type of an impulsive wave, the last segment, the extended one, is aggressive. The five-wave structure there has small corrections, with the price spending most of the time traveling.
The advance is so strong because stops triggered on the way fuel the market move. As any open position squares when closed, it means that shorts will be squeezed as the market trips their stops. In other words, besides the regular buyers, most of the buying orders come from squaring the short positions. Therefore, the market travels faster than normal.
Double Extended Impulsive Waves
A curious situation exists when not one but two waves in an impulsive move have an extension. Remember that the extension refers to the next longest wave in the structure.
However, right at the start of an impulsive structure, we don’t know what the market will form. As such, the first educated guess is to look for the third wave to extend as it happens often.
By measuring the first wave and finding out the 161.8%, we discover the minimum distance the market needs to move for a third-wave extension to exist. Unsurprisingly, the price exceeds the level, validating the extension. At this point, all traders expect the next market swing after a small correction to just make a new high (in a bullish structure) or low (in a bearish structure) and then the price to reverse.
However, the market, instead of reversing after exceeding the highs in the third wave, continues in the same direction. Aggressively, tripping stop after stop, leaving everyone wondering what just happened.
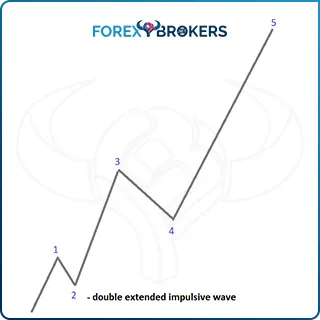
This is a double extended impulsive structure. Not only the third wave extends but also the fifth one. It easily exceeds 161.8% of the third wave and sometimes much more than that. In Addition, at the same time, it respects all the rules of an impulsive move mentioned so far in this part of the trading academy.
Luckily, this is a pattern forming extremely rare. Even the currency market, known for its aggressive price action, doesn’t form double extended impulsive waves as often as one might think.
In any case, it is good to know they exist, and if sometimes there’s another extension besides the third wave, just remember that this is a possibility with the Elliott Waves Theory.
Fifth Wave Failures
A unique impulsive wave, the fifth wave failure is one of the most powerful reversal patterns with the Elliott Waves Theory. When the market forms a fifth wave failure, it puts in a meaningful top or bottom.
An important thing to consider is that a fifth wave failure only forms when the third wave extends. Furthermore, as the name suggests, the market fails to put in a new high or low (depending if the impulsive wave is bullish or bearish).
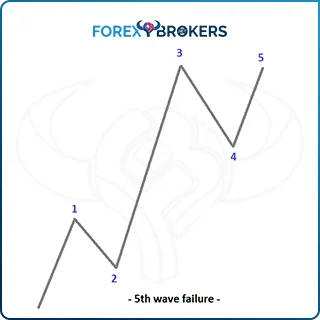
In addition, one key element that differentiates a fifth wave failure from other impulsive waves is that the fourth wave is more complex than the second wave. Moreover, it should retrace more into the third wave’s territory than the second wave does into the first wave’s territory.
Most of the times, the fifth wave equals the first wave both in price and in time. In the rare cases when it doesn’t, look for the two waves to respect the golden ratio (61.8%) both in price and time.
A fifth wave failure (a meaningful top or bottom) doesn’t form anywhere in the Elliott theory. It needs a specific context, appearing after a specific market behavior.
First, the most commonplace for the pattern is the fifth wave of a fifth-wave extended move. Just check the conditions for such a pattern as we stated them earlier in the article, and for the fifth wave, the market might form a failure.
Another option is that of a c-wave in a flat pattern. Finally, a fifth wave failure may also appear as a third wave in an impulsive move of a larger degree. However, when this happens, the fifth wave also fails. These two conditions are so rare that such situations are hard to see on today’s currency market.
Corrective Waves as Part of the Structure
Even though the article is about impulsive waves, we must also talk about corrective waves. After all, the second and fourth waves are corrective. Here are some things to consider when counting corrective waves part of an impulsive pattern.
If the first wave is the extended one, look for the second wave to fail to retrace more than 38.2% of it. The percentage changes dramatically if the first wave doesn’t extend—the second wave might retrace as much as 99% of the first wave.
The fourth wave is difficult to trade and interpret. Human nature comes into the equation as traders that got the impulsive move right prepare to book profits.
Many traders prefer not to take chances on the fifth wave and close everything by the time the market reaches the end of the third wave. Nevertheless, the fourth wave offers some interesting perspectives for the entire five-wave structure.
If the market forms a fifth-wave extension, the fourth wave is more complex and time-consuming than the second wave. On the other hand, in a first-wave extension, things are opposite—the fourth wave is much simpler than the second wave.
Interpreting Various Impulsive Waves
Putting the theory in practice requires a lot of attention to detail as even the slightest error leads to a different outcome. The problem is that an error in one place influences the entire analysis.
Trading with the Elliott Waves Theory requires an analysis of different cycles. If a trader only looks at the hourly timeframe and begin counting waves, the analysis is incomplete. The true process involves an analysis of all available timeframes using a top-down approach. This way, all cycles of various degrees become visible and part of the Elliott analysis.
Let’s have a look at an example. Below is a regular price action as it appears on different currency pairs and on all time frames. How would you label it?
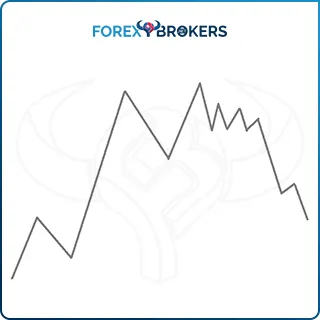
Incorrect Interpretation
The classic mistake is to believe that each segment belongs to an impulsive wave of a different degree. Because of that, the majority of Elliott traders use an interpretation like the one seen below:
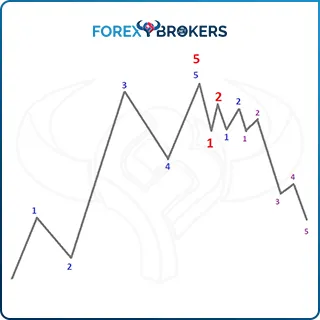
Namely, an impulsive wave (in blue) finishes an impulsive wave of a larger degree (fifth wave in red). Next, the first swing lower is the first wave of a new structure and so on. Each swing represents the start of a new cycle of a lower degree until a five-wave segment develops.
What’s wrong with this picture? Plenty of things. To start with, the second wave (in blue, the first one on the left of the chart) takes more time and percentage retracement than the same wave of a larger degree (in red). It indicates that the market is not getting weaker but stronger.
Moreover, the subdivision in multiple cycles of a lower degree in such a short time frame is never correct. Whenever you reach a similar point like this, look for a mistake down the road as such a count is incorrect.
Finally, think of the 0-2 trendline. In an impulsive move, draw an imaginary (or simply draw it on a chart using a trendline just to check the condition) line connecting the start of the impulsive structure with the end of the second wave of a similar degree. No parts of the third wave to follow should pierce the line. Not the case here as seen below:
Correct Interpretation
Counting waves with the Elliott theory is much simpler. Always consider this: the more complex the count becomes, the higher the probability that the analysis is incorrect.
Triangles are the common way for the market to spend time. Often, the market sits in tight ranges and has nowhere to go. When it does that, it forms a triangular pattern.
One of the most common places for a triangle to form is at the end of a complex correction. Therefore, instead of interpreting cycles of various degrees as shown above, the simpler and correct way is to look for a triangular pattern that forms at the end of a complex correction.

In other words, what seemed to be impulsive is nothing but corrective. The entire structure here respects the rules of a corrective wave that ends with a triangle. More exactly, this is called a double combination, a pattern we’ll cover later in the trading academy.
The reason why it appears here is to show how traders should count the cycles. Instead of multiple cycles on the same chart, look for simpler, easier options forming on the same time frame. As a rule of thumb, different cycles rarely appear on the same time frame, and most likely, each time frame shows one cycle.
Conclusion
As five-wave structures, impulsive waves form when the market advances or declines. However, even strong impulsive waves have two distinct corrections.
It shows the interdependency of the two wave structures (impulsive and corrective) and how it is impossible to consider one without the other. Impulsive waves have corrective segments, and corrective waves have impulsive segments.
Many types of impulsive waves exist, and we covered here only the basics. The next section of this academy treats the rules to follow when interpreting and trading impulsive waves. It should not come as a surprise that other rules exist as the theory gets more complicated the more we dive into it.
Thus far, we’ve covered the Elliott Waves Theory generalities and the basics of impulsive waves. We already have a solid base for the Elliott principles, and it is time to move to corrective waves.
The next two articles cover simple and complex corrections, followed by how to use a top-down analysis when interpreting market structures. If so far we’ve only shown theoretical structures, starting with the article dedicated to the top-down analysis principle, we’ll look at clear examples on the currency market.
Overall, this trading academy covers the Elliott Waves Theory in 13 different articles, highlighting its importance and value. Traders who have mastered it have found a great tool to understand the chaos often seen in the currency market.