LISTEN TO THIS ARTICLE:
Long before technical analysis appeared in the Western world, in other parts of the world, it was a popular way to forecast future market prices. While many consider the United States as the birthplace of technical analysis, the reality tells us something different.
Japan in the mid-eighteenth century was a country with a strong economy. Different regions were ruled by families that traded goods with their neighbors. Among other commodities, they traded rice.
As with any commodity nowadays, the price of rice greatly depended not only on demand but also on supply. Weather played an important role in the supply chain, and those who controlled storage facilities could easily influence the price of it.
In time, rice traders learned to forecast future price increases or decreases based on the supply and demand coming in and out of the market. By maintaining accurate daily notes of the price evolution, the Japanese set the basis of what we know today as Japanese candlestick techniques.
Steve Nison, an American, is responsible for introducing the concept to the Western world. It wasn’t until the start of the 1990s that Nison put together his research and findings in a book on the Japanese patterns that stunned Wall Street.
The simplicity and accuracy of Forex Japanese candlesticks quickly revolutionized technical analysis. In short order, Japanese candlestick charts replaced the traditional bar charts that had been used up to that point.
Sure, veteran traders still use bar charts to this day, but the overwhelming majority of traders switched to candlesticks. As the Japanese used to say, each candlestick on a chart tells a story.
Some patterns need only one candlestick for completion—others need two, three, or more. In general, we can say that most of the patterns need up to three candlesticks.
Advantages Over the Classic Technical Analysis Patterns
The beauty of Japanese candlestick patterns is that they take far less time to complete when compared with the classic technical analysis patterns. Before going into more detail, we should mention that Japanese candlestick patterns are mostly reversal formations. Therefore, as part of the classic technical analysis we should compare them to similar reversal patterns – namely, classic technical analysis patterns forming at the top or bottom of a trend that are well known to traders worldwide.
For instance, the head and shoulders pattern, the double or triple top or bottom, the rising and falling wedge, and so on. All these patterns proved their place in technical analysis, and traders still use them to this day.
However, one of the major drawdowns when using the above-mentioned classic technical analysis patterns is the fact that they take a lot of time to complete. Take, for instance, the head and shoulders.
First, the price consolidates on the left shoulder. The consolidation takes a lot of time (i.e., candlesticks) before the price breaks higher. Second, after the head formation (i.e., an aggressive move higher followed by a quick pullback to the consolidation area provided by the left shoulder), the market begins another consolidation, this time to complete the right shoulder. Finally, only after the neckline breaks does the pattern complete.
All in all, the pattern needs many candlesticks to form – the same is valid for the rising and falling wedges or double or triple tops. They all signal a reversal, but the time needed for the pattern to form makes it difficult for traders to trade them.
Therefore, traders focus on the end of the patterns, but that means a lot of wasted time until the pattern ends. Japanese candlestick patterns take far less time. Consequently, traders embraced them quickly.
What Makes a Candlestick?
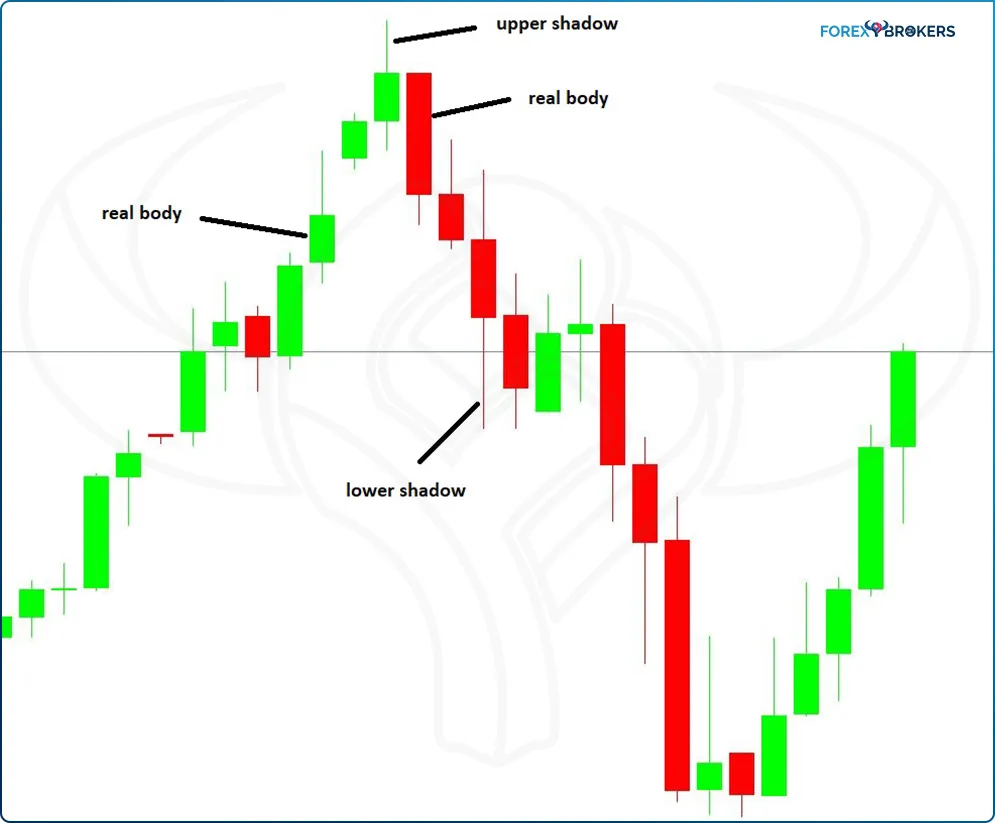
A candlestick shows the price action in a period. Regardless of the timeframe, it has the same elements – open and closing prices, a real body, upper and lower shadows.
The open price always coincides with the previous candlestick’s closing price. However, there are some things worth mentioning here.
One would be the timeframe. For instance, the lower the timeframe, the bigger the chance that the open price of the new candlestick will show a gap when compared with the closing price of the previous one.
Think of the one-minute or five-minute charts. Because important economic releases create a sudden move in markets, there’s often a gap at the opening of a new candlestick when news comes out. The same is valid on the bigger timeframes – there may be a gap on a Monday’s opening price, but that gap is not visible on the monthly candlestick.
The distance the price travels between the opening and the closing price is called the real body. If the market closes above the opening price, that is bullish price action. If it closes below, that’s a bearish market reaction.
As for the shadows, they reflect the highest and lowest point during a period when compared with the opening price. More precisely, you’ll only see a shadow when the market reverses the earlier price action.
For instance, let’s assume the EURUSD currency pair opens a new daily candlestick at 1.1313. It may be the case that during the trading day, the price rises to 1.1355, but closes well below the opening price, say, at 1.1288. The distance from the opening price (1.1313) to the highest point in the candlestick is called the upper shadow, and it’ll take the shape of a line above the candlestick’s real body. The opposite happens on a bullish candlestick, with the initial market reaction making a low when compared with the opening price.
Japanese Candlestick Patterns
A pattern is defined as a situation with similar conditions that keeps repeating in time. If classic technical analysis patterns require an “eye” for technical details and, sometimes, the use of imagination, Japanese candlestick patterns have clear and easy rules to use when trying to identify them.
As mentioned earlier, the Japanese candlestick patterns do not need many periods to form. In fact, some of them require as little as a single candlestick, and most of them are two- or three-candlestick patterns.
Most of the patterns appear at the end of bullish or bearish trends. In other words, they form a reversal, reflecting a “battle” between bulls and bears. The bigger the timeframe, the stronger the pattern and its implications are.
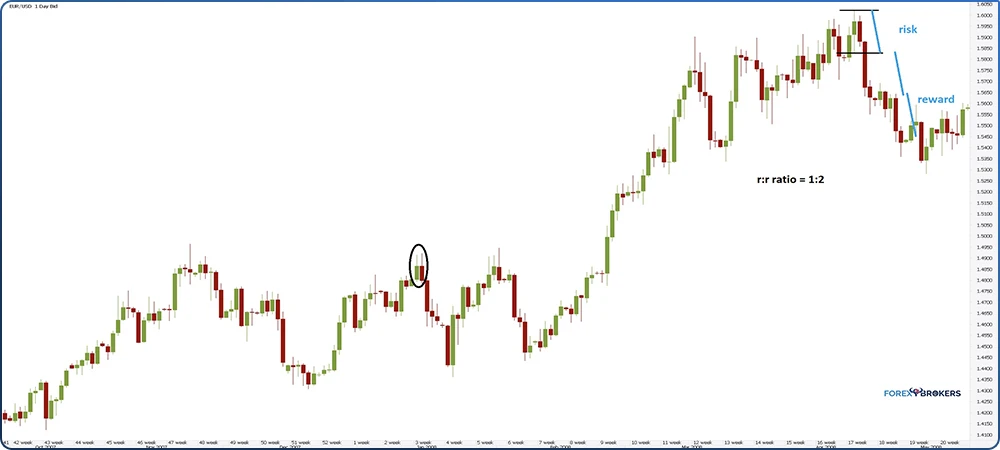
The beauty of trading with Japanese candlestick patterns is that they provide a clear setup to follow and trade. Traders know where to enter the market, where to set the appropriate take-profit and, equally important, where to set the stop-loss order.
Because the patterns take far less time when compared with classic technical analysis structures, the resulting risk-reward ratios exceed the usual 1:2 ratio. In fact, one of the most promising risk-reward ratios in technical analysis arises from using Japanese candlestick patterns.
In this article we’ll discuss the most relevant ones, involving one, two, or more candlesticks. As you’re about to find out, almost all of them form at the top or bottom of a trend.
One Candlestick Reversal Patterns
Sometimes all the trader needs to see is a single candlestick before interpreting a market. When it comes to Japanese patterns, the bigger the timeframe, the stronger the implications for the overall market.
For instance, the price will have bigger chances to reverse one pattern on the hourly timeframe, than a similar one on the weekly or even monthly charts. For this reason, the Japanese candlestick patterns work best on bigger timeframes when swing trading, rather than on lower ones when scalping.
The Hammer and the Shooting Star
The most famous one-candlestick reversal pattern is the hammer or the shooting star. A bullish pattern, the hammer forms at the end of bearish trends, meaning that the shooting star is the opposite of a hammer, forming at the end of bearish markets.
Later in this trading academy, an entire article discusses the hammer pattern and the shooting star as well, highlighting their importance. At this point, however, it is worth mentioning the elements of a hammer or shooting star: a small real body and a long lower or upper shadow.
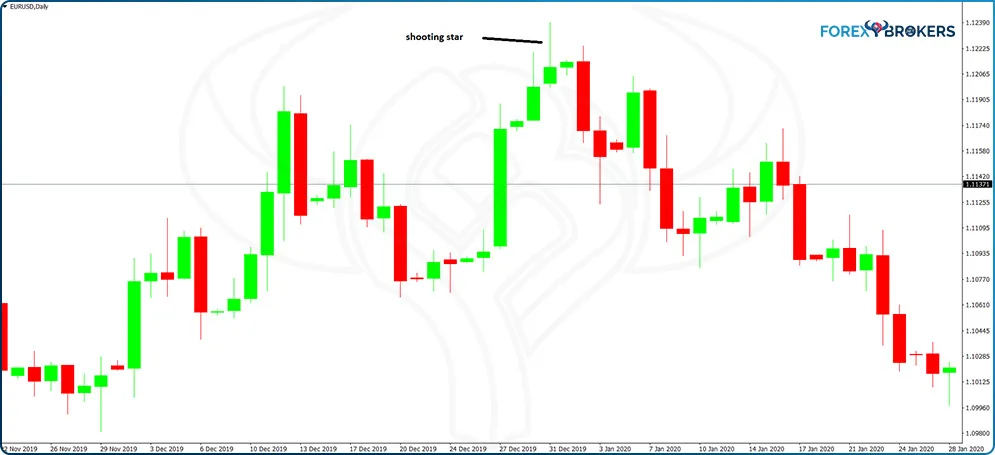
The EURUSD daily chart from above shows a shooting star. Note the long upper shadow and the relatively small real body in comparison. Also, the color of the real body has no influence on interpreting the shooting star. This means that the candlestick may be bearish as well (i.e., having a red real body) and mean the same thing – a reversal is about to come.
One mandatory condition often forgotten by many traders is that the price action before the hammer or the shooting star must trend. In other words, a similar pattern like the one presented above has no meaning if the market didn’t form a bullish trend before. That’s a prerequisite for all reversal patterns – the market must trend, either higher or lower, and at some point in time, it forms a reversal pattern.
The Doji Candlestick
We can say without a doubt that the Doji candlestick is the most “mysterious” one-candlestick pattern belonging to the Japanese technical analysis. As a single candlestick, it has a dual interpretation. Effectively, it acts both as a continuation and as a reversal pattern.
How is that even possible? The explanation comes from the fact that all we know about the Doji candlestick is that it shows uncertainty. No one knows what follows – a continuation in the same market direction or a sharp reversal?
To correctly interpret the Doji candlestick when trading Forex, traders must be flexible in applying the rules of the pattern. More precisely, the original Doji pattern requires similar opening and closing prices.
If we use the real body’s definition explained earlier, it means that the Doji candlestick has no real body. However, in the Forex market, that’s difficult to find. The market changed dramatically in the last several years.
The introduction of Electronic Communication Network (ECN) and Straight-Through Processing (STP) meant the proliferation of five-digit market quotes. In other words, before the ECN and STP, most currency pairs on the Forex dashboard had a four-digit quotation (e.g., EURUSD 1.1313). The new technologies made it possible for brokers to offer five-digit quotes to retail traders, too, without damaging the spreads and costs of trading (e.g., EURUSD 1.13138).
Such developments make it difficult to find candlesticks that have identical opening and closing prices. Therefore, currency traders must use a certain degree of flexibility when searching for Doji candlesticks. More precisely, they should look for “almost” similar levels.
- Example of a Doji Candlestick
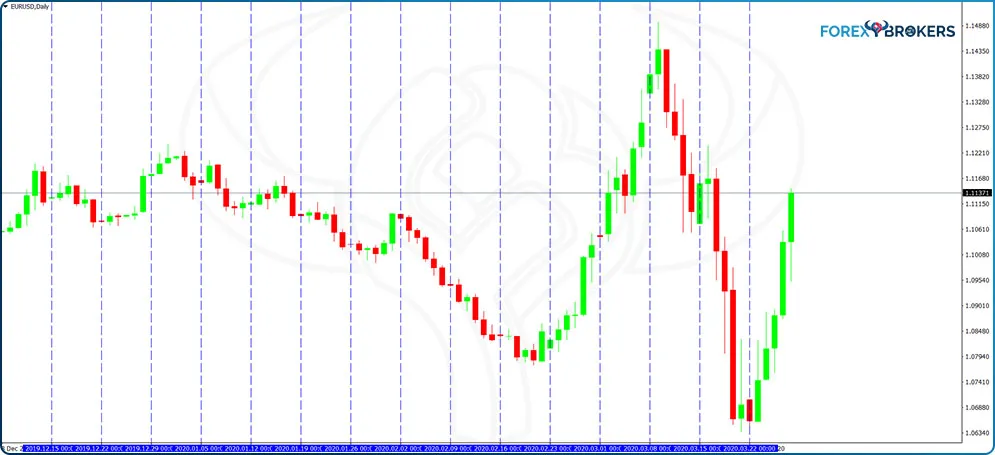
Before looking at an example, there’s an important caveat to consider when trading Doji patterns on the daily chart. Many brokers show a daily candlestick corresponding to Sunday trading too.
In some parts of the world (e.g., New Zealand), the market opens while in other parts it is still Sunday. Trading goes on for a couple of hours or so, and many trading platforms register the trading activity. After all, if buyers and sellers were active, the transactions must appear on a chart.
The problem is that, often, that is illiquid trading, with the market going nowhere. Because of the way the platforms are built, the trading activity is recorded as one candlestick on the daily chart, despite the fact that the market only traded for a couple of hours. Hence, most of the Sunday candlesticks look like a Doji pattern.
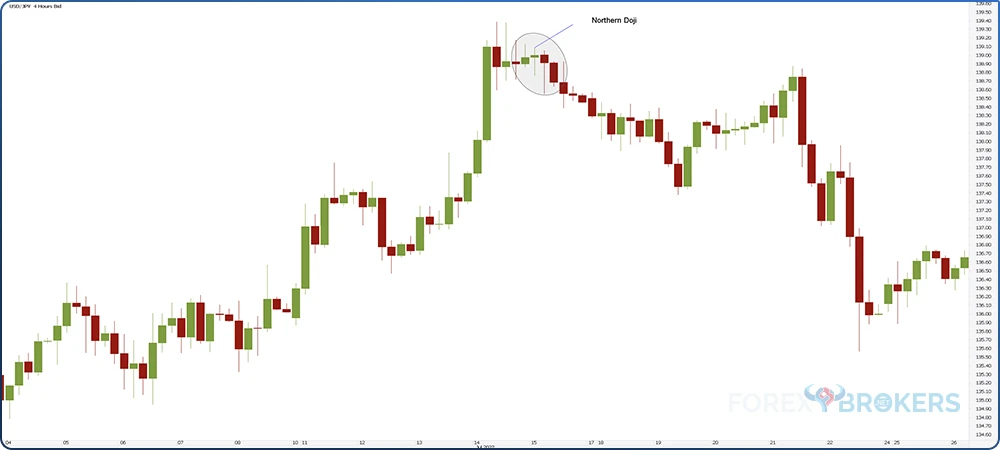
To avoid the misinterpretation, traders can ignore the daily chart (not recommended) or consider and interpret only the potential Doji candlesticks forming during the trading week. The EURUSD daily chart from below shows the Sunday candlesticks corresponding to each vertical line. Any interpretation of a Doji candlestick using the daily chart should consider only the candlesticks forming between the blue vertical lines.
If we zoom in to check the price action between the vertical lines, the four-hour chart reveals numerous Doji candlesticks. The chart below shows some examples of a random period chosen from the ones listed above.
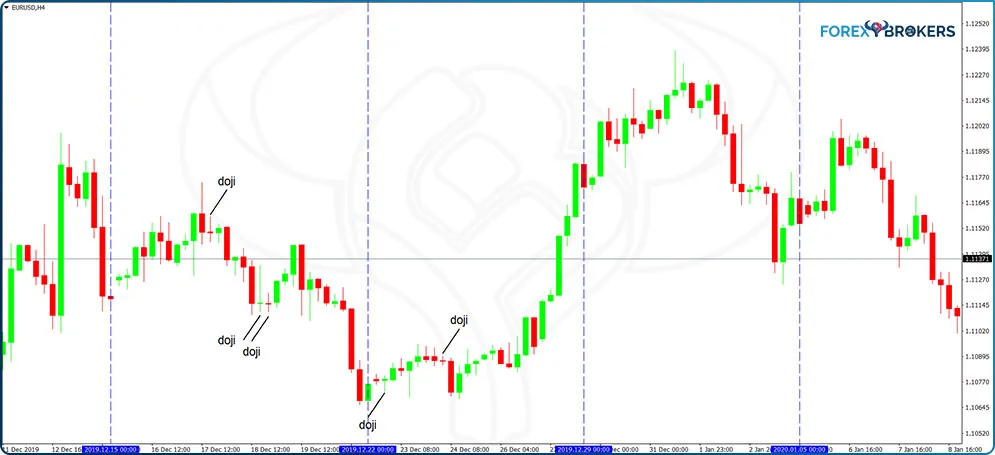
Note that the Doji candlesticks have similar, albeit not identical, price levels for the opening and closing levels. Hence, the trader’s flexibility when identifying Doji candlesticks is obvious.
- Types of Doji
The structure of a Doji requires similar opening and closing prices and an upper and lower shadow. Depending on where the Doji forms and where the real body forms too, several types of Doji candlesticks exist.
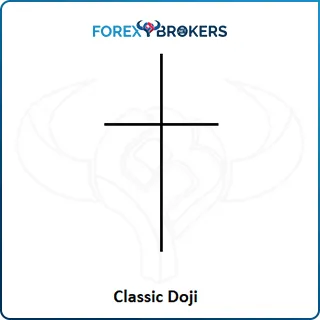
Classic Doji Pattern
A classic Doji resembles a cross. It has the same structure, regardless of whether it appears at the top of a bullish trend, during a trend’s formation, or at the bottom of a bearish trend.
At any time when trading or interpreting a Doji candlestick, keep in mind one simple thing – what the candlestick shows. More exactly, always remember what the price action during the candlestick’s formation tells.
The inability of bulls to overcome bears, or of bears to overcome bulls, results in undecisive levels. As a comparison, think of two teams competing and having a direct match. A Doji candlestick shows a draw – no team wins.
However, corroborated with some other elements, the Doji candlestick offers a lot of information about what’s going to happen next. Most importantly, it shows a battle, indecision, uncertainty, range, and the market takes a breather before the next leg higher or lower.
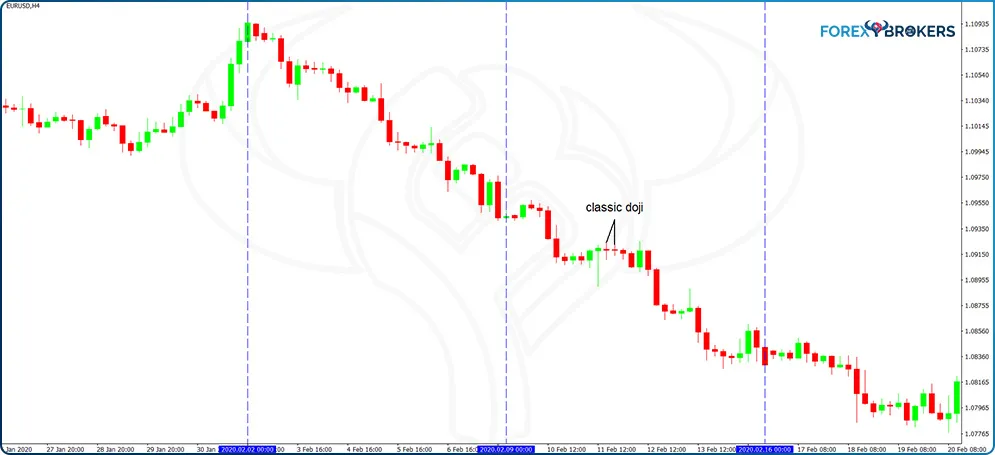
The chart above shows two classic Doji candlesticks. Let’s put them into context. First, we see that the market is already in a bearish trend given by the lower lows and lower highs series. Second, the Doji candlesticks form one after another – they show hesitation. Next, the price resumes the bearish trend, making a new low. In this case, the classic Doji candlesticks acted as continuation patterns.
Confluence areas exist when trading candlestick patterns too. Two or more candlestick patterns appearing at the same level tend to reinforce the overall interpretation. In this case, the two classic Doji candlesticks reinforced the uncertainty. The best thing to do is to wait for the market to break the range defined by the Doji candlestick before taking some action.
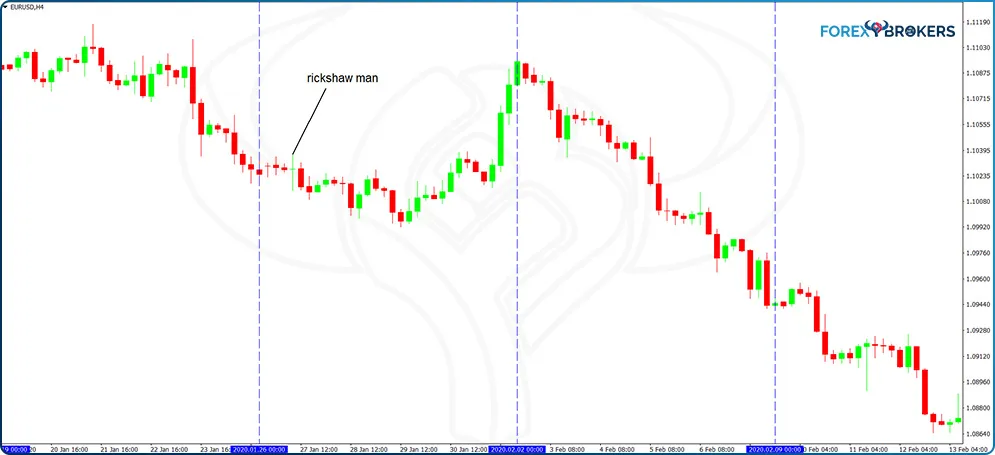
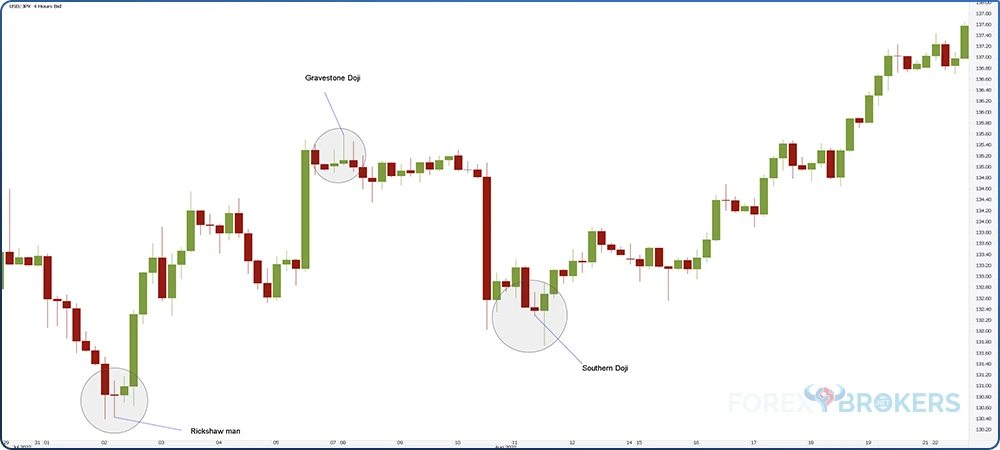
Rickshaw Man
One of the most powerful Doji patterns, the Rickshaw Man has long upper and lower shadows. Also called long-legged Doji, the Rickshaw Man pattern offers powerful trading setups – on a break higher or lower, the market continues at least the distance covered by the Rickshaw Man.
However, having a stop-loss is mandatory due to the uncertainty aspect of the Doji candlestick. Traders do not know if, in the end, the Doji acts as a reversal or a continuation pattern. But when it breaks the edges of a Rickshaw Man, most of the time it signals a sustained move to follow.
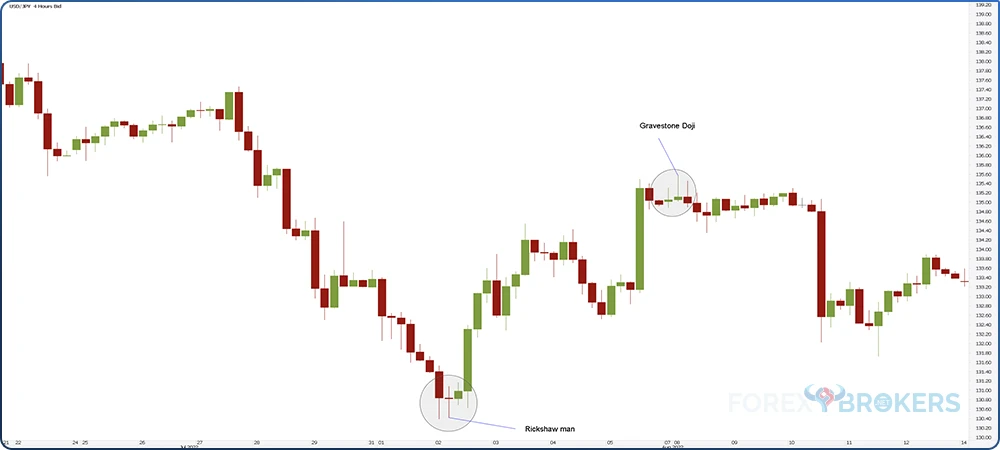
The chart below reveals a Rickshaw Man pattern that formed in the middle of a bearish trend. However, at the time it formed, traders didn’t know if the Doji candlestick would act as a reversal or a continuation pattern. Hence, the thing to do is to wait for the price to break one of the two edges of the Doji candlestick. Next, go long or short, depending on the break, with a stop-loss at the opposite edge. Finally, book half the profits when the price reaches a distance equal to the Rickshaw Man’s range and move the stop-loss for the rest to break even.
Gravestone Doji
The name of this Doji candlestick speaks for itself – this is a bearish pattern. The Gravestone Doji has a long upper shadow and almost no lower shadow, making the opening and closing levels close to the lower edge of the Doji candlestick.
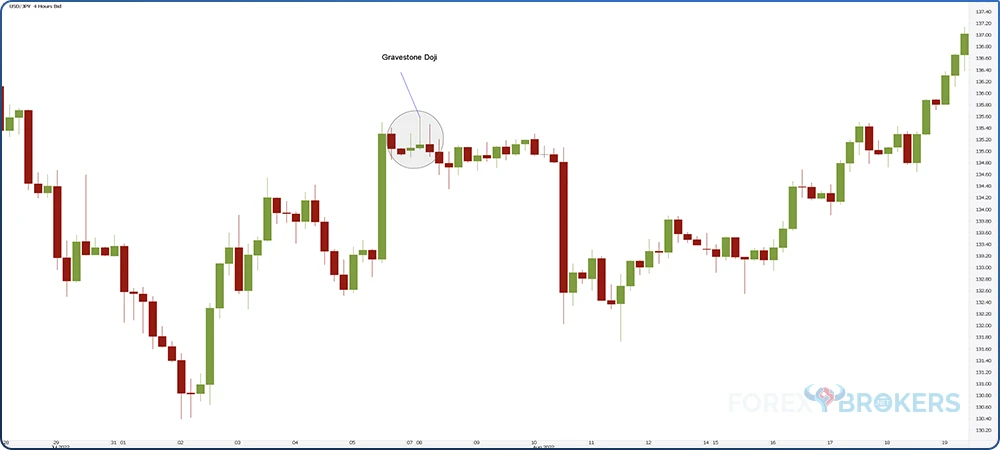
Again, when trading on the currency market, the Gravestone Doji rarely appears exactly as in textbook materials, like the Japanese intended centuries ago. However, with a bit of flexibility, we can spot a Gravestone Doji on the currency market too.
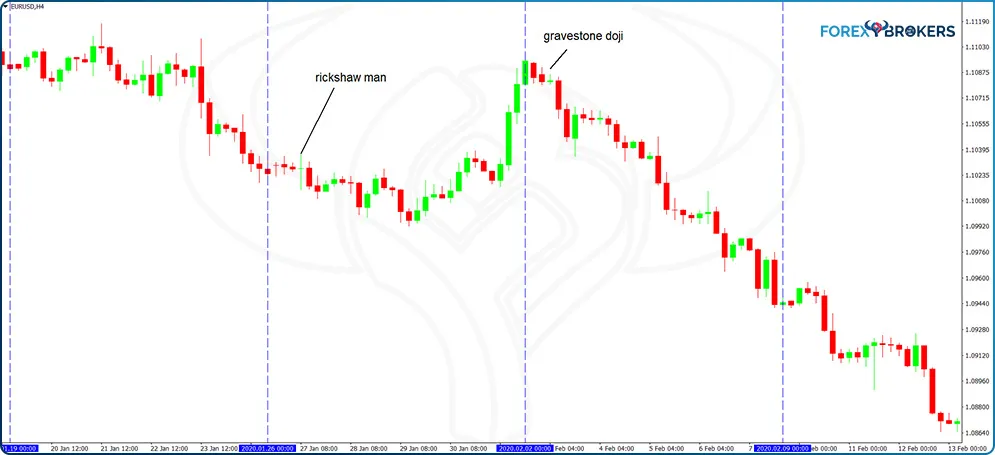
An interesting fact about the Gravestone Doji is that it signals bearish price action to follow, regardless of its position. More precisely, it may signal a reversal if it forms at the end of a bullish trend, but also a continuation pattern if it forms during a descending market.
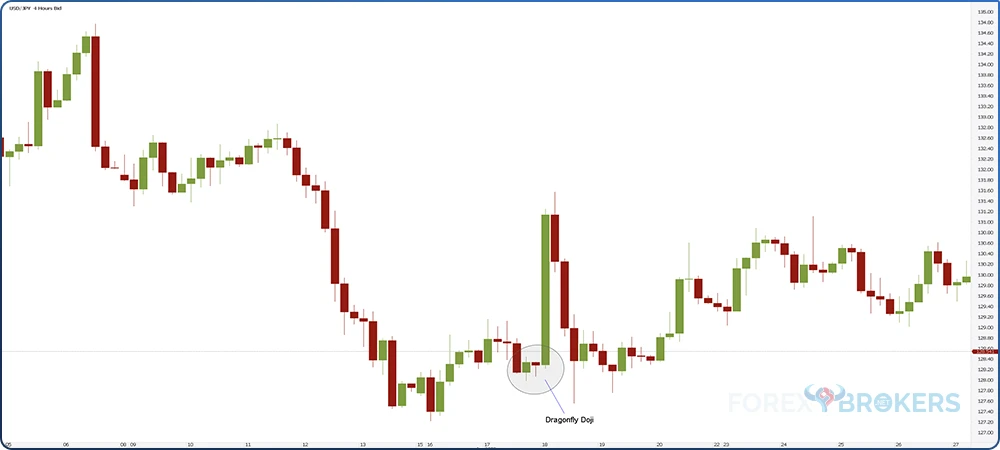
Dragonfly Doji
The Dragonfly Doji is the opposite of the Gravestone Doji and forms either at the bottom of bearish trends or during strong rising markets. It shows upside pressure and has a long lower shadow and little or no upper shadow.
Southern and Northern Doji
The Southern and Northern Doji candlesticks form at the end of bearish and bullish trends, respectively. The name refers to where the opening and closing levels appear (in the lower half and upper half of the candlestick’s range, respectively) as well as where the Doji candlestick forms (at the end of bearish and bullish trends, respectively).
As such, a Southern Doji forms at the end of a bearish trend. Or, towards the bearish trend’s end. It doesn’t mean that the market can’t form a new low – it signals that the bearish trend is exhausted and bulls enter the market. Ideally, the Southern Doji forms after a string of bearish candlesticks with a strong real body.
The Northern Doji shows exactly the opposite. The market rises, ideally forming a string of bullish candlesticks with a strong real body, before a Northern Doji forms. The opening and closing prices of a Northern Doji are in the upper half of the candlestick, meaning that the pattern has a long lower shadow and a smaller upper shadow. As in the case of the Southern Doji, the price action after a Northern Doji does not imply that the market won’t make a new high – it merely means that the bullish trend gives signs of exhaustion and bears enter the market.
An interesting fact about the Southern and Northern Dojis is that they have a strong meaning on the stock market. The stock market is characterized by forming a gap at the opening of almost every trading day. Therefore, when Southern and Northern Dojis form, accompanied by a gap, they signal a powerful reversal pattern.
- Confluence Areas with Multiple Doji Candlesticks
The concept of a confluence area implies that at one point on a chart, many different patterns suggest the same thing. Or, simply put, the price has a harder time breaking through or clearing a confluence area.
In the case of Doji candlesticks, sometimes the market forms two or more Doji patterns in the same area. That’s a confluence area, having stronger implications than one single Doji pattern.
The chart below shows three consecutive Doji candlesticks, with two of them having a bearish implication. First, the market forms a Rickshaw Man. Normally, traders should wait and see the direction the market breaks before going long or short. But this time is different.
Second, the next candlestick is a Northern Doji. As mentioned earlier, it forms at the end of a rising market, suggesting the path of least resistance is to the downside, regardless of how the price after the Rickshaw Man breaks.
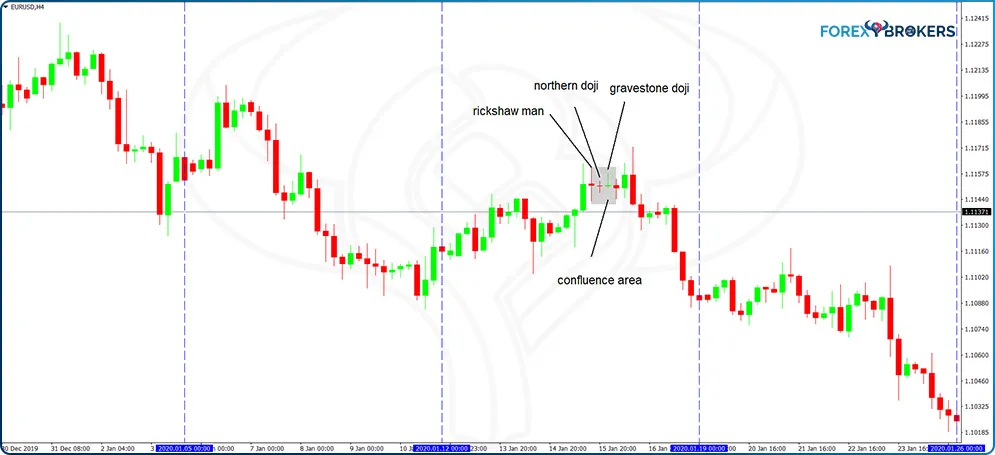
Finally, the Gravestone Doji reinforces the bearish bias and the overall confluence area shows exhaustion. Despite the fact that the price made a new marginal high, the market eventually reversed, and the bearish trend, the main one, resumed.
Two-Candlestick Reversal Patterns
So far, we’ve looked into the one-candlestick patterns, mainly the different types of Doji. The Doji is a common candlestick pattern, forming on all markets and timeframes.
The Japanese candlestick techniques also cover patterns that need more than one candlestick to form. In the category of two-candlestick reversal patterns, the most prominent ones are the engulfing and the piercing patterns.
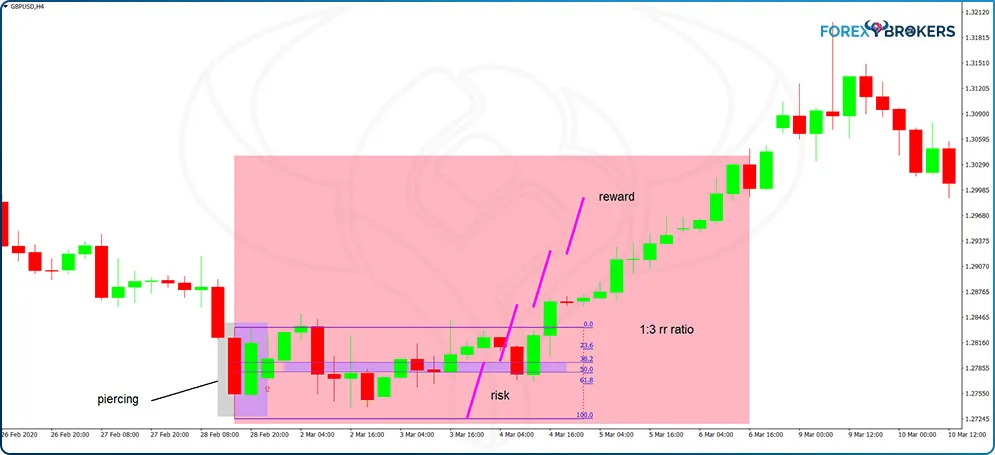
Piercing
Just like in the case of classic technical analysis patterns, all reversal patterns have an equivalent. For instance, the rising wedge pattern in classic technical analysis has its equivalent, the falling wedge. The same is valid in the case of Japanese candlestick patterns.
The piercing pattern is the bullish equivalent of the dark-cloud pattern. This means that it forms at the bottom of bearish trends, in contrast to the dark-cloud pattern that forms at the top of a bullish market.
For the piercing and the dark-cloud patterns, we only need two candlesticks. Because they are reversal patterns, a mandatory condition is the pre-existence of a bearish or bullish trend prior to the piercing or dark-cloud cover patterns’ formation.
Before the piercing’s formation, the market is in free-fall mode. Bears are in control, and nothing signals a reversal. Even the first candlestick part of the pattern is bearish and has a strong real body. Suddenly, bullish interest enters the market and a bullish candlestick forms.
The main condition for this two-candlestick pattern is that the second candlestick must retrace more than fifty percent of the previous candlestick’s body, but not more than one hundred percent. The chart above shows a beautiful piercing pattern on the GBPUSD 4h timeframe.
- How to Trade the Piercing Pattern
The following setup is valid when trading all two- or three-candlestick patterns as part of the Japanese candlestick techniques. First, you need to mark down the extremes of the piercing pattern.
More precisely, take two horizontal lines and mark the highest and the lowest point in the two candlesticks that make the piercing pattern. Second, use a Fibonacci ratio to find out the 38.2%-50% retracement level – that’s the entry for a long trade.
The retracement is mandatory, and if it doesn’t come, simply skip the trade. The reason for the retracement is that the market, remember, is bearish. Bears won’t give up that easily and will put up a fight. Often, the piercing pattern fails, in the sense that the bears manage to push the market to make a new low below the lowest point in the piercing pattern. For this reason, the risk-reward ratio accompanying these setups must exceed 1:3.
Therefore, the final step involves going long on the 38.2% retracement, setting the stop-loss at the lowest point in the piercing pattern, measuring the risk, and projecting it three times to the upside to find the target. The chart below shows the process in more detail.
Engulfing
Just like in the previous case, there is one bullish and one bearish engulfing pattern. The difference between the two is only that one forms at the end of a bearish trend, and the other at the end of a bullish market.
The bullish engulfing pattern is formed out of two opposite candlesticks – the first one bearish and the second one bullish. The only difference between the piercing and the bullish engulfing is that in the engulfing case, the second candlestick must totally engulf the previous candlesticks’ body.
However, there’s a catch. While the second candlestick must engulf the first candlestick’s body, it must not engulf its higher shadow too. If that’s the case, the pattern is invalidated.
- How to Trade the Engulfing Pattern
To trade the engulfing pattern, we use a similar process as the one described earlier. First, we mark the highest and lowest points in the pattern using two horizontal lines.
Second, we use the Fibonacci Retracement tool to find out and mark the 38.2%-50% area. This area is the entry for a long trade, and many traders use a pending buy limit order to make sure they get it. Finally, the stop-loss and the target must respect a minimum 1:3 risk-reward ratio.
Three-Candlestick Reversal Patterns
The most famous three-candlestick pattern is the morning or evening star. As the name suggests, the first pattern is bullish, while the second one is bearish.
Because they are reversal patterns, a bearish, respectively a bullish trend must exist prior to the star’s formation. In a morning star, the first candlestick in the pattern doesn’t suggest that the trend is about to reverse. It has a strong, bearish real body, in line with the dominant falling trend.
The second candlestick shows market hesitation. It has a small real body, and ideally it is a one-candlestick reversal pattern like a hammer or a Doji. When this happens, the star reversal pattern is even more powerful.
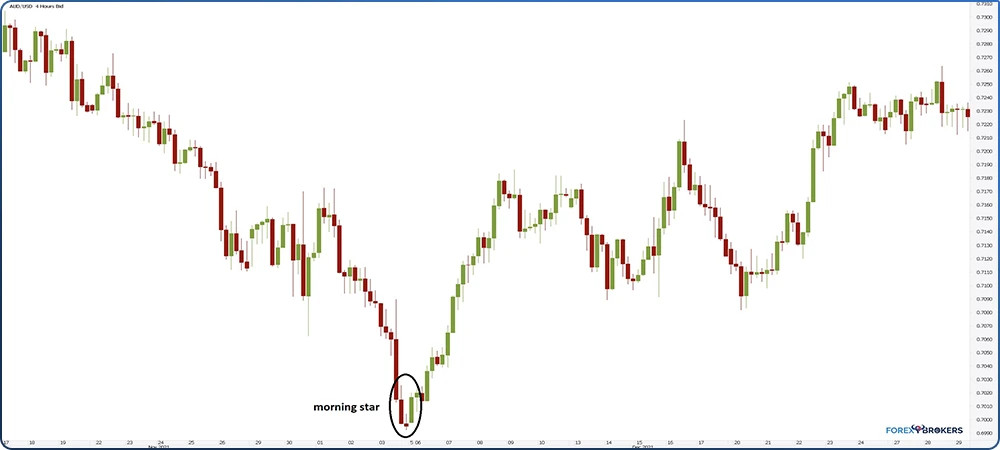
The third candlestick in the pattern has a strong bullish real body that retraces more than fifty percent into the territory of the first candlestick part of the morning star. The bigger the retracement, the better for the reversal pattern.
- How to Trade Stars
To trade morning and evening stars, we must follow a similar process as with the piercing and engulfing patterns. It all starts with marking the highs and lows of the pattern using two vertical lines.
Next, find out the 38.2% and 50% retracement levels by using the Fibonacci Retracement tool – the 38.2% area acts as the entry on the long side of the market. Finally, set the stop-loss at the low point of the pattern, regardless of which candlestick in the morning star formation has the lowest point.
Finally, measure the distance from the 38.2% level to the lowest point. That’s the stop-loss for the long trade or the risk. By projecting the risk three times from the entry-level, you find out the reward for a risk-reward ratio of 1:3.
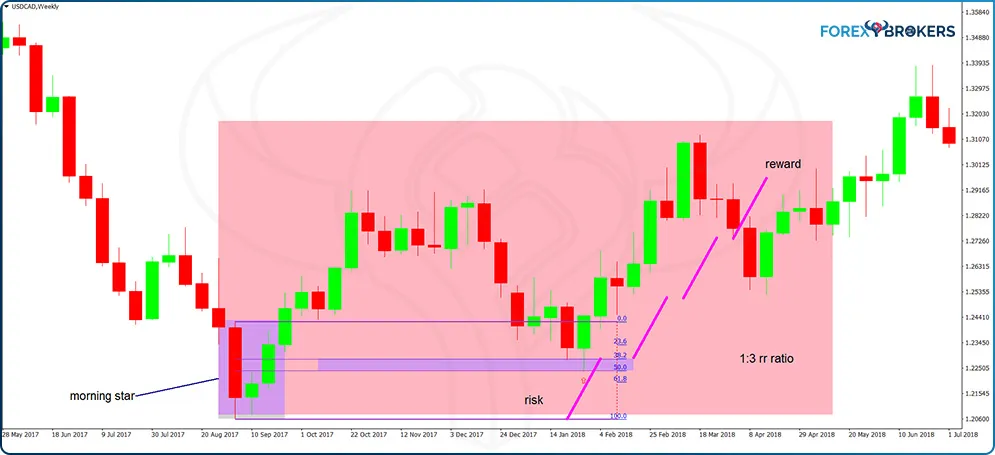
The chart above shows how the USDCAD pair reacted after the formation of a morning star on the weekly timeframe. Note a difference when compared with the previous setups described in this article – the entry on the long side comes after some time. More than eighteen candlesticks close before the market retraces to the entry area.
As a rule of thumb, this is allowed as long as the risk-reward ratio of 1:3 is not reached in the meantime. For instance, if before reaching the entry level, the market had traveled the 1:3 distance, the trade should be skipped. Because it hadn’t, it offered a great entry on the long side and, due to the big timeframe, a perspective on the USD general bullishness.
Conclusion
The Japanese candlestick patterns conquered the world due to their simplicity and the short time required to form. This article demonstrated that the reversal patterns part of the Japanese candlestick techniques are responsible for solid risk-reward ratios.
Other patterns besides the ones described here do exist. However, they have some limitations when applied on the currency market. For instance, many consider the gap between candlesticks as a decisive factor in interpreting the pattern. Or, in the currency market, gaps aren’t that common during the trading week. If anything, you’ll end up seeing a gap during the weekend, and even then, not that often.
The hammer pattern deserves special attention. A full article with plenty of examples will cover the theme in detail.
The ideal use of the candlestick patterns is in conjunction with the classic technical analysis patterns. For instance, imagine trading a double bottom, and the second bottom shows a morning star pattern. In this case, the Japanese pattern reinforces the double bottom. The opposite is true as well – the morning star forming as the second bottom in the double bottom pattern reinforces the reversal potential and traders enter more aggressively on the market.
Summing up, candlestick charts increased in popularity, mainly due to the power of Japanese patterns to predict future prices. In the end, it doesn’t matter if the market forms a strong trend or not, if the 1:3 risk-reward ratio works. This way, the emotions of trading the currency market disappear, and the trader can focus entirely on finding the right setups.