
721
The Elliott Waves Theory remains one of the most comprehensive trading theories ever created. Almost a hundred years after it was developed by Ralph Elliott, it is still widely used by retail and professional traders alike.
Technical analysis can no longer be ignored, even by the professional investing community. To many, forecasting future prices based on historical price data sounds like gambling, but the investing community has learned to appreciate the power of technical analysis.
Financial markets are believed to have 3 forms – weak, semi-strong and strong form efficient. According to the market efficiency principles, it is impossible to gain abnormal returns using technical analysis in developed economies. It may work in emerging, developing or emerging markets, but not in developed ones.
Yet, the reality shows impressive gains on the back of technical analysis. The currency market is so large and the various currencies reflect the strength of different economies that a simple distinction between economies is difficult to make. For this reason, technical analysis is an integrated part of financial education, with a growing role in portfolio management’s decision-making process.
This is not the first article dedicated to the Elliott Waves Theory that is part of this academy. And it won’t be the last one.
While initially, the Elliott concepts appear simplistic, things become more complex the more the trader tries to incorporate the knowledge. This article covers everything there is to know about impulsive waves. As the reader will find out, there is more to know about classic impulsive waves than just the fact that they are a 5-wave structure. Also, the article focuses only on the classic impulsive waves, not the terminal ones, which will be covered in other parts of this trading academy.
Elliott Waves - A Detailed Look at Impulsive Waves
Multiple types of impulsive waves exist and this trading academy covered them all in a previous article in the Rookie section. We have looked at the 3rd-wave, 1st-wave, and 5th-wave extensions and discussed the necessity of knowing which wave extends.
However, this article goes beyond the various types of impulsive waves and deals with some other things to consider when trading impulsive waves. As is customary in this trading academy, we will use examples and charts to illustrate the concepts so that the explanations make sense to the reader. Finally, in the article's last part, we will apply the theoretical concepts to an example in the currency market, the EURJPY currency pair.
Our example will involve only the 3rd-wave extension impulsive move for the simple reason that such an impulsive waveform occurs more often. However, the rules mentioned here also apply to the first- and fifth-wave extensions.
All Elliott Waves fans are familiar with the concept of a 5-wave structure. The basic distinction between different waves made by Elliott was a separation between impulsive and corrective waves. Impulsive waves, therefore, are 5-wave structures, while corrective waves are 3-wave structures.

An impulsive wave or a 5-wave structure is made of, you guessed 5 segments. All impulsive waves, classic or terminal, are labeled with numbers. Therefore, whenever you see that the Elliott analyst uses numbers to label a market move, think of an impulsive wave structure.
Out of the 5 waves, 2 are corrective – the second and the fourth ones. Their interpretation is key in understanding the entire 5-wave structure, as they are an integral part of the impulsive wave.
Classic and Terminal Impulsive Waves of a Lower Degree
One of the first things to consider in interpreting an impulsive wave is the nature of the waves of a lower degree. As mentioned earlier, 2 of those waves, the second and the fourth ones, are corrective. Implicitly, the other 3 are impulsive.
Classic and terminal impulsive waves have numerous differences. For example, all the segments of a terminal impulsive wave are corrective despite numbers being used to label them.
Another distinction is that the price action that follows a terminal impulsive wave is mandatory to fully retrace the pattern. There is also a time requirement for the retracement, but more details will be discussed in a dedicated article.
For now, the Elliott trader should be aware of the fact that any impulsive wave has 3 impulsive waves of a lower degree – the first, the third, and the fifth. Of those, only the fifth wave can also be a terminal impulsive wave.

To wrap up this part – the first and third segments must be classic impulsive waves of a lower degree in a classic impulsive wave. Also, the fifth wave can be either a classic or a terminal impulsive wave of a lower degree.
The Role of Corrective Waves Part of Impulsive Structures
In any impulsive wave, there are 2 corrective segments. They are the most difficult to trade and interpret, and, more often, they are the most time-consuming segments of the entire impulsive structure.
Time is important to analyze and interpret when trading with the Elliott Waves Theory. The theory is one of the few that incorporates the time element and uses it as a confirmation that the wave count is correct. The 2 corrective waves part of an impulsive move must be different in at least one way – price, complexity, time, or construction. In classic technical analysis, long periods of consolidation are called ranges. These ranges are corrective waves in the Elliott Waves Theory, and in an impulsive wave, they form as the second or fourth segments.

In other words, the 2 corrective waves must respect the so-called principle of alternation. If they are equal in all 4 aspects, the impulsive wave is incorrectly labeled.
Price refers to the distance traveled from the start to the lowest/highest point in the corrective wave. Complexity refers to the type of the corrective wave – simple or complex, horizontal or running, against the main trend, etc. Time refers to how long it took the corrective waves to form. If, for example, the second wave took a lot of time to consolidate, then the principle of alternation favors a very short period for the fourth wave’s consolidation.
No Overlapping Allowed
In an impulsive wave, overlapping refers to the corrective waves only. Put simply, the second and the fourth waves cannot overlap in a classic impulsive wave. They must overlap in a terminal impulsive wave but not in a classical one.
But there is a catch, a common error that Elliott traders make. There is a strong tendency for traders to consider only the start and the end of the corrective waves. Instead, they should consider the highest and the lowest price level reached.

Consider the chart above. Overlapping refers to the highest price level reached during the second wave and the lowest price level reached during the fourth wave’s formation. It does not refer to the start and end of the waves only.
Many corrective waves, even though bearish, may print higher price levels than the start of the correction. In other words, the second wave in the picture above might be flat with a strong b-wave. In this case, the b-wave fully retraces the a-wave, meaning that some parts of the b-wave will reach price levels higher than the end of the first wave. Hence, those are the price levels to consider when interpreting overlapping. Naturally, the same is valid for the fourth wave in an impulsive structure.
To wrap up this part, when interpreting overlapping in a bullish impulsive wave, simply look for the highest price level reached by the second wave and the lowest one reached by the fourth wave. They should not overlap; otherwise, the entire 5-wave structure would not be a classic impulsive wave.
First Wave Sets the Invalidation Level
A very important concept of any impulsive wave, both classic and terminal, refers to the inability of the second wave to fully retrace the first wave. No matter the structure of the first wave, the second wave should not retrace beyond the start of the overall impulsive wave.
This rule is the one that leads to the most popular trading setup among Elliott Waves traders. Because the third wave is the one that extends most of the time, traders buy the dip in the second wave in anticipation of the extended one.

Typically, the second wave retraces between 50% and 61.8% of the first wave –the entry area for trade on the long side. Because the second wave cannot retrace beyond the start of the impulsive structure, that is the invalidation level. With such a small risk, the reward exceeds it multiple times, giving birth to a handsome risk-reward ratio because traders target the end of the extended third wave.
Understanding the Extended Wave
In any impulsive wave, 1 wave must extend. The extension is calculated by using a Fibonacci ratio – of 161.8%. This is the minimum distance that the market should travel under the extended wave.
However, the difficulty appears because traders mistakenly apply the extension to the wrong wave. In the case of a third-wave extension, the distance the third wave should travel is calculated based on the first wave’s length. Which is absolutely correct, considering that at that point in time, the length of the fifth is literally unknown.
But if, in the end, the fifth wave is longer than the first wave, traders must double-check that the overall impulsive wave did extend. This is mandatory because the extended wave must be bigger than 161.8% when compared to the next longest wave. As such, to check the extension rule, traders must do the following.
First, measure the length of the first and the fifth waves. Second, choose the longest of the 2 and determine the 161.8% distance. Finally, project the distance from the end of the third wave and check if the third wave is longer. If it is, the impulsive wave has 1 extension. If it is not, the entire market structure is not impulsive.

Not only the third wave extends. As is often the case, impulsive waves also have first-wave or fifth-wave extensions. In these cases, the rule is the same – find out the longest of the other motive waves, calculate the 161.8% distance and see if an extension exists.
One final thought on this section is that 161.8% is the minimum distance the market should travel. In some cases, the market travels much more than this minimum distance, as we will also see in the example that comes in the last part of this article.
The Rule of Equality Using Price
The following 2 sections of this article refer to the other 2 motive waves except the extended one. In other words, in a third-wave extension, the rule of equality refers to the other 2 motive waves – the first and the fifth.
Naturally, this rule is applied retroactively, meaning that we use the rule of equality to double-check the entire impulsive wave. The condition is important because otherwise, the entire impulsive wave is invalidated, even if all the other rules, such as the minimum extension, are respected.
The rule of equality in price says that the 2 motive waves that do not extend must be different. In other words, if you see an impulsive wave with a third-wave extension and the fifth and the first waves equal in price, the impulsive structure is invalid.

The 2 other motive waves must differ, and their length should respect some Fibonacci proportions. More precisely, the length of the 2 waves must relate to the 61.8%–161.8% ratio.
In other words, the trader must first check the length of the first wave. Next, using a Fibonacci retracement tool, the trader finds the 61.8% retracement level. Typically, that should be the length of the fifth wave.
If the fifth wave is much longer, it must be 161.8% when compared to the first wave’s length. In this case, to check the extension of the overall impulsive wave, traders must measure the fifth wave, find the 161.8% extension and project it over the third wave, which must be longer than the projected distance.
As mentioned earlier, if the rule of equality in price is not respected, the entire impulsive move should be ignored. In fact, it is a confirmation that the market did not form an impulsive but a corrective wave.
The Rule of Equality Using Time
While the rule of equality in price changes the optic of an impulsive structure, it is not enough for an impulsive wave. The analysis of an impulsive wave continues with the time element.
Time is an important factor in the Elliott Waves Theory. Few other trading theories or patterns use the time element – but the Elliott Waves Theory does so extensively.
For the rule of equality in price, we need to check the 2 other motive waves and see if they respect the 61.8%–161.8% proportion. In the case of the time rule, we add one more level to the analysis – the 100% level.

In other words, when using the time element to check the rule of equality, the other 2 motive waves must relate by 61.8%, 100%, or 161.8% in time. How do we go about it?
First, use a shape on the trading platform and mark the territory of the first wave. Or, simply count the candlesticks or the periods part of the first wave.
Second, find out 61.8% and 161.8% of that time. Finally, project the 3 shapes from the start of the fifth wave. This way, you will already know the approximate price length of the fifth wave, but also the approximate time when the fifth wave must end. Any other combination of the time element would invalidate the overall impulsive structure.
Understanding Waves of a Larger Degree
The numerous rules for interpreting impulsive waves may discourage the wannabe Elliott Waves trader. However, the most difficult part is interpreting the overall picture, rather than just 1 impulsive wave.
The First Wave of a Larger Degree
An impulsive wave may be part of different structures of a larger degree. One of the possibilities is that the impulsive wave is the first wave of an impulsive move of a larger degree.

In this case, traders expect a correction for the second wave, preparing to go long at important Fibonacci ratios, such as the 38.2% or 61.8% levels. At this point, the Elliott trader does not know if the market forms a third-wave extension or not, so aggressive traders will already start buying when the second wave retraces to the 38.2% area.
The Third Wave of a Larger Degree
Another possibility is that the impulsive wave is the third wave of an impulsive wave. If the third wave is the longest in the structure, it must be longer than 161.8% when compared to the other 2 motive waves. If the third wave is not the longest one, it must not be the shortest.

The retracement level that follows an impulsive wave, the third wave of a larger degree, should not exceed 38.2% of the entire 5-wave structure. However, trading the pullback is difficult because of the challenges of finding out the end of the next bullish move. In any case, if the trader anticipates a fourth wave followed by a fifth one, the last segment will make a new high most of the time.
The Fifth Wave of a Larger Degree
Very often, the fifth wave of an impulsive structure is also a classic impulsive wave on its own. When this happens, traders expect a temporary top and a more pronounced retracement.
One thing to remember when trading the fifth wave of an impulsive move is that the pullback is typically more aggressive than the move higher. Also, the price action typically makes a new higher high, and the following pullback almost always fully retraces the entire fifth wave.

Wave A of a Zigzag
A zigzag is a corrective pattern labeled with letters – a-b-c. In a zigzag, both waves a and c are impulsive, while wave b is corrective.
Therefore, one possibility when counting waves with the Elliott Waves Theory is that the market forms a 5-wave structure as wave a of a zigzag. Such a scenario is difficult to interpret, but traders should find some clues that might help in the previous price action. As such, if the price action prior to the impulsive wave is impulsive as well, it means that the corrective wave that started might be a zigzag because it started with another impulsive wave.

Wave C of a Zigzag or a Flat
Finally, the 2 other possibilities for a classic impulsive wave are the wave c of a zigzag or a flat pattern. If the impulsive wave is the wave c of a zigzag, traders should again use the time element to confirm the zigzag.
The following simple steps help. First, measure the time it took for wave a to form. For this, using a shape offered by the trading platform might come in handy.
Second, project the time element over the c-wave. In a zigzag pattern, the c-wave’s time should be approximately equal to wave a’s time. If not, the market does not form a zigzag.

In the case of a flat, wave c is the only impulsive wave of the a-b-c structure. Hence, the focus here should be on ensuring that waves a and b are corrective, and only then apply the rules of a classic impulsive wave to wave c.
The price action that follows the wave c of a flat is quite powerful. It represents either the start of an impulsive wave of a larger degree or the beginning of an intermediary wave, known as the x-wave. In both cases, the market moves fast after the impulsive wave ends.
The Importance of the 0-2 Trendline
One defining element of any impulsive wave is the 0-2 trendline. Effectively, this trendline is drawn from the start of the impulsive wave to the end of the second wave and then projected forward on the right side of the chart.
The Elliott rule says that no parts of the first or the third wave should pierce this trendline. Careful here because many times, especially in the FX markets, the price action seen in the second wave does pierce the 0-2 trendline, but that is allowed.

The break of the 0-2 trendline by any parts of the first or the third wave is enough to invalidate the entire impulsive wave structure. It does not matter anymore if all the rules presented in this article are respected – the simple piercing of the 0-2 trendline invalidates the entire 5-wave structure.
The Importance of the 2-4 Trendline
Another trendline to consider when interpreting impulsive market activity is the 2-4 trendline. This trendline is drawn from the end of the second wave to the end of the fourth wave and then projected on the right side of the chart.
One caveat – please consider the end of the corrective waves and not the lowest points. If, for example, the corrective waves end with a triangle, as is often the case, then the end of the triangular formation is the point where the trendline crosses.
In the case of the 2-4 trendline, no parts of the third wave are allowed to pierce it. Remember that in an impulsive wave, the third wave should not be the shortest and must be an impulsive wave on its own.
Hence, the third wave also has 2 corrective waves, the second and the fourth ones, but of a lower degree. The idea here is that the market pullbacks during these 2 corrections should not pierce the trendline that connects the end of the 2 corrective waves of a larger degree.

Another use of the 2-4 trendline is to validate the entire 5-wave structure. The fifth wave in an impulsive structure should not pierce the 2-4 trendline unless the fifth wave is a terminal impulsive wave.
If the fifth wave is a classic impulsive wave, when the price action pierces the 2-4 trendline, it has 2 implications for the Elliott analysis. One is that the fifth wave ended. Another is that the entire impulsive wave ended.
As is often the case, the price action that follows a classic impulsive wave almost always fully retraces the fifth wave. Effectively, it means that the price action falls below the end of the fourth wave, and this is a trade many Elliott analysts prefer to take. That is, to go short on the 2-4 trendline break, have a stop at the highest point in the fifth wave and target the end of the fourth wave as the take profit level.
Finally, the 2-4 trendline must be broken in less time than it took the fifth wave to form. Once again, the time element is discussed and validates or invalidates the price action.
Analyzing an Impulsive Wave on the EURJPY Currency Pair
The final part of this article is dedicated to applying the rules for trading an impulsive wave to an actual currency pair. The weekly EURJPY chart shows the price action from below $100 in 2012 to over $145 at the start of 2015.

The aim is to check if the 5-wave structure seen below and marked with the blue rectangle is an impulsive wave. If it respects all the rules in this article, we can confidently say that the move higher is a classic impulsive structure. After that, the Elliott Waves analyst’s job is to interpret the cycles of various degrees to integrate the impulsive wave into a top/down analysis.
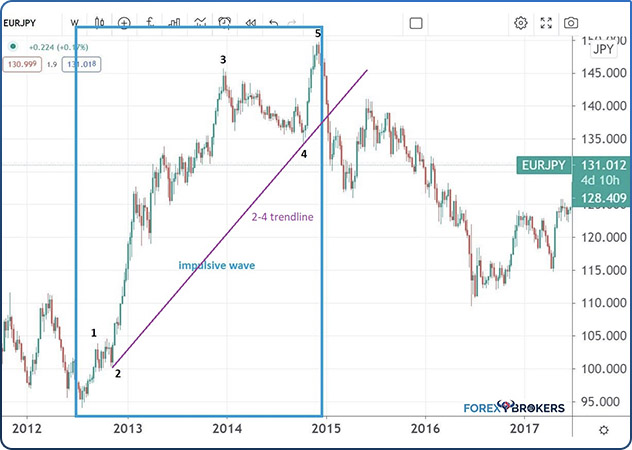
The starting point is determining the type of impulsive wave the market formed. We notice that the third wave is much longer than the other 2 motive waves, so the Elliott Waves analysts work with the rules of a third-wave extension.
Remember that the extension refers to 161.8% applied to the next longest wave between the 2 motive waves. Therefore, we need to measure the lengths of the first and the fifth waves and compare them. We see that the fifth wave is much longer than the first wave, so we must find out the 161.8% projection and compare the outcome with the third wave. Because the third wave is much longer than 161.8% of the fifth wave’s length, the third wave is extended.
Another Elliott rule is that the third wave must be a classic impulsive wave and must not be the shortest in the structure. Also, the 2 corrective waves must differ so that the impulsive structure respects the principle of alternation. We see that the second wave is shorter in time than the fourth wave, and so at least one condition is respected. There is no overlapping between the 2 corrective waves either.
Checking the Rule of Equality in Price
The next thing to check is the rule of equality. We start with equality in price between the 2 non-extended but motive waves.
The rule says they must respect the Fibonacci proportion of 61.8%–161.8%. To make sure the rule is respected, first measure the first wave’s length. Next, find out 161.8% out of it. Finally, project it over the fifth wave. If we do so, we see that the fifth wave is approximately equal to the 161.8% projection of the first wave, so the rule of equality in price is respected.

Checking the Rule of Equality in Time
Equality in price alone is not enough for the entire 5-wave structure to be declared an impulsive wave. Besides equality in price, the 2 non-extended waves must also respect the equality in time.
Time equality assumes that the 2 motive waves take the same time to complete or alternate using the same 61.8%–161.8% proportion. The easiest way to check the time equality rule is to count the number of candlesticks in the first wave and compare it with the number of candlesticks in the fifth wave.
By doing so, we see that the first wave took 7 candlesticks or 7 weeks to form, and so did the fifth wave. Hence, the rule of equality in time is respected as well, so we have a green light to continue our analysis of the impulsive structure.

Checking the 0-2 Trendline
It is time now to check the 0-2 trendline and ensure that no parts of the first or the third wave pierce the trendline. Any piercing would invalidate the impulsive wave, but the price action evolves only above the 0-2 trendline, confirming the impulsive wave.

Checking the 2-4 Trendline
Finally, we must interpret the 2-4 trendline and the price action in the third and the fifth waves. No parts of the third wave should pierce this trendline. Also, when the price action following the fifth wave breaks below the 2-4 trendline, it means that the fifth wave ended and the entire impulsive wave ended.
We see below that the 2-4 trendline is clean, as neither the third nor the fifth waves pierce it. However, when the price breaks below the 2-4 trendline, it does not stop all the way until it fully retraces the fifth wave, in line with what the Elliott Waves traders expect after the end of an impulsive wave.

Check out our video about Rules when trading with Impulsive waves:
Rules for Profitable Forex Trading with Impulsive Waves Pattern – ForexBrokers.net
Intermediate
Rules for Profitable Forex Trading with Impulsive Waves Pattern – ForexBrokers.net
Conclusion
Impulsive waves are 5-wave structures labeled with numbers. But behind the 1-2-3-4-5 count, a complex analysis confirms the pattern. As this article made clear, it is no easy task to interpret an impulsive structure.
The analysis uses trendlines, Fibonacci proportions, and, more importantly, the time element. Using the time element is a common practice in advanced Elliott Waves analyses as it is the defining element in proper labeling.
Impulsive waves have at least one extension, meaning that one wave must stand out from the crowd. We have used a third-wave example throughout this article, but the same rules discussed here apply to a first-wave extension as well as to a fifth-wave one.
In terms of the most common impulsive wave, the third-wave extension forms most of the time. In the second place, we have the first-wave extension, and the fifth-wave extension is the least common one.
With this article, we have covered everything there is to know about classic impulsive waves with the Elliott Waves Theory. The trader should be aware of the fact that the Elliott Waves Theory is complex and that this trading academy covers the subject in different articles and videos trying to explain the concepts thoroughly.
Besides classic impulsive waves, Ralph Elliott introduced terminal impulsive structures, too. These are 5-wave structures as well, still labeled with numbers, but each wave is corrective, not impulsive. More on terminal impulsive waves will appear in future articles part of this trading academy.
Related Lessons


See more from this category