LISTEN TO THIS ARTICLE:
A zigzag is a corrective structure part of the Elliott Waves Theory. A zigzag is the most deceiving of all the simple corrective waves and often leads to rookie mistakes.
Elliott classified market moves into impulsive and corrective. Traders use numbers to label the former, while they use letters for corrective waves.
As a corrective wave, several types of zigzag have three segments. Also called a “three,” it is labeled a-b-c. What makes a zigzag interesting and deceiving to many traders is that two of its waves are impulsive, and only one is corrective. Because of that, when the market forms a zigzag, the impression is that it forms an impulsive wave of a larger degree and not a corrective structure.
Elliott described three simple corrective waves: zigzags, flats, and triangles. Of the three patterns, only a zigzag has two impulsive waves (wave a and wave b). A flat, while labeled similarly, a-b-c, has only one impulsive wave (wave c). As for the triangle, it has no impulsive segment – all five of its segments are corrective (a-b-c-d-e).
For this reason, it is exceedingly difficult to mistake the segments of a triangle or a flat for an impulsive structure. However, it is fairly easy to do so in the case of a zigzag.
Moreover, if a zigzag forms on a big enough timeframe, traders tend to focus more on the two impulsive segments than the b-wave. Because the b-wave tends to be small in price and time, it is often mistaken as the second or fourth wave in an impulsive structure.
What Makes a Zigzag
A zigzag is a three-wave structure labeled with letters with two impulsive waves – waves a and c. Moreover, the c-wave must end beyond the end of the a-wave, and the b-wave cannot end beyond 61.8% of wave a’s retracement.
A zigzag forms often on the currency market. Most of the time, traders using the Elliott Waves Theory to trade the markets will mistakenly label a zigzag as an impulsive wave. Instead of a-b-c, the tendency is to label 1-2-3, as both the first and the third segments are impulsive in a zigzag and an impulsive wave.
For this reason, the main purpose of this article is to differentiate between impulsive waves and zigzags to avoid one of the most common mistakes made by rookie traders. This article presents plenty of examples but also the theoretical background behind zigzags. Furthermore, the five videos accompanying this article are meant to provide as many details as possible to describe the types of zigzags for their full understanding.
In a zigzag, there is only one corrective wave – the b-wave. It is mandatory for the b-wave to retrace into the territory of the previous wave a by at least 1%. However, ending in wave a’s territory is not mandatory, even though this almost always happens. Elliotticians should not rule out the possibility that the b-wave forms a running correction (i.e., ends above the end of the a-wave in a rising zigzag or below it in a falling b-wave).
Besides the rules listed above, the most distinctive element that characterizes zigzags is the time equality between the two impulsive waves. This is what makes the difference between a zigzag and an impulsive wave. Hence, following this simple rule helps traders avoid labeling zigzags as impulsive structures.
Types of Zigzags
There are three types of zigzags – truncated, normal, and elongated. All of them must respect all the rules of a zigzag, as explained above and also on the chart below.
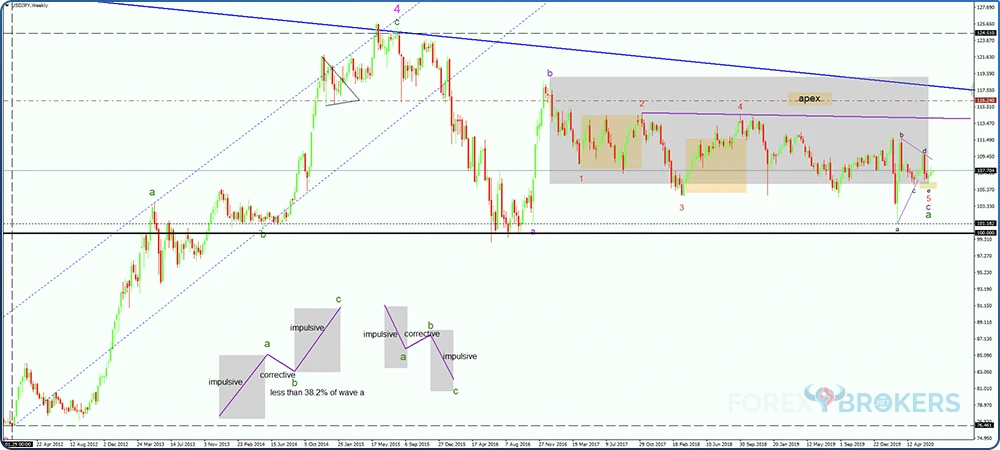
Focus on the lower part of the chart and, for now, ignore the Elliott Waves count that appears there. The two zigzags shown at the bottom of the chart illustrate the one element that makes the distinction between an impulsive wave and a zigzag – the time element.
Therefore, to correctly interpret a zigzag, consider the following steps. First, make sure the b-wave does not retrace more than 61.8% of wave a. Rarely does it exceed 38.2%, so that should be quite obvious from the first look.
Second, use a shape provided by the trading platform to measure the time it took the a-wave to form. Click and drag it from the start of the a-wave to the end of it.
Next, copy it by selecting it with the mouse, press the CTRL key, and then select it again. Finally, drag it from the end of the b-wave.
This way, you will have an educated guess regarding when the c-wave ends. As for the type of zigzag, the c-wave is responsible for it – its length gives the three types of zigzags.
If the c-wave is less than 61.8% of wave a, it is said that the market forms a truncated zigzag. When the c-wave’s length is between 61.8% and 161.8% of wave a, the market forms a normal zigzag. Finally, if the c-wave is longer than 161.8% of the a-wave, the market forms an elongated zigzag.
Where Does a Terminal Impulsive Wave Fit?
One more thing before we move on – all three types of zigzags must respect the time equality between wave a and b. Without this condition in place, the market does not form a zigzag.
That is a mandatory condition even if the market forms a terminal impulsive wave (i.e., a pattern with five segments, but all of them are corrective and the price action fully retraces it afterward). But the terminal impulsive wave can only form as the c-wave of a zigzag and never as the a-wave.
One thing to keep in mind is that if the market forms a classic impulsive move for the c-wave, as it almost always does, the impulsive wave ends at the highs (in a bullish zigzag) or the lows (in a bearish one). However, if it forms a terminal impulsive wave as the c-wave of a zigzag, it is unlikely that the zigzag will end at the highs (in a bullish zigzag) or lows (in a bearish one).
Truncated Zigzag
As mentioned earlier, the type of a zigzag is given by its c-wave’s length. Depending where the c-wave ends in relation to the length of the a-wave, the market forms a different type of zigzag.
The c-wave of a truncated zigzag is the shortest one in all zigzag patterns. It must be less than 61.8% of wave a, but simultaneously, it must end beyond wave a. If the zigzag is a bullish pattern, the c-wave must end above the end of the a-wave. On the contrary, if the zigzag is a bearish pattern, the c-wave must end below the end of wave a.
Pay attention to the time element. Despite the c-wave being much shorter than wave a, it does not mean that the trader should discount the time element. The equality, in time, of the two waves remains the key element that defines a zigzag.
A truncated zigzag is a powerful pattern. When it forms, the price action that follows must retrace it by at least 80%. In other words, traders should use a Fibonacci retracement tool and edit it to find the 80% level and set the target for the price retracement. But more is needed.
Most of the time, the price following a truncated zigzag pattern retraces the zigzag completely. A 100% retracement is often possible after a truncated zigzag form.
The chart above shows the theoretical conditions for a truncated zigzag – just like this article explained. However, by explaining the component of a truncated zigzag on the lower right side of the chart, the video reveals some additional tips and tricks to use when trading a truncated zigzag.
EURUSD Example of a Truncated Zigzag
Below is an example of a truncated zigzag recently formed on the EURUSD pair. Recently, we refer to the period after Trump’s election in 2016, when the EURUSD hit 1.13 before heading to 1.03. From that moment on, it formed a triangle at the end of a terminal impulsive pattern, and the truncated zigzag started with Macron’s election in France.
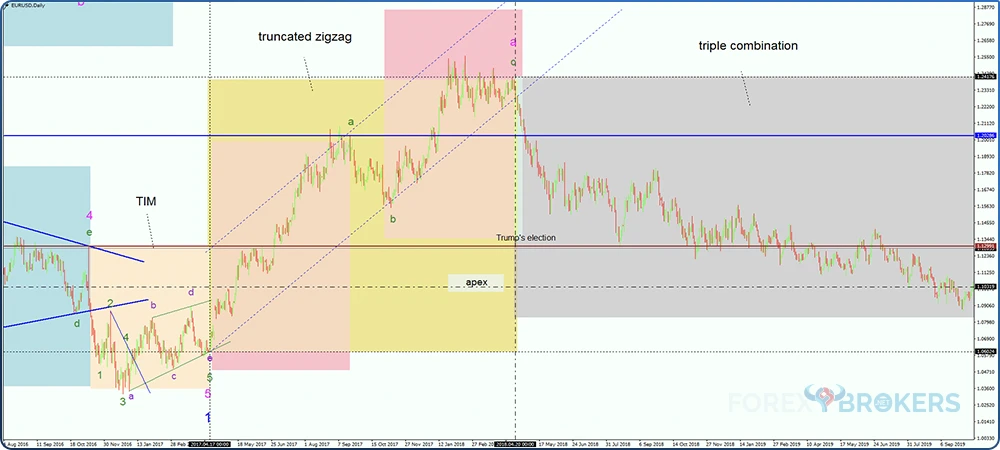
Once again, the chart emphasizes the time element. From then, it becomes evident that the b-wave cannot retrace beyond 38.2%, a zigzag scenario comes to mind. In any case, the Elliott trader should have already noted an impulsive wave structure for wave a. Coupled with the small retracement for the b-wave, a zigzag is a logical pattern to watch for.
However, at that point, it is not clear what kind of zigzag the market will form – normal, truncated, or elongated. How to find out?
The only way to find out is to measure the time it took wave a to form and project it from the end of the b-wave. Next, wait for the price to come close to the time expiration. Finally, measure the c-wave’s length using a Fibonacci retracement and compare it with the a-wave’s length. If the c-wave is shorter than 61.8% of the a-wave, the market forms a truncated zigzag.
One of the videos accompanying this article offers more details of this truncated zigzag that formed on the EURUSD chart. It reveals that the c-wave is actually a terminal impulsive wave, and the way to measure it differs from the way to measure a classic impulsive move. This is key to drawing the conclusion that the market formed a truncated zigzag and is the reason why the price is expected to retrace a minimum 80% of the entire a-b-c.
Normal Zigzag
A normal zigzag is a pattern that has almost equal lengths for waves a and c. In a normal zigzag, the only condition is that the c-wave must exceed 61.8% of wave a, but not more than 161.8% of it. On top of that, the time for the two impulsive waves must be equal as well.
A normal zigzag is by far the most common type of zigzag that one finds on the charts. Suppose we are to use percentages to illustrate how often the different types of zigzags appear. In that case, the normal zigzag will exceed 80%, the truncated zigzag 15%, and the rest belongs to the elongated zigzag.
In other words, if you see a zigzag on a chart, there is a particularly good chance that the market will form a normal zigzag rather than a truncated one. Such a zigzag appears in all possible places where a zigzag may form – as a simple correction as the a-wave of a flat, as part of a complex correction as either the a-wave or the b-wave of a flat, as a leg of a contracting triangle or part of a leg of a contracting triangle, and so on. Basically, whenever you expect a corrective wave, expect the possibility of a normal zigzag to form.
Elongated Zigzag
An elongated zigzag is a special type of zigzag that has the longest segment, the c-wave. More precisely, the c-wave must extend more than 161.8% of wave a, and, at the same time, it must respect the time equality rule between the two impulsive waves.
Such a zigzag appears with predilection in terminal impulsive structures and triangles. Between the two possibilities, the most frequent place to find an elongated zigzag is the entire leg of a contracting triangle or just part of a leg of a contracting triangle.
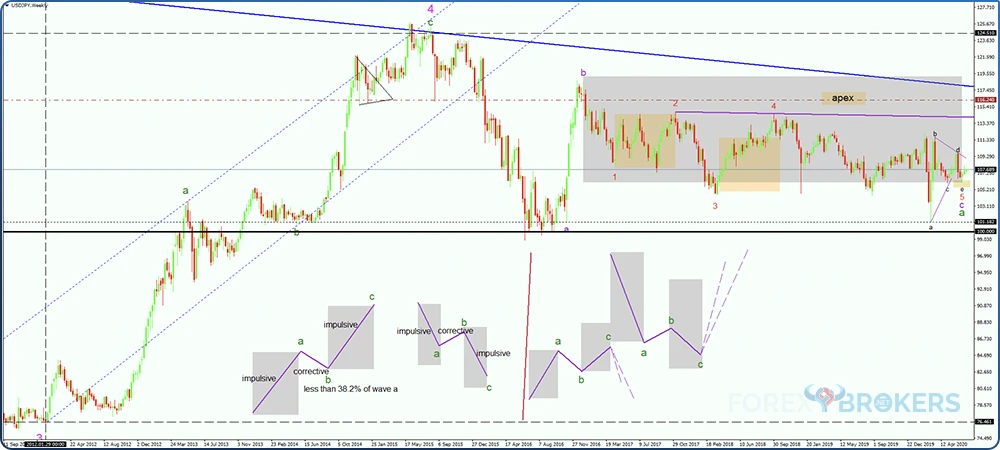
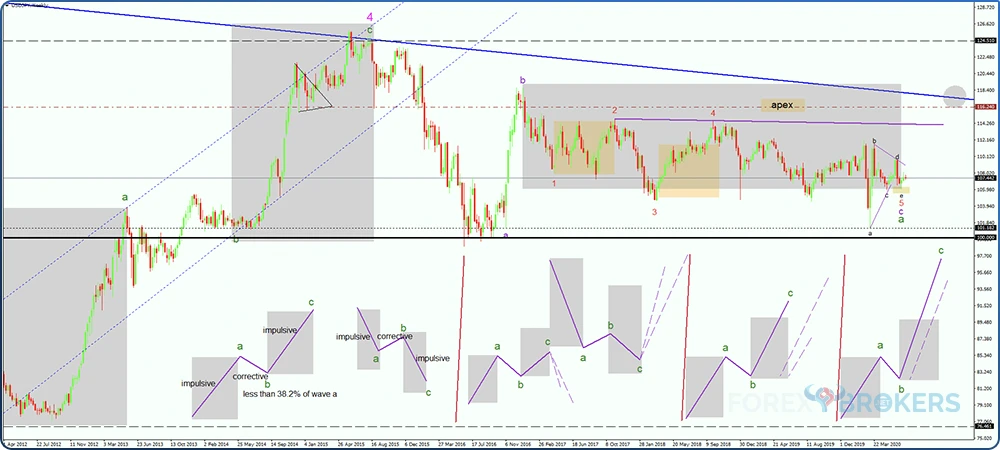
The lower part of the chart below shows the conditions for a zigzag and the three types of zigzags explained so far in this article. The time equality between the two impulsive waves is the one thing that strikes the eye, followed by the b-wave shallow retracement into the territory of the previous a-wave.
Zigzags in Simple Corrections
Simple corrections are zigzags, triangles or flat patterns. In the case of zigzags and flats, simple corrections must be confirmed by the price action that follows after the correction.
For example, imagine a zigzag forming as the b-wave of a flat pattern. In order for the Elliott Waves trader to say that the zigzag is a simple correction, the price action that follows after the zigzag’s formation must fully retrace the c-wave in less than the time it took the c-wave to form. Only with this condition in place can we say the zigzag is a simple correction.
As simple corrections, zigzags may appear in the following places with the Elliott Waves Theory:
- Waves a, b, c, and d of a triangle:
- Rarely does the e-wave of a triangle form a zigzag – a triangle of a lower degree appears more often.
- Wave a of a flat.
- Wave b of a flat.
- Wave b of a zigzag.
- Wave 1, 3, or 5 of a terminal impulsive wave.
- All segments of a terminal impulsive wave are corrective in nature, so, in theory, a zigzag may also appear as the second wave or the fourth wave. However, these two waves are time-consuming, meaning that it is unlikely for a zigzag to appear there.
Of all the situations presented above, a zigzag is most likely to appear as a simple correction when it forms the a-wave or the b-wave of a flat.
Zigzags in Complex Corrections
A complex correction is a combination of various simple corrective waves connected by one or two intervening waves. Therefore, when we think of complex corrections, we must think of zigzags, flats or triangles connected by x-waves.
Elliott found that the maximum number of simple corrections that can be connected is three. Therefore, throughout the Elliott Waves Theory, a triple combination or a triple flat or zigzag are the most complex corrections.
As a rule of thumb, a triangle cannot start a complex correction, which leaves us with the zigzag or flat pattern at the start of such corrections.
A zigzag, therefore, may appear as the first correction part of a complex one or even the second or the third one. However, a zigzag rarely appears at the end of a double or triple combination (triangles usually form there).
Part of complex corrections, zigzags may appear as:
- The first corrective part of a double combination.
- Any corrective segment of a double or triple zigzag.
- The last corrective part of a double combination, if the double combination starts with a flat.
- The first corrective part of a triple combination.
- The second corrective phase of a triple combination.
The complex corrections of the Elliott Waves Theory are often viewed as the most difficult ones to interpret by Elliotticians. The secret of getting to the bottom of such corrections is to take each corrective wave and treat it individually, ensuring the rules are respected.
Examples of Zigzags on the Currency Market
So far, we have looked into the different types of zigzags, their implications for the overall Elliott count, and where zigzags may appear. Zigzags form very often, especially the normal ones.
The second part of this article contains some practical examples from the currency market. By no means are these concrete examples of when to buy or sell. They are just examples of Elliott Waves counts with at least one zigzag in their composition and often include the current price action.
EURUSD – Zigzag as the First Corrective Phase of a Double Combination
The first example to discuss belongs to the EURUSD pair. The market dropped from 1.24 all the way to 1.06 area at the end of 2019 start of 2020. The move lower, despite its amplitude, is not impulsive. An impulsive count is impossible because there is no extended wave nor a clear five-wave structure.
As such, the only option we have is to look at this drop as a corrective structure. From left to right, the analysis begins with the first market drop – the move marked with the grey area.
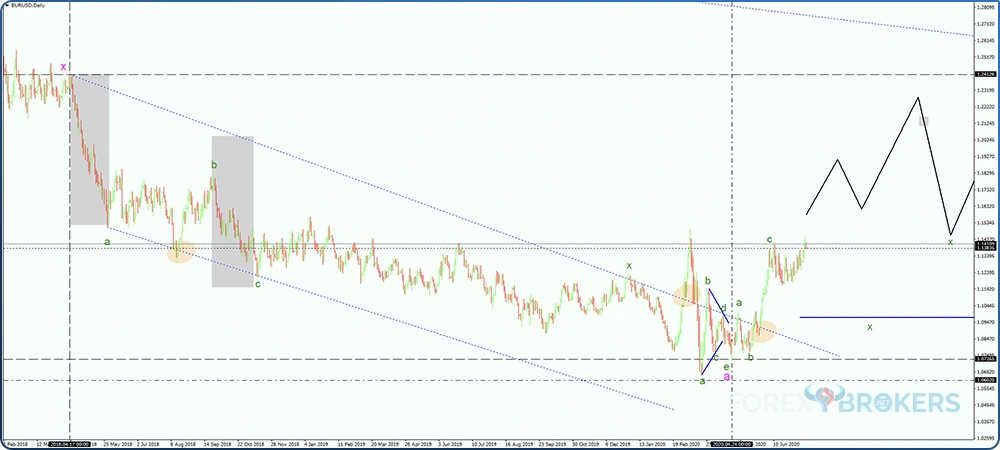
Even if we do not count a five-wave structure of a lower degree, the price action must be impulsive. The explanation comes from the fact that no market bounce bigger than 61.8% followed the move lower.
Remember, the b-wave must not retrace more than 61.8% of the first wave a in a zigzag. Moreover, it rarely exceeds 38.2%. Or, if we say that the move is not impulsive but corrective, and the b-wave did not retrace more than 61.8%, it means that the first a and b belong to a zigzag. Is it possible for the market to form a triangle? The answer is no, because no complex correction begins with a triangle.
The next thing to determine is where the c-wave of the zigzag starts. We must find a way so that the c-wave’s time element is equal to the time it took wave a to form. This way, the rule of equality between waves a and c of a zigzag is respected.
The Intervening Wave
After the time element expires on the c-wave (i.e., the second grey area in the chart above), we know that the impulsive wave ended for the c-wave. Also, the zigzag ended.
The next step is to determine what kind of zigzag the market formed – truncated, normal, or elongated. To do so, traders should use the Fibonacci retracement tool and measure 61.8% of the first market drop (i.e., the price action on the first grey area). We see that the c-wave’s length is between 61.8% and 100% of the a-wave, meaning that the zigzag is normal.
At this point, the analysis stops. We do have a normal zigzag forming, but we do not know if the market formed a simple or zigzag as the first phase of a complex correction. Therefore, the way to determine that is to measure the time it took the c-wave to form and project it from the c-wave’s end. We see that the price action did not fully retrace the c-wave in less time than it took to form, so the pattern is a complex correction that started with a zigzag.
Of the possible complex corrections, in the order of their frequency, we should consider a double combination, a double zigzag or a triple zigzag. As it turned out, the market formed a double combination that started with a zigzag and ended with a triangle right as the COVID-19 pandemic started.
AUDUSD – Zigzag as the Second Corrective Phase of a Double Combination
The second example of this article comes from the AUDUSD pair. The chart below shows the weekly timeframe and how the AUDUSD pair fell from above parity some years ago.
Focus on the price action that started after the d-wave in black ended. More precisely, focus on the price action following the vertical line.
The AUDUSD pair fell and the subsequent bounce exceeded 61.8% of wave a. This means that the market began to move lower with a flat pattern. Remember that no complex correction begins with a triangle and no zigzag has the b-wave retracing more than 61.8% of wave a. Therefore, the only possible pattern is a flat
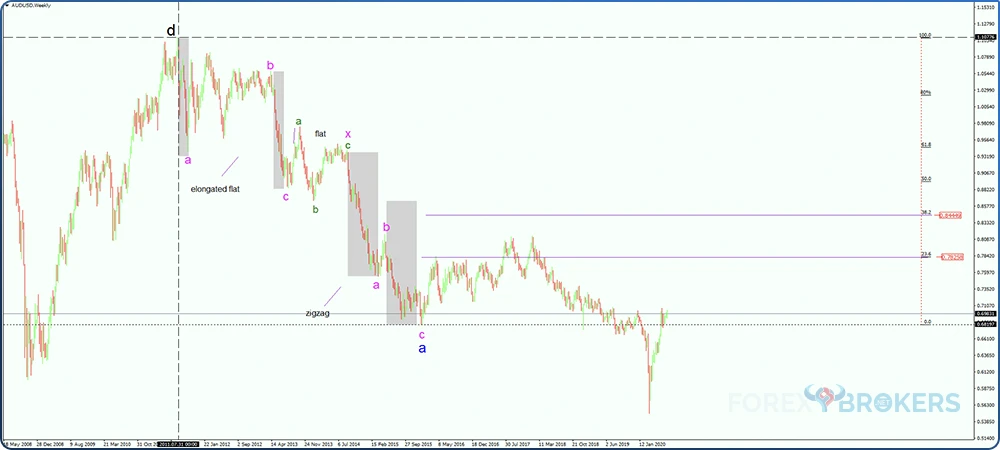
After the b-wave in magenta, the c-wave of the flat pattern elongated – exceeded 161.8% of the previous b-wave’s length. During an elongated flat, we often have some kind of time equality between the three a-b-c. Either the time it took for wave c to form equals the time it took for both waves a or b, or wave c and wave a have an equal time.
Is It a Complex or a Simple Correction?
Just like in the previous example, the focus shifts towards determining whether the flat is a simple or complex correction. In a simple correction, the price action that follows the c-wave of the flat (i.e., wave c in magenta) should fully reverse the c-wave’s move in less than the c-wave’s time. However, the time passed and the market did not have that strength.
Instead, it formed another flat pattern, this time of a lower degree (i.e., the a-b-c in green). The move lower from the end of the c-wave is strong enough to confirm the a-b-c as a simple correction. As such, that is the end of the intervening wave – the x-wave.
Zigzag as the Second Corrective Phase
What followed was a normal zigzag as the second phase of a complex correction. As mentioned earlier in the article, the time element is the defining factor for a zigzag. Coupled with the inability of the b-wave to retrace more than 61.8% of wave a, we can see a normal zigzag forming.
At this point in time, the key question is if the market formed the zigzag at the end of a double combination or just the second correction part of a triple combination. However, that is a question to be answered on a different topic. For now, it is just important to note that the zigzag formed as the second corrective phase in a complex correction.
AUDUSD – Complex Correction for the B-wave of a Zigzag
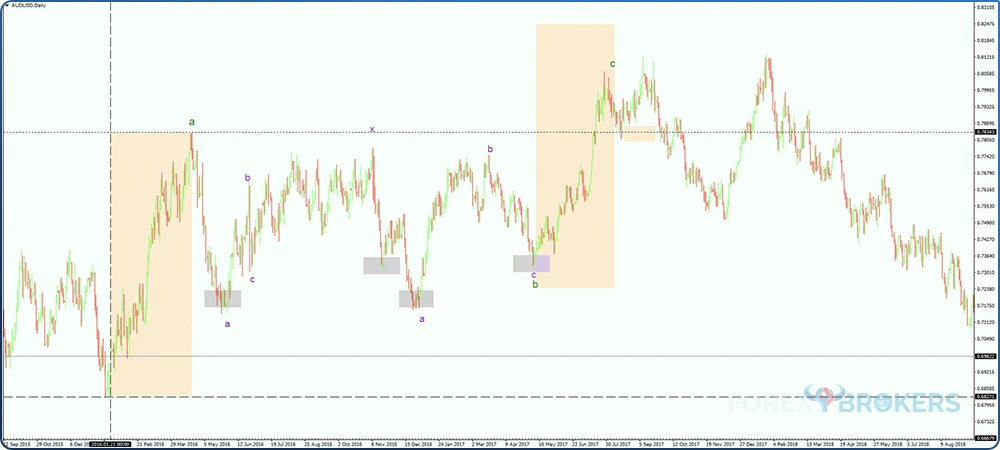
Our third example comes from the same currency pair – the AUDUSD. This time, the focus is on the b-wave of a zigzag.
Remember that the b-wave cannot retrace more than 61.8% of the previous wave a. However, remember that the retracing rule refers to the end of the b-wave, not its highest or lowest point.
In the chart below, from left to right, we see the market rising from the lows. In doing so, it formed a five-wave structure, although the chart does not focus on it at this point.

The following drop does exceed the 61.8% retracement level. This means that we do not expect the c-wave to start at that point. Also, it means that the b-wave is not completed – we need to give it more time.
In the end, the b-wave (in green) formed a complex correction called a double three. The end of the b-wave is above the 61.8% retracement level when compared with wave a. Therefore, the rule is respected and we can focus on the impulsive wave in the c-wave.
By measuring the time element of wave a and projecting it from the end of the b-wave, we form an educated guess about when the c-wave ends. At that point, we also have an idea about the time of the zigzag – normal, truncated, or elongated. Once again, the market formed a normal zigzag.
GBPUSD – Truncated Zigzag as the First Corrective Phase of a Double Combination
Our final example belongs to the British pound, one of the most liquid currencies part of the FX dashboard. This is the GBPUSD (a.k.a. cable) monthly chart – a big enough timeframe to scare any Elliott trader. However, all top/down analyses start from the bigger timeframes, and sometimes traders must begin from even higher ones.
The chart below starts with the drop seen in the aftermath of the 2008 financial crisis. Because there has been no bounce whatsoever for several months, we can safely assume that this drop is an impulsive wave – wave a in blue.
Next, the cable forms a complex correction that ends with an expanding triangle. Because the expanding triangle marks the end of the b-wave, we see that the b-wave in blue did not retrace more than 61.8% of wave a. Hence, a zigzag was about to start.
Moving forward, the next thing to do is to take a shape and measure the time element on the a-wave of the zigzag. Then, we must project it from the end of the b-wave (in blue) and wait for a five-wave structure or an impulsive wave to unfold. However, because of the time equality rule, the c-wave in blue must take more or less the same time it took wave a to form.
When time expired, the zigzag ended. At that point, the same logical process begins as presented in the previous examples. Is this a simple or a complex correction? If it is complex, what follows? What type of zigzag did the market form?
Simple or Complex Correction?
To find out if the a-b-c in blue is a simple or complex correction, we must project the time it took the c-wave to form on the right side of the chart from the end of the c-wave. In doing so, we expect the time to expire and see where the price action ends. If it fully retraced the c-wave in less time, the a-b-c is a simple correction. If not, it is a complex one.
As the chart shows, the GBPUSD pair formed a complex correction. The market bounced with an intervening x-wave that retested dynamic resistance given by the b-d trendline of the previous expanding triangle. Moreover, it got rejected from resistance and then made a new lower low.
At this point, it means that the GBPUSD formed a complex correction with at least one intervening wave. The first educated guess is that it formed a double combination. Such a pattern channels against the a-c trendline. Effectively, it means that if we take a trendline and connect the end of the impulsive waves part of the zigzag, the price action to follow after the x-wave must reach it. This way, the channeling component is confirmed.
The danger of analyzing the market with the Elliott Waves Theory on a bigger timeframe like this one is that one single error may be responsible for various wrong trades. Obviously, no one trades on the monthly chart.
However, the concept of a top/down analysis requires that the trader continue the analysis on the lower timeframes – for example, on the daily chart from the end of the intervening x-wave. If the GBPUSD formed a double combination, then the bias is that the pair forms a triangle at the end of it – so the rules of a triangle apply moving forward.
Conclusion
This concludes a new article dedicated to the Elliott Waves Theory. Zigzags form very often and appear mostly at the end of complex corrections.
Imagine – for a simple correction to be a zigzag, the market must form another impulsive wave to fully retrace the last wave of the zigzag in less than time. In other words, even an aggressive market move in the opposite direction must follow for a zigzag to be a simple correction.
While this does happen, it only does so sometimes. Therefore, whenever we see a zigzag, the bias is that it forms at the start of a complex correction, typically a double combination, double zigzag, or even triple zigzag.
The truncated zigzag is the most powerful of the three types of zigzag. At the same time, it is the rarest pattern of them all. On the other hand, a normal zigzag appears very often.
For all types of zigzags, focus on the time relationship between the two impulsive structures. If the time it took wave c to form does not equal the time it took wave a to form, the market did not form a zigzag pattern.
No other pattern in the Elliott Waves Theory requires such precision in terms of the time element. Hence, it is the main tool to interpret a zigzag.