LISTEN TO THIS ARTICLE:
One of the patterns responsible for most of the confusion associated with counting Elliott Waves is the flat pattern. As a simple correction, it is the most numerous one.
It often appears as a simple, individual structure and part of a complex correction. There are at least ten types of flat patterns, and we have already mentioned them in one of the previous articles in the rookie section. This time, the aim is to move one step closer to understanding the place of flat patterns within the Elliott Theory and what the different types tell us.
Besides examples, this article focuses on integrating flat patterns into complex corrections and the tricks for making your life easier when counting Elliott structures. At first glance, it seems like flat patterns and zigzags have many similarities – both patterns have an a-b-c structure. However, they have nothing in common, and the implications of a flat pattern differ completely from those of a zigzag.
This article extends the introductory part of flat patterns by moving a step further. More precisely, we will look at each individual flat and discuss its particularities, where it forms, what it tells us, tips and tricks to know for each pattern, and so on. Using plenty of examples and five separate videos, this section comes as an integral part of the Elliott Waves Theory, complementing topics already covered.
Between a zigzag and a triangle, a flat falls somewhere in the middle regarding its corrective characteristics. If the zigzag has two impulsive waves and the triangle has no, the flat has one single impulsive structure – the c-wave.
What Makes a Flat
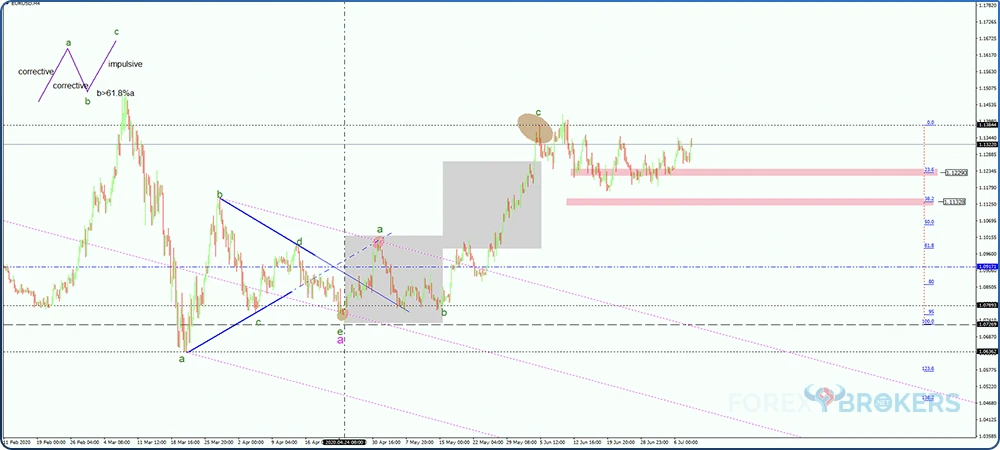
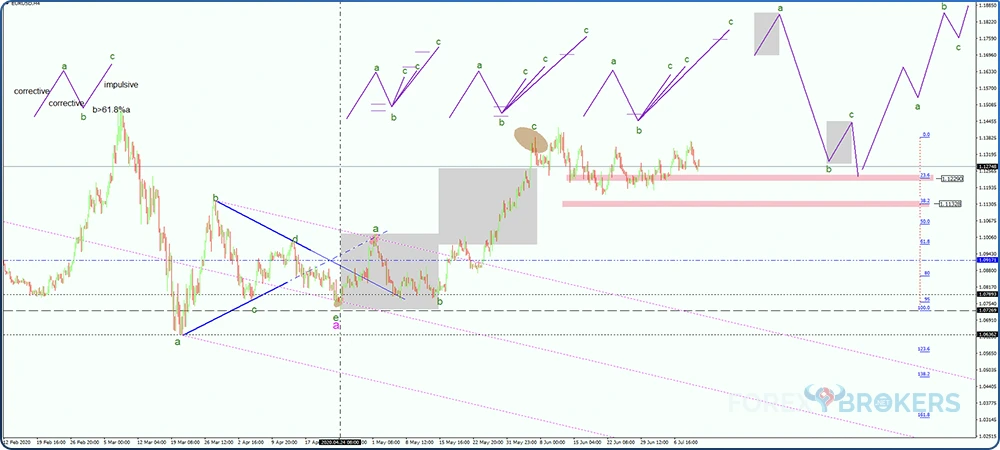
As a corrective wave, a flat is a three-wave structure or a three. Therefore, we should use letters to count its waves – a-b-c. Below, the EURUSD four-hour chart shows an a-b-c forming from the lows. As the coronavirus pandemic reached the Western world, central bankers reacted and eased the monetary policy to the extreme.
In some cases, like in the United States, the Fed flooded the market with USD. It opened swap lines with most central banks in the developed world, so the USD declined against the fiat currencies belonging to the G10 countries.
As the previous triangle broke higher, the EURUSD pierced the b-d trendline and then retested it. This is a normal market behavior forming at the end of a non-limiting triangle. But on its way to the upside and then to correct the trendline, the price formed two corrective patterns – waves a and b of a flat.
What follows is the c-wave of the flat – an impulsive wave that easily exceeded 138.2% of the previous b-wave. Therefore, the market formed an elongated flat. As you are about to find out from this article, an elongated flat pattern often appears during triangular formations. As such, it is crucial to know when flat patterns form and how they evolve to be able to put the pattern into the bigger context. Moving forward, we will use this EURUSD chart to illustrate the types of flats and the different categories in its upper half.
However, the main purpose of the chart is for you to see and understand the elongated flat marked by the two grey areas on the chart below.
General Characteristics
As mentioned earlier, of the three segments of a flat pattern, only the c-wave is impulsive, while waves a and b are corrective. Moreover, waves a and b can be either simple or complex corrections. Furthermore, if simple corrections, waves a and b of a flat cannot be a triangle. These rules leave us with only a zigzag or a flat as simple corrections for waves a and b of a flat or a complex correction.
From the start, interpreting a flat is more complicated than a zigzag because corrective waves are more numerous than impulsive ones. Therefore, Elliott identified more possibilities for the patterns that may fit as the a-wave or b-wave.
In sharp contrast with a zigzag, the b-wave of a flat pattern must retrace and end beyond 61.8% of the a-wave’s length. In fact, this is the key to any flat pattern and the minimum retracement for the b-wave. As this article will demonstrate, the b-wave may far exceed the 61.8% ratio.
Introducing Terminal Impulsive Waves
The c-wave in a flat is impulsive. Just like in a zigzag, it can be either a classic impulsive structure or a terminal one. A classic impulsive wave follows all the rules we have mentioned so far in this academy –three impulsive and two corrective waves. But this is not the only type of impulsive wave discovered by Elliot. There is also a terminal impulsive structure.
The concept will be discussed in detail in a further section of this academy, but for now, there are some things to mention. Unlike a classic impulsive wave, a terminal wave has all the waves corrective despite being labeled with numbers. Moreover, waves 2 and 4 must overlap, and all waves can be either simple or complex corrections.
What is interesting about terminal impulsive waves is that the price action that follows such patterns is always fully retraced by the market. In other words, if the c-wave of a flat is a terminal impulsive wave, the price action following its ending reverses the c-wave completely.
At this point, it is important to remember that the c-wave of a flat, just like the c-wave of a zigzag, may be either a classic or a terminal impulsive wave. Between the two, a terminal impulsive wave is more likely to be found as the c-wave of a flat rather than the c-wave of a zigzag.
Types of Flat Patterns
Flats are the most numerous patterns identified by Ralph Elliott. There are four categories of flats:
- Flats with weak b-wave.
- Flats with normal b-wave.
- Flats with strong b-wave.
- Running flats.
Moreover, there are three types of flats in the first three categories. Therefore, nine types of flats plus the running one comprise the ten types of flats.
A weak b-wave refers to the inability of the b-wave to retrace more than 61.8% of the previous a-wave. However, the retracement should be at most 80%. This weakness leads to three situations:
- Flat with b-failure.
- Flat with double failure.
- Elongated flat.
A normal b-wave assumes that the b-wave retraces between 80% and 100% of the previous a-wave. In this case, another three situations appear:
- Common flat.
- Flat with a c-failure.
- Elongated flat.
A strong b-wave implies that the b-wave fully retraces the a-wave. Moreover, it can exceed the a-wave’s length by much more than 100%. In this case, there are a further three types of flat patterns:
- Irregular flat.
- Irregular failure.
- Elongated flat.
Finally, the running flat is a special type of flat. Throughout the Elliott Waves Theory, whenever you hear the word running, the concept refers to a pattern that ends higher (in a bullish trend) or lower (in a bearish trend) than its starting point.
Now let us look at each type of flat and see its characteristics, where it usually forms, and the best way to interpret it.
Flats with a Weak B-wave
As mentioned earlier, the main characteristic of these types of flats is the b-wave’s inability to exceed 80% of the previous wave. Instead, it is mandatory for it to exceed 61.8%, so look for the end of the b-wave to fall within this range.
Sometimes, it is tricky to interpret the end of the b-wave. It may end with a triangle. Whenever this happens, parts of the triangle may exceed the 80% level, but the end of it should not.
The flat patterns belonging to this category usually signal countertrend strength. That is especially true in the case of the two flats that form failures.
Besides the retracement level for the b-wave, the c-wave’s length is the next one to consider. In fact, it is the c-wave that offers the last details that define the type of flat.
In this category, the c-wave may:
- Fail to completely retrace the b-wave.
- Exceed the b-wave’s length but not more than 123.6%.
- Exceed the b-wave’s length more than 138.2%, ideally more than 161.8%.
In the first instance, it is said that the market forms a flat with a double failure. Because the b-wave fails to retrace more than 80% of wave a and the c-wave fails to completely retrace the b-wave, the market fails twice. Hence, the name of a flat with a double failure.
Next, the b-wave remains stuck between 61.8% and 80% of the a-wave, but the c-wave manages to retrace the b-wave completely. This is a flat with a b-failure because only the b-wave fails.
Finally, an elongated flat has an exceptionally long c-wave. It usually exceeds 161.8% of the b-wave’s length and often travels much more than this level. As you probably noticed, an elongated flat pattern appears on each of the three categories of flat patterns.
The chart below shows an elongated flat, although it is one that does not belong in this category. However, it gives you an idea of how the c-wave’s length relates to the length of the other two waves in the pattern.
But what happens when the c-wave retraces between 123.6% and 138.2% of the b-wave? None of the situations presented so far cover this instance.
On such a rare occasion, it is considered that the price action that follows the flat’s completion is still strong enough to retrace the entire pattern fully. The more the c-wave extends beyond the 138.2% level, the less likely the future market activity will retrace the flat. If it exceeds 161.8%, such retracement can‘t happen.
Double Failure
The double failure is the trickiest of all the flat patterns the market may form. It has not just one but two failures – a suggestive name for what type of market activity to expect after its completion.
First, the b-wave cannot exceed 80% retracement of the a-wave. However, that is the maximum retracement level for a flat to be included in such a category. Very often, the b-wave barely exceeds 61.8% and quickly retraces in the opposite direction. That is one failure.
Second, the c-wave fails to retrace the b-wave. Remember that any c-wave in a flat pattern is an impulsive wave or a five-wave structure. Either classic or terminal, the market must form five segments following the impulsive activity rules.
Despite that, the c-wave does not retrace the b-wave completely. It is the second time the price action failed to take the previous market’s high or low, suggesting a countertrend strength.
A flat with a double failure may appear in various places during an Elliott Waves analysis:
- As the second wave of an impulsive move:
- When this happens, the third wave is extended and easily exceeds 161.8% compared to the first wave’s length.
- As the fourth wave of an impulsive move:
- When this happens, the market will likely form a fifth-wave extension impulsive wave. It tells you how strong the move following a flat with a double failure really is.
- As the b-wave in a flat:
- When this happens, the c-wave is unlikely to fail but highly likely to exceed 161.8% compared to the previous b–wave, creating the elongated flat pattern.
- As any segment of a terminal impulsive wave.
B-failure
When only the b-wave fails, the market forms a flat with a b-failure. In this case, the b-wave remains relatively short, having a length between 61.8% and 80%, and the c-wave fully retraces the b-wave but no more than 123.6%. In rare cases, as mentioned earlier, it may even reach 138.2%.
The market’s reaction following such a pattern is not as strong as in the case of a flat with a double failure. Nevertheless, a failure does exist, so expect an extended wave or a wave with an unusual length to follow.
Most flats show hesitation, and this is one such pattern. Imagine the start of it – the market corrects with a three-wave structure. The next thing you know, the price action reverses course but remains corrective in nature. Finally, the market turns again after failing to exceed 80% retracement of the previous swing, only this time it takes the lows or highs with an impulsive structure.
Places where a flat with a b-failure may appear:
- A-wave of a flat:
- In rare instances, it may appear as the a-wave of a flat. Why rare? Because the flat has a failure, it usually signals a stronger market move, much stronger than the b-wave of a flat usually is.
- B-wave of a flat:
- When this happens, the c-wave is likely to exceed 161.8% of the previous b-wave, making the entire formation an elongated flat.
- Second wave in an impulsive wave:
- A third wave extension usually follows.
- Fourth wave in an impulsive wave:
- The fifth wave of a third wave extended impulsive move follows.
Elongated Flat
An elongated flat pattern appears in each category of flats. In other words, regardless of the length of the b-wave’s strength, the c-wave may still be long enough for the market to form an elongated flat.
There is one exception, but we will discuss it more opportunely further down the road. At this point, and in this category, the elongated flat with a weak b-wave (i.e., retraces between 61.8% and 80% of the a-wave) has a c-wave that is the longest segment in the pattern.
The minimum distance of the c-wave’s length for the pattern to be considered elongated is 161.8% when compared with the b-wave’s length. Therefore, make sure to use a Fibonacci tool and find out the extension. As some advice, do not measure the b-wave from the highest to the lowest point. Instead, measure it from start to end, as the levels often differ from the absolute high and absolute low.
The c-wave may be a classic or a terminal impulsive structure. Also, for the pattern to elongate, 161.8% is the minimum distance for the c-wave’s length. The market may move way beyond that level without the pattern being affected.
Often, the elongated flat presents similarities between the time it takes the segments to form. The most common similarity is that the c-wave is the most time-consuming, often taking more than the time needed for waves a and b to form.
Places where an elongated flat pattern may appear:
- As wave a, b, c, d, or e of a triangle:
- When this happens, the elongated flat is either the entire leg of the triangle or only a part of it.
- The entire segment of a terminal impulsive wave:
- In a terminal impulsive structure, all segments are corrective. As such, as is often the case, the market may form an elongated flat, usually as the longest segment in the pattern.
Flats with a Normal B-wave
When the b-wave retracement is “normal,” it means that it ends between 80% and 100% of the previous a-wave. Whenever this happens, the b-wave takes more time than the a-wave. However, this is not a general rule.
In this category, we also have three types of flat patterns:
- Common flat:
- Like the name suggests, this is the most common type of flat in this category. Indeed, when the b-wave retraces more than 80% of wave a but fails to exceed 100%, the focus shifts to the c-wave. For a common flat, the c-wave must be longer than the b-wave but not longer than 123.6%.
- C-failure:
- A powerful pattern showing countertrend strength, the C-failure suggests that the c-wave fails to fully retrace the previous b-wave. As such, a flat with a c-failure has the c-wave as the shortest segment of the three that make up the pattern.
- Elongated flat:
- When the c-wave is the longest and the b-wave respects the rule of the flats belonging to this category, the market forms an elongated flat.
Common Flat
A common flat pattern has some particularities we should consider before interpreting it. During such a pattern, the c-wave rarely retraces more than 123.6% of the previous b-wave, and when it does, it should not exceed 1138.2%. If it does so, the flat becomes elongated.
One of the most important things to remember when trading and interpreting a common flat is the time the three waves form. More precisely, the b-wave should be the most time-consuming wave of the three a-b-c to form the pattern. It often exceeds the time of waves a and b together, especially if you count the wave on a cross pair.
For the b-wave to be the most time-consuming, it must be a complex correction. Rarely is the b-wave a simple correction, so it must be the most time-consuming. What simple pattern consumes time? The answer is a triangle. However, a triangle cannot form as the b-wave of a flat. Therefore, look for the b-wave to be a complex correction that is fully retraced by a wave of the same degree.
In other words, the b-wave should be a double combination instead of a double zigzag, triple zigzag or a triple combination. The explanation is that the price action that follows a double zigzag, triple zigzag or triple combination should not fully retrace the pattern. But, according to the common flat, it must.
Therefore, a double combination ending with a triangle is the likeliest pattern to form as the b-wave of a common flat.
Places where to find a common flat:
- Second wave of an impulsive move.
- Fourth wave of an impulsive move.
- The first or the second correction in a double or triple flat or combination.
C-Failure
With a suggestive name, the c-failure flat has the c-wave, the shortest segment of the entire a-b-c that forms the flat. This characteristic tells much about what to expect when trading such a pattern. We know that the c-wave is impulsive during a flat formation. But for an impulsive segment to be shorter than two corrective waves of the same degree, the market shows countertrend strength.
Just like in the case of the common flat, the time element also plays a crucial role in the c-failure. Only this time, it is not the b-wave that is the most time-consuming, but the c-wave.
Which brings us back to the previous question – what impulsive wave consumes the most time while not breaking important levels? The answer is a terminal impulsive wave.
As mentioned earlier in the article, a terminal impulsive is labeled with numbers, even though all its segments are corrective. It forms at the end of classic impulsive waves or at the end of a terminal impulsive wave of a larger degree, but most often appear as the c-wave of a flat. Moreover, when it does form as the c-wave of a flat, the terminal impulsive wave is the most time-consuming segment.
A terminal impulsive wave that appears as the c-wave in a c-failure looks like a rising wedge. During its formation, the price action most likely diverges from classic oscillators like the Relative Strength Index (RSI).
When a flat with a c-failure forms, it appears as follows:
- The second wave in an impulsive wave.
- The last corrective phase of a running pattern.
- A possible fourth wave of an impulsive wave, although this is a rare possibility.
- As the b-wave in a zigzag.
- As an individual segment of a terminal impulsive wave.
Elongated Flat
The first (and most important) thing to remember when trading or interpreting an elongated flat is the fact that the c-wave is the longest. Literally, it has no limitations.
The minimum distance for the market to travel during the c-wave of an elongated flat is 138.2%, ideally 161.8% when compared with the previous b-wave. But it can easily exceed the level. As a matter of fact, it often does so in the currency market.
A flat pattern when the b-wave retraces between 80%-100% of the a-wave and the c-wave exceeds 138.2% is called an elongated flat. As a rule of thumb, rarely is the c-wave of an elongated flat a terminal impulsive wave, but very often, it will be a classic impulsive wave.
However, despite being a classic impulsive wave, the c-wave of an elongated flat is still the most time-consuming wave in the pattern. It often takes a similar time as waves a and b together. Sometimes, it can easily exceed the combined time of waves a and b.
We already covered the places where the elongated flat may appear in the previous category of flats. This one is no different, with the only new thing being the b-wave’s deeper retracement into the b-wave’s territory.
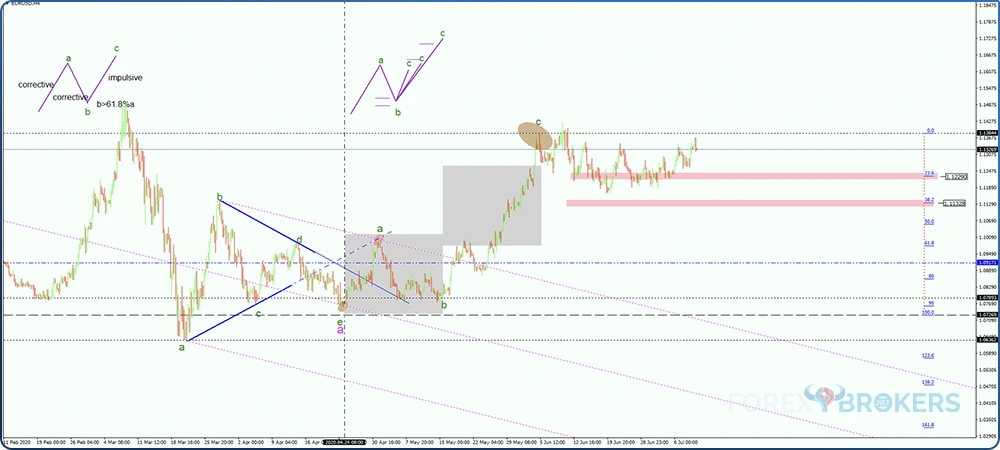
Elongated Flat Example on the EURUSD Currency Pair
This is the second time we introduce the chart below. It shows the recent price action on the EURUSD currency pair – price action seen on the pair before and after the coronavirus hit the Western world.
From left to right, the market formed a contracting triangle. Contracting triangles rarely appear as simple corrective waves part of the Elliott Waves Theory. They mostly form at the end of complex corrections, bearing the name of non-limiting triangles.
A non-limiting triangle is always retested by the price action when the price breaks the b-d trendline. Moreover, the price action during the last segment of the triangle tends to consolidate towards the apex’s time zone.
In other words, it is safe to assume that the triangle was completed by the time the vertical line (i.e., the time zone of the apex) was reached. That is the moment when the elongated flat starts.
First, the move higher breaks the b-d trendline. We clearly see a corrective structure, as there is no extended wave. Hence, the bias is that the market forms a corrective wave, the a-wave of a flat (shown in green).
Next, the market begins retracing for the retest of the b-d trendline. Even this descending move, the retest, looks corrective, as it should be in the case of a flat. The focus here shifts to where the b-wave ends. Remember, the types of the flat patterns depend on the category and the category depends on the end of the b-wave. Or how much the b-wave retraces into the territory of the previous a-wave.
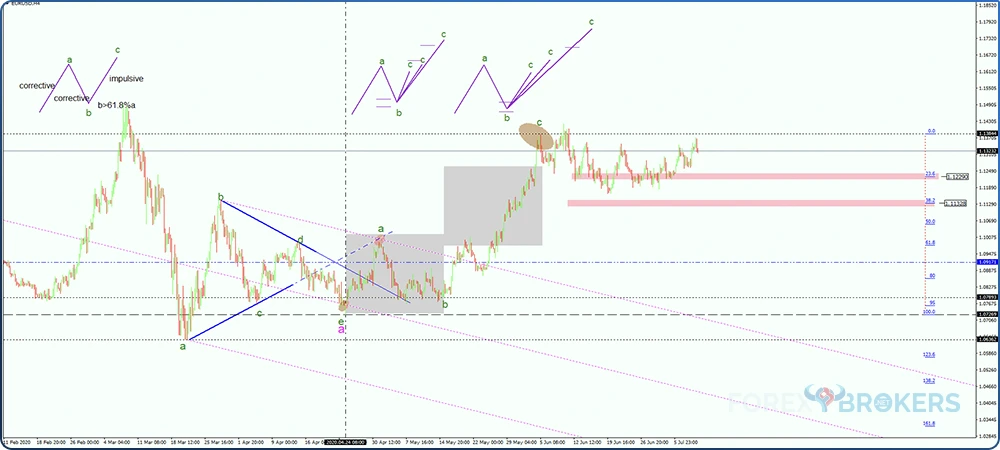
How to Interpret an Elongated Flat?
By the time the market completes the b-wave, the impulsive move starts. At first, the impulsive wave is difficult to see. In fact, as is often the case, the impulsive wave forms a running correction for its second wave, giving the impression that the market will correct further.
The way to treat such a flat is to measure the time for waves a and b together. That is the first grey area on the previous chart. Next, project the time element on the right side of the chart, starting with the end of the b-wave.
In an elongated flat, the typical arrangement is that the c-wave, or the impulsive segment in the flat, will equal the time it took waves a and b. Therefore, the simplest thing to do is to go long after the end of the b-wave and wait for the time element to expire.
While this looks simple enough, in reality, it is exceedingly difficult to hold your position and wait. The economic news will keep coming, making the trader doubt the pattern. However, if the c-wave is a classic impulsive move, the price action should stay within the end of the b-wave.
Finally, measure the b-wave using a Fibonacci retracement tool and determine the 161.8% extension. Moreover, use the measured move and project it from the end of the b-wave. The c-wave almost always exceeds the 161.8% level.
Now that we have confirmation that the market formed an elongated flat, the next question arises: what does it mean? As mentioned earlier in the article, an elongated flat suggests a triangular formation, so the bias is that the market forms a triangle where the elongated flat is either an entire segment of it or only part of one segment.
Flats with a Strong B-Wave
The last category of flats has a strong b-wave. As you have probably noticed by now, the b-wave’s length exceeds the a-wave’s length. More precisely, the b-wave is longer than the a-wave, fully retracing it.
There are three flat patterns in this category, provided that the b-wave retraces between 100% and 123.6% of wave a:
- Irregular failure.
- Irregular flat.
- Elongated flat.
Irregular Failure
A flat with irregular failure also suggests countertrend strength, just like all the flats with a failure presented so far. The thing to know in a flat with irregular failure is that the b-wave might exceed 123.6% of wave a, but the c-wave will not retrace the b-wave. That is the failure that gives the flat its name, and the bigger the b-wave, the more waves a and c look alike, both in time and in price.
Irregular Flat
An irregular flat pattern has each following segment longer than the previous one. Therefore, the b-wave is bigger than the a-wave, while the c-wave is bigger than the b-wave.
This arrangement makes it difficult to trade the irregular flat because traders tend to place their stop-loss orders at the most recent highs and lows.
Between the two irregular patterns in this category, the irregular flat rarely forms. Instead, the irregular failure is a constant presence on the currency market.
Elongated Flat
The elongated flat in this category follows all the rules of an elongated flat that we have discussed so far. The only difference here is that the b-wave is much longer than the a-wave but not longer than 123.6%.
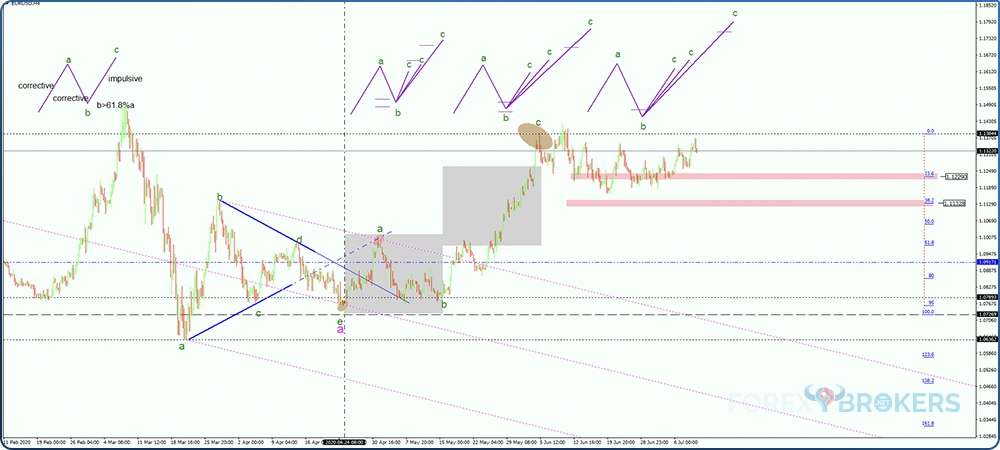
Running Flat
The last flat pattern to discuss is the running flat. The image below shows two flat patterns–bearish and bullish – in the top-right corner.
A running flat forms as a consequence of the b-wave exceeding 123.6% of the a-wave’s length. Whenever this happens, the c-wave cannot fully retrace the b-wave. Moreover, when the c-wave does not enter the territory of the previous b-wave, the pattern “runs.”
A running flat is extremely bullish/bearish and forms ahead of the extended waves in an impulsive wave. In complex corrections, the market may even form double or triple running flat patterns, pointing to an even bigger breakout.
Conclusion
Flat patterns are the most numerous ones. The ten flats presented here form regularly on the currency market.
Knowing their characteristics and where they appear allows traders to make an educated guess about the next market move. Combined with sound money management rules, the flat patterns offer impressive risk-reward trades.