A triple combination is one of the most complex patterns of the Elliott Waves Theory. Every time you hear about a "triple" complex pattern (e.g., triple combination, triple three, triple flat, triple zigzag, triple three running), know that combining three simple corrections is the maximum degree of complexity developed by the Elliott Theory.
Like any complex correction, triple combinations have x-waves. Because the intervening segments must connect three simple corrective structures, the triple combination requires two distinct x-waves.
Triple combinations are painful patterns to trade against. Because of the complexity of the structure, a triple combination takes a lot of time, regardless of the timeframe in which they appear.
Counting waves with the Elliott Theory is a time-consuming process. The interpretation of each segment and the logical process makes it virtually impossible to use the Elliott Waves Theory on timeframes lower than the hourly chart. Even on the hourly chart, things change so quickly that traders have their attention captured by only a handful of currency pairs. Following more currency pairs is impossible because of the constant market moves.
Therefore, the Elliott Waves Theory works best on bigger timeframes. No one suggests that the analyst should not go down to the hourly chart to study a pattern – but that should be considered exceptional. For this reason, any complex correction is time-consuming. Discussing a triple combination is worth considering that it takes a lot of time to complete.
In other words, fading one is a difficult process and requires a lot of resources. The challenge for Elliott traders is to identify as early as possible the pattern to adapt the money management as quickly as possible.
Triple Combinations – Generalities
As complex corrections, triple combinations never start with a triangle – they can only start with a flat or zigzag. Moreover, although the initial Elliott research also presents the possibility of a triple combination ending with a different pattern than a triangle, we should discount it from the start. Triple combinations almost always end with a triangular pattern, meaning that the odds are almost a hundred percent for it to happen. Hence, everything in this article and the example presented in the three videos assume a triple combination that ends with a triangle.
A triple combination has not one but two intervening waves. The two x-waves are complex, too, and cannot retrace more than 61.8% into the territory of the first corrective phase. An x-wave can be a zigzag, a flat, or a triangle, but also a complex correction on its own, albeit of a lower degree.
Triple combinations represent a corrective phase of five different patterns. Interpreted together, they all form one of the most complex Elliott Waves structures discovered.
A triple combination always corrects something – it may correct the a-wave of a triangle, it may correct a wave of a bigger degree or even the a-wave of a flat. But no matter where triple combinations appear, they are never retraced by a wave of the same degree except in a couple of instances.
One is when it forms the 5th wave of a 5th wave extended impulsive wave. Another is when it forms the last segment of a terminal impulsive move. For a full understanding of such patterns, refer to upcoming sections of this trading academy.
The process of identifying a triple combination is similar to that of identifying a double one. The main difference is that the market forms a zigzag or a flat instead of a triangle for the second corrective phase, pointing to yet another intervening x-wave and a future triangular pattern.
Triple Combinations that Start with a Flat
The earlier generalities about a triple combination should have mentioned that neither the first nor the second correction must be a triangle. A triangle is allowed only at the last phase of the pattern or as one of the two x-waves. It is unlikely to have a triangle for both x-waves, so if the second x-wave presents similarities in a triangular pattern, the market will most likely form a double combination instead of a triple one.

One of the previous articles in this trading academy shows the complex corrections part of the Elliott Theory. For the triple combination, it used an example that starts with a flat.
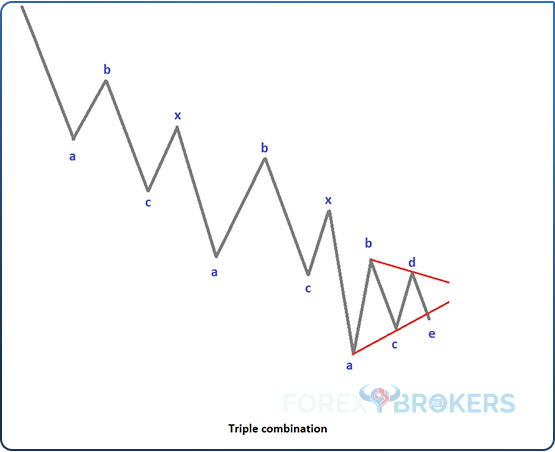
Let us review what appears in the above picture showing the theoretical shape of a triple combination:
- The first a-b-c is a flat pattern
- Wave a is corrective
- Wave b is corrective and retraces more than 61.8% of wave a
- Wave c is impulsive
- The move that follows the flat fails to confirm it as a simple correction – hence, it represents the x-wave.
- The market makes a new low without showing any signs of a triangular pattern – suggesting another flat or zigzag is in the making.
- In this example, it was a zigzag because the b-wave failed to retrace beyond 61.8% of wave a
- This is the second a-b-c of the pattern
- The next retracement can only represent the second x-wave.
- Finally, the market makes a new low, with Elliott traders already expecting a triangle at the end of the triple combination.
- The third correction is an a-b-c-d-e
If we connect the three corrections with the two x-waves, the result shows the labeling of a triple combination: a-b-c – x – a-b-c – x – a-b-c-d-e. It now becomes clear that despite having five structures, the pattern only has three basic patterns connected by two x-waves. However, if we count each segment, a triple correction has 13 segments, and many subdivide into lower-degree patterns in even more segments.
Triple Combinations That Start with a Zigzag
The other type of triple combination has many similarities to the one presented earlier in this article. Instead of a flat pattern for the first corrective phase, this other type starts with a zigzag.
When compared with the previous triple combination, this one begins with a zigzag pattern. Moreover, it continues with a flat and ends with a triangle. The previous triple combination began with a flat, continued with a zigzag, and ended with a triangle.
Despite the two changes (quite major ones), the nature of the pattern does not change a bit. Furthermore, its interpretation remains the same, following the same logical process.
For the first zigzag, the time of the two impulsive waves (a and c) must be similar. Also, the b-wave should not retrace more than 61.8% of wave a for the a-b-c to be a zigzag.
Once these rules are respected, the focus moves to the first opposite swing that follows. If it fully retraces the entire c-wave’s length in less time than it took for the c-wave to form, the market completed a simple correction. If not, expect a complex correction with a large or small x-wave.
If the x-wave does not stretch beyond 61.8% of the entire first a-b-c, it becomes clear that the market forms a complex correction with a small x-wave. The question becomes – is it a double or a triple combination?
The next market segments lift doubts. As the market forms a triangular pattern, it becomes obvious that the triangle ends in a triple combination.
Later in this article, we will explain why this is still not enough to fully determine if a pattern is a triple combination or not. The channeling component plays a key and final role in trading such complex Elliott Waves patterns.
Check out our video about the Triple combinations patterns:
Other Types of Triple Combinations
As you probably noticed, the second correction part of a triple combination does not change the nature of the pattern. In fact, it does not matter if the market forms a zigzag or a flat for the second correction as long as it does not form a triangle.
Therefore, a triple combination starts with a flat or a zigzag. Next, it continues with another pattern out of the two – zigzag or flat. Finally, it always ends with a triangle.
A true challenge for Elliott traders appears when the triple combination has two similar patterns for the first two corrections. For example, what should the trader do if the first and the second corrective phases are zigzags or flats?
If the first two corrective waves are zigzags, the trader is inclined to believe that the market is forming a double zigzag. Compared with the triple combination, the double zigzag’s end becomes clear when the market breaks the downward or upward channel. In the case of a triple combination, no such channel exists.
Suppose the first two corrective waves are flat patterns. In that case, the Elliott trader has an easier task identifying the triple combination because a double flat pattern rarely appears on the currency market. Therefore, when a possible double flat pattern becomes obvious, the trader should consider the possibility that the market is forming a triple combination with two flat patterns as its first two corrections.
These are all types of triple combinations. Here is a quick review:
- flat-zigzag-triangle
- a-b-c – x – a-b-c – x – a-b-c-d-e
- zigzag-flat-triangle
- a-b-c – x – a-b-c - x – a-b-c-d-e
- zigzag-zigzag-triangle
- a-b-c – x – a-b-c - x – a-b-c-d-e
- flat-flat-triangle
- a-b-c – x – a-b-c - x – a-b-c-d-e
Where to Expect Triple Combinations
One of the most interesting aspects of the Elliott Waves Theory relates to the specific places where a pattern appears. For this reason, a trader must simply identify a pattern and make sure that the price action respects all the rules.
Following the logical process part of the theory, the next market move must follow a certain path. Because it leaves no room for a different interpretation, the Elliott Waves Theory’s predictive power is highly appreciated by traders.
In the case of triple combinations, things are quite straightforward. The pattern may appear either as the entire leg of a triangle (mostly a contracting triangle), part of it or the last segment of a terminal impulsive structure.
Triple Combinations as the Entire Leg of a Contracting Triangle
The most likely place where one can see a triple combination is in a triangular pattern. Of the two main categories of triangles, contracting triangles are by far more common – and that’s where Elliott Waves traders must look for triple combinations.
Most of the triple combinations form an entire segment of a triangle. This means we might expect a triple combination for any a-b-c-d-e segment in a triangular pattern.
Because triple combinations are not possible to be retraced by a wave of the same degree, the rule regarding the formation during a contracting triangle imposes some limitations. For instance, in an irregular contracting triangle, the b-wave’s length exceeds the length of the previous a-wave.
This is a problem if you find a possible triple combination as the a-wave of an irregular contracting triangle. Effectively, the Elliott Waves Theory tells you that you are wrong in assuming such a pattern because no part of the b-wave should fully retrace the a-wave if a triple combination appears there.
A similar thing may happen in a special type of horizontal contracting triangle. A horizontal contracting triangle has the first wave as the longest one, and the subsequent segments are smaller than the previous ones.
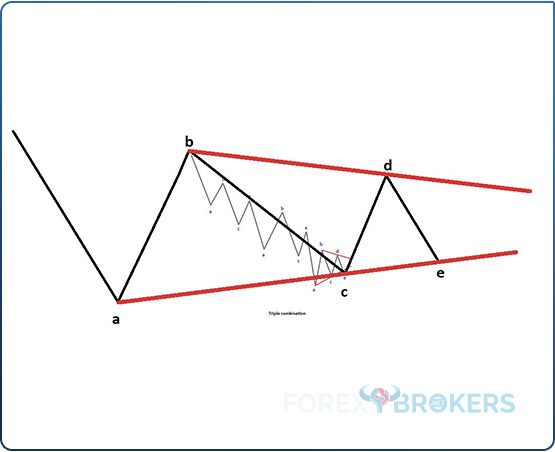
However, some special situations do exist – the image below shows a special type of contracting triangle, having a triple combination as the first segment (wave a) but failing to form a horizontal shape (the c-wave’s length exceeds the b-wave’s length).

In any case, the condition required by the triple combination is satisfied, so such an arrangement is consistent with the Elliott Waves principles. For a horizontal contracting triangle that respects all the rules, a triple combination appears with predilection on waves a, b, c, or d, but rarely as the e-wave.
Triple Combinations as the Last Segment of a Terminal Impulsive Wave
Another Elliott pattern where triple combinations are quite common is the terminal impulsive wave. The types of terminal impulsive waves will be treated in further sections part of this trading academy, but for now, we should mention a few things.
First, in a terminal impulsive pattern, all segments are corrective despite the fact that the labeling involves numbers. So far, we have learned that Elliott set a few rules to distinguish between impulsive and corrective activity – the most important one being using numbers for impulsive waves and letters for corrective ones.
However, while using numbers to count the waves, a terminal impulsive pattern is formed out of corrective waves. Moreover, even if the corrective segments are simple patterns (flats, zigzags, or triangles), the price action is not mandatory to confirm them (using the time rule). In other words, these are special patterns where either simple or corrective waves form.
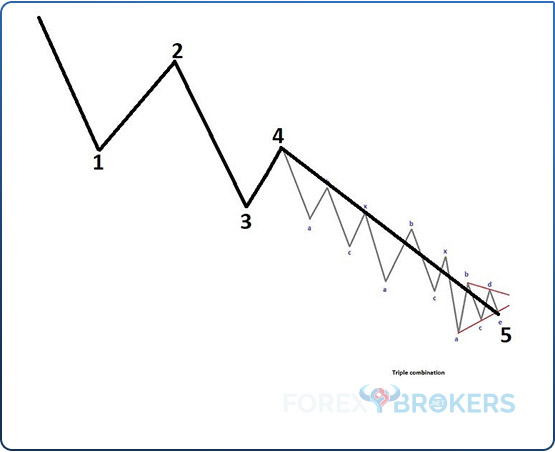
The rule saying that a wave of the same degree cannot retrace a triple combination comes to help us again. Because of it, the triple combination cannot appear as the 2nd wave in a terminal impulsive wave nor as a 4h wave. Instead, it is highly likely to appear as the 5th wave.
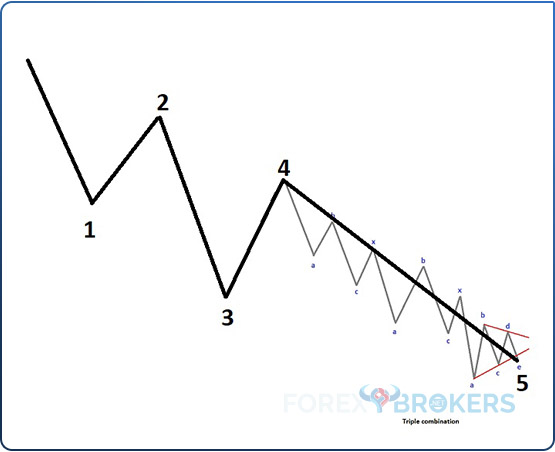
When it forms the last segment of a terminal impulsive pattern, it will likely be the extended one. Moreover, the price action that follows often retraces the triple combination fully. To respect the rule about retracement mentioned earlier, it means that the new market segment is of a larger degree (a bigger cycle).
Between a contracting triangle and a terminal impulsive structure, the triple combination appears more often in the first instance. However, one should not discard the possibility of the market forming a triple combination as the last segment of the terminal impulsive wave, even though it will be time-consuming.
Common Errors When Interpreting a Triple Combination
One of the most common errors is the full retracement following a triple combination. If that happens, the only acceptable place is the 5th wave of a terminal impulsive wave.
A close look at the chart below and comparing it with the earlier one shows little or no differences. However, the one below is incorrect because it shows a classic impulsive wave having a triple combination at the end. The key to spotting the difference is overlapping the two corrective waves (2nd and 4th).
The B-B-B Trendline
Upcoming sections of this trading academy will treat the channeling component accompanying complex corrections. This is especially important for complex corrections with a small x-wave; triple combinations are such corrections.
Everything discussed so far in this article is irrelevant if the channeling component does not exist. The rule states that, for a triple combination, the endings of the three b-waves must align.
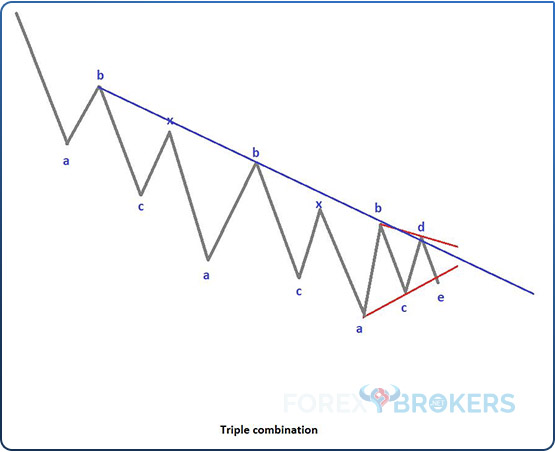
In other words, if we take a trendline and connect the first two b-waves, the third one should also end against that trendline. The resulting trendline, called the b-b-b line, puts the final verdict on a triple combination. Without the pattern respecting the channeling component, the market does not form a triple combination, even if all the rules listed so far are respected.
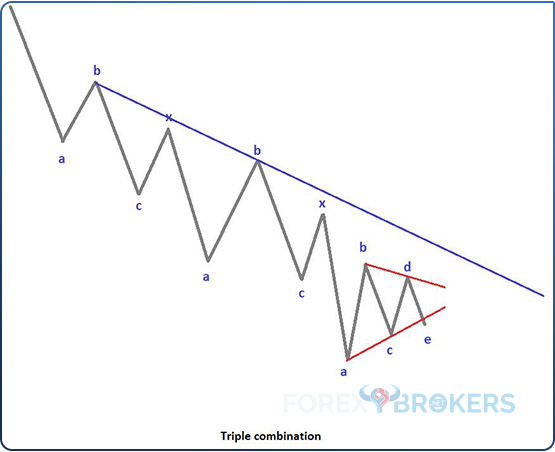
Here is the triple combination used as an example so far throughout this trading academy – this article started with it. However, as the b-b-b trendline reveals (the blue descending trendline), the pattern is inconsistent with the b-b-b condition. In other words, this formation is not a triple combination, as the third b-wave fails to meet the trendline that connects the first two b-waves.
The correct version is shown below. The third b-wave must end in the vicinity of the b-b trendline to complete the b-b-b channeling component. Moreover, the ideal triple combination has at least one of the two x-waves reaching the b-b-b trendline. The more contact the pattern has with the b-b-b trendline, the better for the overall verdict that the market formed a triple combination.
Interpreting the All-Important Triangle
Perhaps the most important part of a triple combination is its ending point. In this case, all triple combinations end with a triangle, and of all the possible triangles that Elliott identified, the contracting triangle is most likely to appear there.
Moreover, it is not just any type of contracting triangle but a specific type – non-limiting one. Other articles in this academy deal with limiting and non-limiting triangles, so if you need to learn more about such patterns, feel free to double-check the rules.
What is important here is the b-d trendline of this triangle and the fact that, for the e-wave, the price often forms a contracting triangle on its own.
However, the basic rules of a contracting triangle remain the same – the price must break the b-d trendline in less time than it took for the e-wave to form. Furthermore, no parts of the e-wave should pierce the b-d trendline.
The second rule is of particular importance because if the e-wave is a triangle of a lower degree, the entire pattern must form below the b-d trendline. Even more, it often takes so long to consolidate that the price action stretches towards the apex (i.e., the a-c and b-d trendlines intersection) of the non-limiting triangle.
Also, the price action must retest the b-d trendline after the breakout. The bigger the timeframe, the more powerful the breakout and the subsequent retest.
The ideal setup is to wait for the price to break the b-d trendline. Next, wait for a retest of it and go long (if the triple combination is correcting a rising trend) or short (if the triple combination is correcting a falling trend), with a stop-loss at the end of the e-wave of the triangle. Finally, set a take-profit that covers at least a 1:2 risk-reward ratio, meaning that the take-profit must cover a minimum of two times the risk involved.
How a Triple Combination Looks in Reality
Now that we have laid down all the rules of a triple combination, it is time to have a look at some examples. Before continuing, consider that triple combinations do not form as often as double combinations or double zigzags, for instance – not even as often as triple zigzags. But when they do, they typically are responsible for large market moves, especially if they form on the bigger timeframes.
Another thing to consider is the uniqueness of the currency market. Unlike the stock market in the 1930s, when most of the Elliott Waves principles were laid down, the current foreign exchange market is more liquid, volatile, and dominated by algorithmic trading.
For this reason, the patterns envisioned by Ralph Elliott back then do not find a substitute for the lower timeframes in today’s currency market. Therefore, look for the Elliott Waves Theory to work best on the bigger timeframes – the bigger the timeframe, the better.
The implications for today’s trader are immensely powerful. For instance, many traders use a combination of strategies to make the most of the currency market’s volatility.
Therefore, if the Elliott Waves Theory indicates a bullish move is following on the monthly chart, it makes no sense to jump on the long side immediately. Instead, traders use a combination of Elliott and other technical indicators, and the lower timeframes serve as confirmation of the Elliott direction from the bigger ones.
Because of that, as one of the larger timeframes (4h, daily, weekly, monthly), the Elliott patterns forming on the currency market resemble the theoretical work described by Ralph Elliott. With that in mind, our example considers a possible triple combination forming on the monthly EURUSD chart.
How to Trade a Triple Combination
The EURUSD is the most popular currency pair on the FX market. Because it is extremely liquid, it typically has the lowest spreads possible, making it the cheapest currency pair to trade (spreads are an additional cost of trading – the higher the spreads, the higher the cost of each trade).
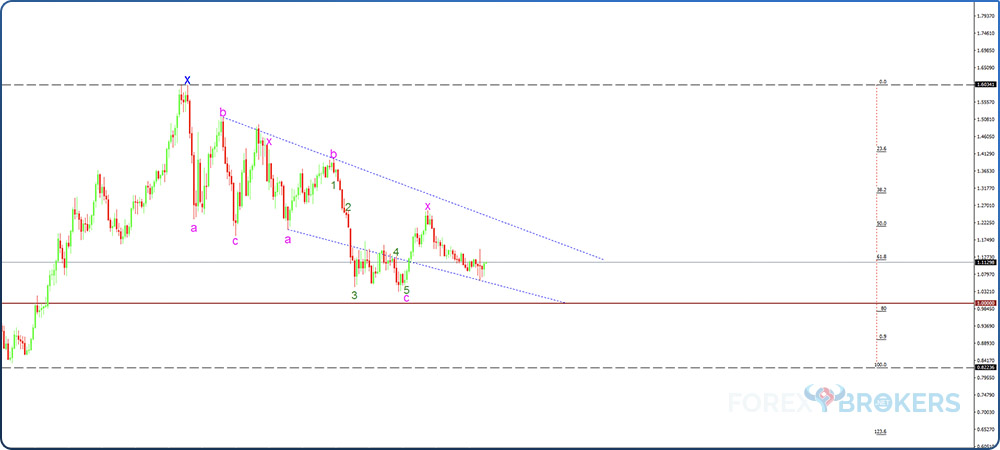
In our example, the triple combination starts with the 2008-2009 highs at the beginning of the Great Financial Crisis. Ever since that moment, a decade ago, the EURUSD pair has moved in a downtrend.
It dropped from 1.60 to almost parity (1.03) in ten years, with many fundamental voices arguing for the dissolution of the euro. Yet, the euro survived, although the EURUSD exchange rate dropped significantly.
What Caused the Exchange Rate to Drop?
For the export-oriented Eurozone, the drop in the exchange rate is viewed as a blessing. Competitive exports make it easier for nations to balance their accounts, and a weaker currency certainly helps.
On the other hand, the euro weakened due to internal problems in the Eurozone. Shortly after the 2008-2009 financial crisis that originated in the housing market in the United States, the Eurozone sovereign debt crisis hit in 2012. Greece and then Cyprus threatened to break up the Eurozone as their debt levels suddenly became unsustainable.
Moving forward, the ECB's new leader, Mario Draghi, took the helm of the central bank at the end of 2011. The ECB immediately cut the refinancing rate and never delivered a rate hike for the entire duration of Mario Draghi’s mandate (2011-2019). During his mandate, the ECB lowered the rate below zero and embarked on quantitative easing and other unconventional measures in a desperate attempt to spur growth.
So did the Fed. However, after the initial easing caused by the 2008-2009 financial crisis, the Fed saw the United States economy improving and stopped the expansionary monetary policy. Moreover, Janet Yellen reversed the course of balance sheet expansion, further fueling the gap between the European and American monetary policies.
The new Fed Chair, Powell, continued the tightening cycle started by Yellen, and the federal funds rate peaked above 2% before the Fed reversed course. All this time, the ECB kept the rates below zero.
And then the coronavirus pandemic came. The two central banks had different starting points but faced similar economic developments – high unemployment, disinflation, and threatening deflation.
Interpreting the Technical Picture
The reason for the previous paragraphs is to stress the fact that behind each chart, there is a fundamental thesis. While technical analysis shows the market’s possible future direction, the fundamental one offers an explanation for why the market starts to move.
Financial media outlets always try to find a reason why the market moves. Sometimes, it is the Fed, other times, the ECB. Sometimes, the flows, other times a geopolitical event and so on. All this information and technical analysis offer the trader a better understanding of how exchange rates fluctuate.
According to the top/down analysis concept already explained in this trading academy, the more historical data available to interpret, the better. In this case, the monthly chart continues a top/down analysis from an even larger Elliot cycle. We see it begins with an x-wave.
The very first thing that comes to mind, only judging by the first x-wave on the left side of the chart, is that the market forms a triple combination as the entire leg of a contracting triangle.
Moreover, because the drop from 1.60 to 1.03 represents the first segment of the triangle, it can only be the a-wave of the triangle of a similar degree to the x-wave. Therefore, by the time the triple combination ends, it will end the a-wave of a contracting triangle.
Going back through the theoretical aspects presented in this article, we know that a triangle appears as the last segment of a triple combination. More precisely, a triple combination always ends with a triangular pattern. And most of the time, that triangle is a contracting one.
Moreover, we know that a triple combination has the following structure: a-b-c – x - a-b-c – x - a-b-c-d-e. Hence, starting with the 1.60 high on the top of the EURUSD chart, we should start “deploying” the triple combination letter on the market swings to see if we can find a pattern that fits.
Counting the Market Swings
The first swing lower (wave an in magenta) was followed by a b-wave that retraced more than 61.8% into its territory. Hence, the market formed a flat as the first corrective wave part of the triple combination.
After the c-wave marked a new low, the focus shifted to see if the a-b-c was simple or part of a complex correction. As the market retraced, it became obvious that the pattern was a complex correction because the reversal took more than the time it took the c-wave to form.
Moreover, it retraced beyond 61.8% of the first a-b-c but did not close above. The end of the first intervening wave represents the start of the second corrective phase – another flat pattern.
The a-b-c that followed is amplified by the length of the c-wave. The impulsive wave, this time, extends more than 161.8% of the previous b-wave, making the entire second a-b-c an elongated flat. By definition, such patterns appear almost exclusively as the entire leg of a contracting triangle or as part of it. In this case, the elongated flat represents part of the leg of a future contracting triangle.
What is important here is that this is the first clue the Elliott Waves Theory offers regarding the possible formation of a triangle. Suppose the top-down analysis from the bigger timeframes suggested the possibility of a triangle (judging by the presence of the first x-wave). In that case, the elongated flat comes as confirmation that a triangle may, indeed, form.
After the second intervening x-wave, the new move lower is the start of a contracting triangle at the end of the triple combination, which is mandatory to be a non-limiting triangle.
Is the a-wave completed? For this, traders must go on the lower timeframes (weekly and daily) and continue the top/down analysis. But if the bigger timeframe analysis is flawless, the lower timeframes should confirm a corrective wave for the a-wave.
Judging by its structure so far, it is a complex correction with a small x-wave. Therefore, Elliott traders are already biased regarding what pattern the market forms as the first segment of a non-limiting triangle.
The b-b-b trendline plays an important role here. If the entire drop from 1.60 to the current market levels is an incomplete triple combination, the third b-wave must reach the vicinity of the projected b-b trendline – suggesting a reversal in the EURUSD bearish trend from recent years.
Conclusion
Triple combinations are not easy patterns to interpret and trade. Because of their complexity, they often discourage traders from searching for more details when using the Elliott Waves Theory.
The videos accompanying this article further explain the triple combination presented here. For the Elliott Waves-curious mind, they come to complement the theoretical aspects presented here and to provide more practical aspects of how to trade triple combinations in today’s currency market.
Future sections of this academy will show more details that can be used in interpreting triple combinations. Channeling with corrective patterns, for instance, will provide clues that shape the way complex corrections form.
To sum up, triple combinations often form on the currency market. By combining all the information given, the trader ends up positioning on the right side of the market.


