
473
Technical analysis is based on the art of interpreting past price movements to predict future ones. Financial markets are believed to be efficient; speculators would have no opportunities if that were true.
But efficiency comes in different forms and shapes. A market, for instance, may have a weak form efficiency, meaning that technical analysis does work.
In any case, ever since investors started charting financial markets’ moves, they began looking for patterns. The prices of financial assets react to different inputs, technical or fundamental, and technical traders believe that by documenting patterns, they have a competitive edge in interpreting future market moves. Thus, the chances of successful speculation increase with the successful interpretation of the technical analysis.
Bullish and bearish trends form often, but even more often, financial markets consolidate. Consolidations happen for various reasons.
Nowadays, the market is influenced by central banks’ actions and other economic events scheduled in advance. Therefore, if traders expect an important economic event to happen in the near future, such as the Federal Reserve of the United States meeting, which concludes on a Wednesday, the chances are that markets consolidate in the days prior to the meeting.
Triangles are the most common among all forms of price consolidation. Various triangles exist, such as limiting and non-limiting, contracting or expanding, running ones and even some special types.
But out of all, contracting triangles appear more often. Therefore, a complete understanding of contracting triangles provides insight into how most consolidations form.
This article covers different types of contracting triangles, how to interpret them, how to use the thrust of a triangle to find a target for a trade, interpret the apex of a contracting triangle and much more.
What Is a Contracting Triangle?
A triangle is a consolidation formed of five areas or segments. Ralph Elliott did a great job studying triangles back in the 1930s.
Since then, it has been accustomed to labeling the five segments of a triangle with the letters – a-b-c-d-e. For those familiar with the Elliott Waves Theory and how Ralph Elliott divided the market waves into impulsive and corrective ones, the five segments belonging to a triangle are all corrective – no exceptions.
It tells much about the price action during a triangle’s formation. Corrective waves or segments are more common than impulsive ones, and so we have an explanation for why triangles form so often.
As the name suggests, a contracting triangle “contracts.” In other words, the price action or the market’s volatility declines significantly in such a way that the charts show a contraction until the breakout point.
Think of the price action as a series of lower highs and higher lows. The market can’t rally and make a new higher high, but at the same time, all selloffs are bought before a new lower low appears.
To make it evident, technical traders use trendlines that show the contraction. By connecting the higher highs and higher lows, the triangle becomes evident.
Once again, labeling helps. By connecting the end of wave a with the end of wave c and projecting the resulting trendline on the right side of the chart, we have the so-called a-c trendline.
Furthermore, by connecting the end of wave b with the end of wave d and projecting the resulting trendline on the right side of the chart, we have the so-called b-d trendline.
We may, therefore, safely say that a contracting triangle is represented by the price action inside the a-c and b-d trendlines. So when does a contracting triangle end?
A move above the b-d trendline gives the breakout point. This is the trendline to keep an eye on and a move above or below the b-d trendline marks the end of the triangular consolidation.
The B-D Trendline
The beauty of consolidation is that it gives traders time to prepare for the breakout. Even on smaller timeframes, a contracting triangle gives traders the opportunity to end up on the right side of the market.
As mentioned earlier, the b-d trendline is the most important trendline in a triangle’s formation. This is valid in all types of triangles.
But traders should pay attention to correctly drawing the b-d trendline. Here are the rules for drawing and interpreting it right:
- Find the end of waves b and d.
- Draw a trendline connecting the two points and project it on the right side of the chart.
- Make sure that no parts of wave c pierce the b-d trendline.
- Wait for the price to break the b-d trendline.
- Measure the time it took the market to form wave e.
- Project the time from the end of wave e.
- The market must break the b-d trendline in less or the same time it took wave e to form.
As one can see, drawing and interpreting the b-d trendline is not an easy task. Things may get even more complicated when the triangle takes a lot of time to form.
For example, a triangle is formed of five segments, but that does not mean that the market will only have five waves in a triangular pattern. As the Elliott Waves Theory suggests, any segment may be a complex correction, such as a double three or even a triple three combination.
However, no matter how long a triangle takes to form, the rules for drawing and interpreting the b-d trendline remain the same.
One more thing – the price action that follows after the breaking of the b-d trendline is important, too. Most of the time, but not always, the market retests the b-d trendline.
If the market forms a limiting triangle, the price action should not retest the b-d trendline following its break. You can find more details about limiting triangles in the article dedicated to the subject and part of this trading academy.
Different Types of Contracting Triangles
The definition of a contracting triangle may be straightforward, but it does not mean that only one type of triangle exists. Just the opposite.
The retail trader is used to the classic horizontal contracting triangle, where all the segments in a triangle are smaller than the previous one. However, other types also exist; some appear quite often in the FX market.
Based on the length of the segments that make up a triangle, we may distinguish between the following types of triangles:
- Horizontal contracting triangle.
- Irregular contracting triangle.
- Running contracting triangle.
- Special types of contracting triangles.
Horizontal Contracting Triangles
A horizontal contracting triangle is characterized by all the segments being shorter than the previous one. Such a triangle may act as a continuation pattern and a reversal one. Out of the two, the latter is more often, at least in the currency market.
In other words, wave a, or the first segment in a horizontal contracting triangle, is the longest one. Also, wave b is shorter than wave a, but longer than wave c, and so on.
To define a horizontal contracting triangle, one may use the following: a>b>c>d>e. If the triangle does not respect this definition, then the market forms something else.
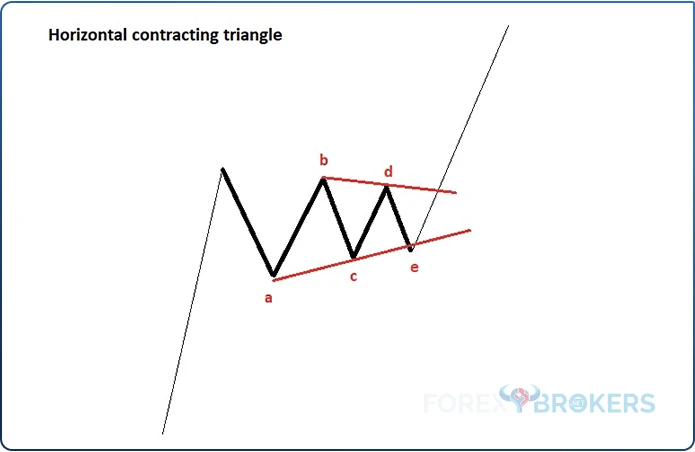
Horizontal contracting triangles may form as continuation patterns, as shown in the image above. Whenever this is the case, a horizontal contracting triangle is a pennant – a powerful continuation pattern during which the market consolidates tightly before the breakout.
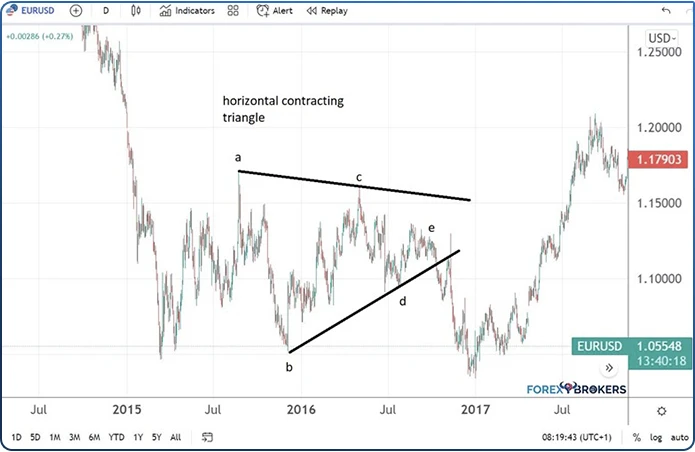
EUR/USD – Example of a Horizontal Contracting Triangle
Some of the most obvious horizontal contracting triangles formed on the EUR/USD daily chart some years ago. The bigger the timeframe, the stronger the implications for the overall market.
This triangle, in particular, was hard to miss for the simple reason that it took a long time to complete – almost two years. In other words, for close to two years, the EUR/USD formed only corrective waves.
This was at a time when the European Central Bank (ECB) eased the monetary policy aggressively. It even moved the key interest rate into negative territory, something unthinkable before that date.
As a result, the US dollar rallied.
Also, at that time, two major geopolitical events influenced financial markets. Both happened in 2016 and shaped financial markets for years to come – one was the Brexit referendum when the UK voted to leave the European Union and the other was Trump’s election as the President of the United States later that year.
As such, markets look for direction; whenever it is unclear what the next leg would be, a consolidation happens. Again, the favorite way for the market to consolidate is in a triangular pattern.
In this case, the EUR/USD formed a horizontal contracting triangle that ended with Trump’s election.
Check out our video about the Contracting triangles:
Guide for Contracting Triangle – A Forex Strategy Breakdown – ForexBrokers.net
Intermediate
Guide for Contracting Triangle – A Forex Strategy Breakdown – ForexBrokers.net
Trading the Thrust of a Horizontal Contracting Triangle
Triangles have multiple uses for technical traders. One is to trade the pattern itself, and another one is to interpret it as part of the bigger picture or part of a trading theory, such as the Elliott Waves Theory.
When traded alone, the focus is on the thrust of the triangle. By definition, the thrust is the minimum distance the market must travel after the triangle’s end to confirm the triangular formation.
Therefore, by the time the market breaks the b-d trendline, traders focus on the thrust of the triangle. The thrust has different lengths, depending on the type of triangle – this is why it is important to know the different types of triangles that the market may form.
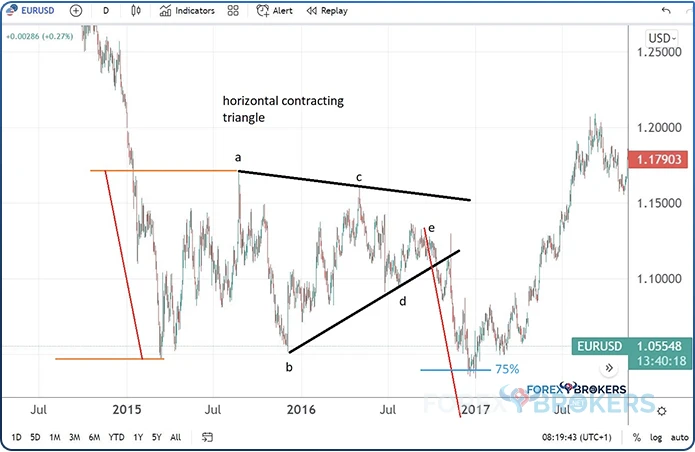
A horizontal triangle’s thrust is 75% of the longest segment, projected from the end of the triangle. Because wave a is the longest segment in the pattern, it is used for calculating the thrust of the horizontal contracting triangle.
To do so, one needs to measure the length of wave a. It can be done by using a Fibonacci retracement tool and finding the 75% distance.
Next, after the market breaks the b-d trendline, the thrust is projected from the end of the triangle. It gives the minimum distance the market should travel to confirm the pattern.
Sometimes, the market retests the b-d trendline after the initial break, like in the example below. The retest happens most of the time, but it is not mandatory. Therefore, waiting for the retest before targeting the thrust of the triangle is not recommended.
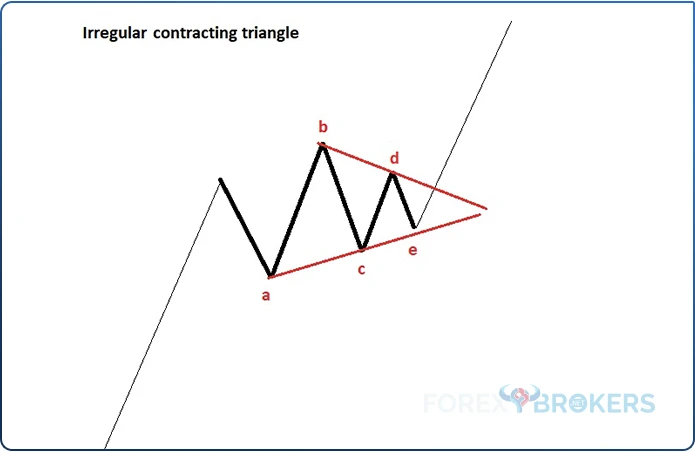
Irregular Contracting Triangles
While every retail trader has heard of a horizontal contracting triangle, these are not the most common ones to appear on the FX market. Instead, irregular contracting triangles form more often.
An irregular contracting triangle forms on the horizontal as well. However, it breaks the definition of the horizontal contracting triangle by the simple fact that one segment is longer than wave a. That is wave b.
Therefore, an irregular contracting triangle is defined by wave b being longer than wave a in other words: a< b> c> d> e.
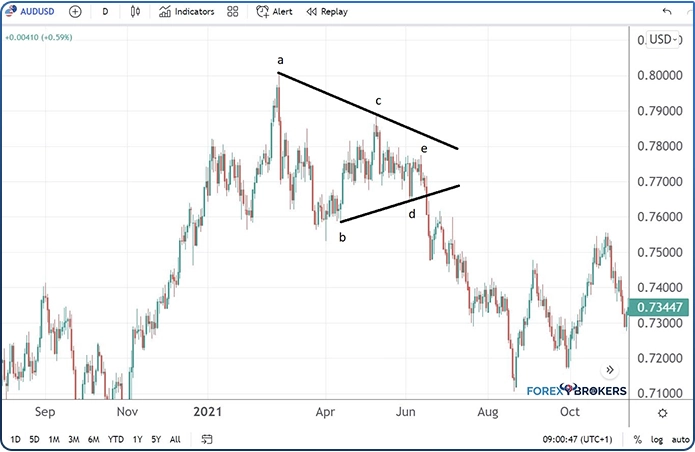
Example of an Irregular Contracting Triangle – AUD/USD
In 2021, the AUD/USD pair topped at 0.80. The pair advanced together with the US equity market as the US dollar was sold across the board.
However, after reaching 0.80, the market could not break higher again. Instead, it formed a series of lower highs and higher lows, typical of a contracting pattern.
Note that the triangle acted as a reversal pattern, and by the time the price broke below the b-d trendline, the consolidation ended.
A contracting triangle acting as a reversal pattern appears more often than one acting as a continuation pattern – at least in the case of the Elliott Waves Theory. More about that will be covered in the last part of this article.
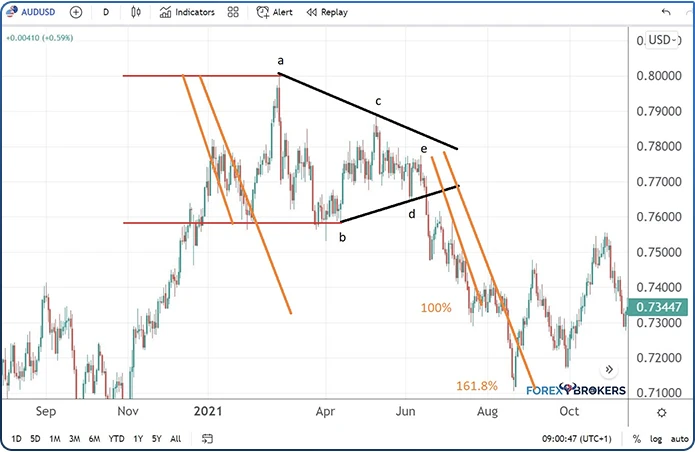
Trading the Thrust of an Irregular Contracting Triangle
Unlike the thrust of a horizontal contracting triangle, this one is much longer – between 100% and 161.8% of the longest segment. In other words, technical traders measure the length of the longest segment (i.e., wave b) and calculate 100% of it as the minimum distance that the market should travel to confirm the irregular contracting triangle.
First, to trade the thrust of an irregular contracting triangle, calculate 100% and 161.8% of the wave b’s length. Next, project the two lengths from the end of the e-wave after the price has already broken below the b-d trendline.
Finally, set a stop-loss order at the end of wave e. The market should not turn around and reach that level until the minimum distance required by the thrust is reached.
As for the take-profit, staying short beyond 100% of wave b is risky. Therefore, one way to solve it is to book half of the profits by the time the market reaches 100% of wave b and move the stop-loss order to break even. Next, book the other half as the market comes closer to the 161.8% target.
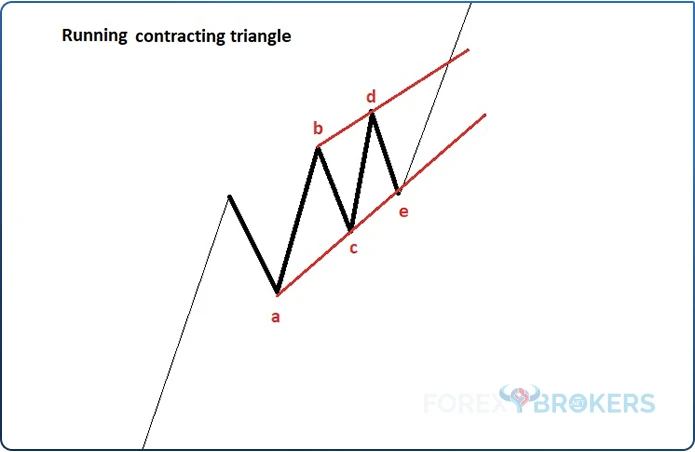
Running Contracting Triangles
Perhaps one of the most controversial triangles, a running contracting triangle, is not as rare as many might think. In fact, it forms quite often in the FX market.
Regardless of its shape, the rules of a triangle remain the same – all segments are corrective. However, unlike other triangles mentioned so far in this article, a running triangle is trending with the market.
Another difference is that this type of triangle is always a continuation pattern. It is defined by wave b being longer than wave a and wave d being longer than wave c. More precisely: a< b> c< d> e.
So, why the name “running”? The explanation comes from the fact that the triangle ends higher (in a bullish trend) than its starting point. Hence, it “runs”, meaning the market is trending.
The running concept is a tricky one in technical analysis. Elliott Waves traders know that a new wave starts by the time a running triangle ends. But, since the running triangle ends higher than the starting point of the triangle, counting the waves is tricky.
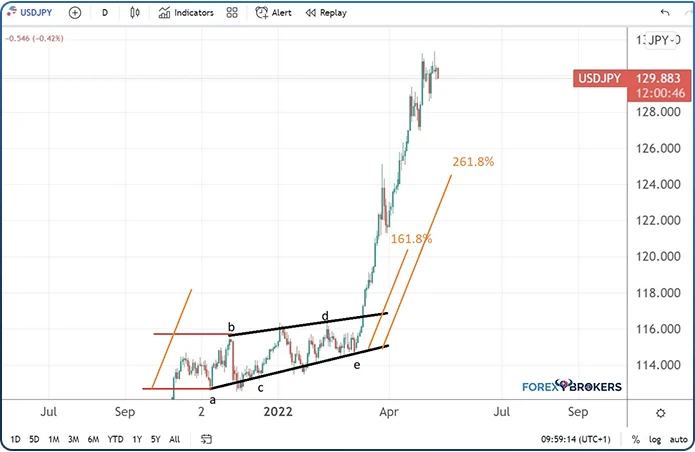
Example of a Running Triangle – USD/JPY
The perfect example of a running triangle comes from the USD/JPY daily timeframe. In the first part of 2022, this market broke higher almost vertically.
At the start of the COVID-19 pandemic, central banks worldwide eased their monetary policy. Moreover, governments joined in easing the fiscal policy too.
As a result, inflation jumped to extreme levels in the advanced economies. Faced with an unsustained rise in the prices of goods and services, major central banks started to tighten their monetary policy (e.g., the Federal Reserve and the Bank of England).
But not the Bank of Japan. This one did just the opposite – it doubled down on the easing path, thus diverging from what the rest of the world did.
What followed was a sharp depreciation of the local currency – the Japanese yen. Because the central bank announced that it would buy unlimited amounts of government bonds in an effort to control the yields, the yen sold aggressively even if the US stock market tanked. The two are typically correlated, but that correlation ended abruptly.
But before breaking higher, the market consolidated for a while. Traders had a few months to interpret the pattern, and those who knew how a running triangle looked had a tremendous advantage.
Looking at the triangle below, one may note that the market pierces the b-d trendline before the triangle’s break. Is this allowed?
The answer is yes. Remember the rule – no parts of wave c should pierce the b-d trendline. Well, the trendline is pierced by parts of wave d, not c; thus, the rule is not invalidated.

Trading the Thrust of a Running Contracting Triangle
A running triangle is the most powerful contracting triangle one may encounter in technical analysis. Its thrust is between 161.8% and 261.8% of the longest segment (i.e., wave b), and the move following the break of the b-d trendline is usually explosive, almost vertical.
The technical trader should follow the same steps to trade the thrust of a running triangle. First, determine the minimum distance the market should travel – 161.8%. Next, find out the next level of interest – 261.8%.
Moving forward, project them from the end of wave a and wait for the price to break the b-d trendline. After the breakout, place a stop-loss order at the end of wave e and stay for the first target – 161.8% of wave b, projected from the end of wave e. This is the minimum distance that the market should travel to confirm the running triangle.
Conservative traders book half of the profits by the time the market reaches 161.8% and move the stop-loss order to break even. Finally, traders typically exit the trade when the price comes closer to 261.8%.
As can be noticed, the thrust of a contracting triangle has a different length depending on its type. The longest one is the thrust belonging to a running triangle.
Special Types of Contracting Triangles
There is also a special category of contracting triangles that should be mentioned here. These triangles are “special” because some rules that define a triangle are changed.
Many triangles fit into this category, but we will mention only one because it resembles a pattern known by any retail trader – a head and shoulders. Therefore, from now on, whenever you see a head and shoulders pattern, think of it as being, in fact, a special type of contracting triangle.
Focus on the image below. It shows some price action that regularly forms on the FX market. What does it look like?
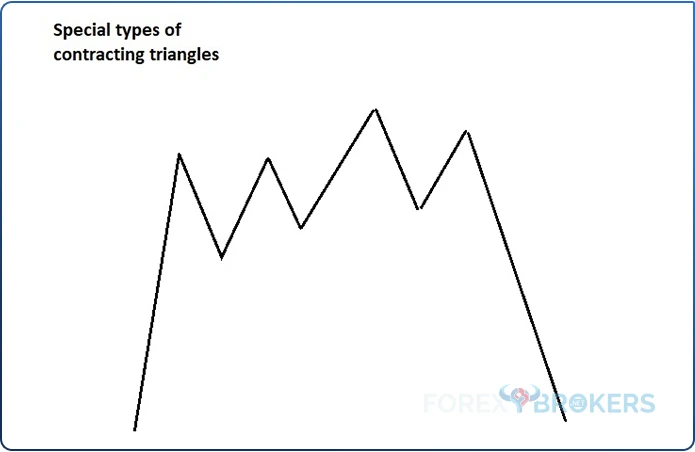
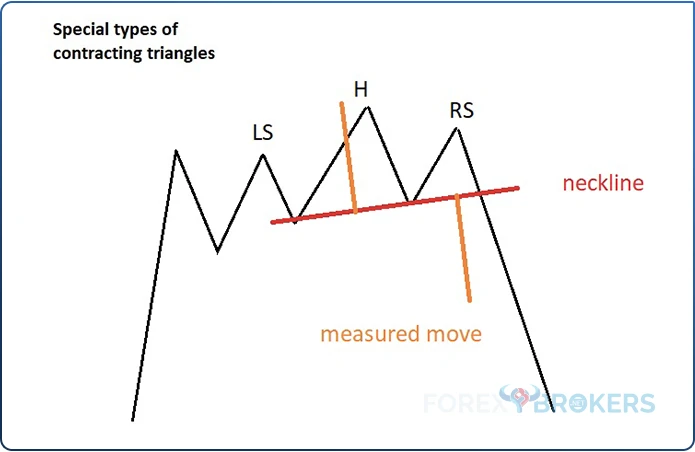
Sure enough, it looks like a head and shoulders pattern. A head and shoulders are formed out of two shoulders and one head, resembling the human body’s upper part.
A neckline is drawn at the support area, just below the two shoulders. The neckline should clearly define the pattern; once broken, it opens the gate to the measured move.
As seen in orange in the picture below, it represents the minimum distance the market should travel after a head and shoulders formation.
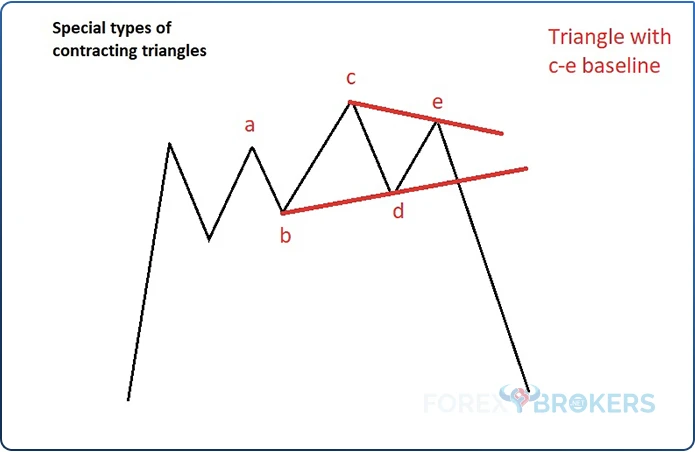
But we can also talk about a triangular pattern. A special type of contracting triangle is called a triangle in a c-e base.
The triangle acts as a reversal pattern, and once completed, the thrust gives the minimum distance for the market to reach. The b-d trendline acts similarly, only that instead of the classic a-c trendline, this special type of triangle has a c-e trendline. However, in the end, it is nothing but a triangle.
In the end, one may ask, who cares if the market formed a head and shoulders pattern or a special type of triangle, as long as both patterns point in the same direction? The right answer is that correctly interpreting such triangles helps to better understand the Elliott Waves Theory.
Techniques for Trading Special Types of Contracting Triangles – ForexBrokers.net
Intermediate
Techniques for Trading Special Types of Contracting Triangles – ForexBrokers.net
Contracting Triangles within the Elliott Waves Theory
The last part of the article focuses on the role of contracting triangles as part of the Elliott Waves Theory. Several articles in this trading academy discuss the theory in more detail.
Because of that, the focus here will be on where contracting triangles form and what to expect next.
Simple Corrections
The Elliott Waves Theory divides market moves into impulsive and corrective ones. Impulsive waves are also called five-wave structures, and corrective waves are called three-wave structures.
However, a triangle has five waves or segments, called a three-wave structure. This is because Ralph Elliott, who developed the theory, wanted to emphasize that all five segments in a triangular pattern are corrective.
As simple corrections, triangles rarely form. If they do, they are either the 4th wave in an impulsive move or the b-wave in a zigzag. For instance, a triangle cannot be the 2nd wave of an impulsive move, or the b-wave of a zigzag.
Therefore, whenever the Elliott trader sees a triangular formation, the likelihood is that it is part of a complex correction because the two situations mentioned above are quite rare.
When triangles do form as simple corrections, they are limiting triangles. In other words, the price action that follows such a pattern is limited in nature, meaning that even if the market forms a new high or low, a reversal is imminent.
Consider an impulsive wave. If a triangle is the 4th wave, then immediately after the 5th wave comes and a reversal is imminent. The same is valid for a triangle that acts as the b-wave of a zigzag – after the c-wave completes, the market gives up most of its gains.
Contracting Triangles Part of Complex Corrections
While triangles are rarely simple corrections, they are very often part of a complex correction. They act as an intervening wave, also called an x-wave, or mark the end of a complex correction.
As a rule of thumb, a triangle never appears at the start of a complex correction – it is either an intervening wave or marks the end of it.
Because Elliott identified multiple complex corrections, he divided the category into two parts: complex corrections with a small x-wave and another sub-category called complex corrections with a large x-wave. The length of the x-wave is interpreted in relation to the previous correction.
If the x-wave is shorter than 61.8% of the previous correction, the market forms a complex correction with a small x-wave. Conversely, if the x-wave exceeds 61.8% of the previous correction, the market forms a complex correction with a large x-wave.
Where Does a Triangle Fit?
A triangle may act as a continuation or a reversal pattern as part of complex corrections, depending on the complex correction’s nature.
In complex corrections with a small x-wave:
- Double combination:
- A triangle may form either as the x-wave or the last part of the double combination. Out of the two, the second one is much more common.
- Triple combination:
- A triangle may appear as any of the two x-waves or the last part of the triple combination. Out of these options, the last one is much more common.
- Double zigzag:
- A triangle may form as the x-wave.
- Triple zigzag:
- A triangle may form as any of the two x-waves.
- Double flat:
- A triangle may form as the x-wave.
- Triple flat:
- A triangle may form as any of the two x-waves.
In complex corrections with a large x-wave:
- Double three:
- A triangle may appear as the intervening x-wave.
- Double three combination:
- A triangle may form as the intervening x-wave and must appear as the last part of the double three-combination.
- Triple three:
- A triangle may form as any or both of the intervening x-waves.
- Triple three combination:
- A triangle may form as either one or both of the two intervening x-waves and must appear as the last part of a double three combination.
- Double three running:
- A triangle may appear as the last part of the double three-running.
- Triple three running:
- A triangle may appear as the last part of the triple three-running.
What Is the Apex of a Contracting Triangle
One of the features of a contracting triangle with many uses in technical analysis is its apex. The apex is given by the triangle’s contracting nature.
Because of that, if projected on the right side of the chart, the two trendlines will eventually meet. That point is called the apex of a contracting triangle.
Not all triangles have a useful apex, though. If the two trendlines, the a-c and the b-d, are close to parallel rather than contracting sharply, the apex is not useful because the two trendlines will meet far away on the right side of the chart.
Typically, this feature belongs to non-limiting triangles, where the apex has little or no impact in interpreting the contracting triangle.
How to Use the Apex?
The apex is very important in technical analysis. This trading academy has an entire article related to limiting triangles and the apex plays a crucial role in interpreting a limiting triangle. More importantly, in trading a limiting triangle.
For example, one of the many conditions of a limiting triangle is that it must end before 20%-40% of the apex. Therefore, before anything, one needs to be able to find the apex. Next, measure the time from the start of the triangle until the apex and find out if the triangle ended before the time limit imposed by the Elliott rule.
Another important feature of the apex is that it provides tremendous horizontal support and resistance. To find the level, first find the apex, as explained earlier. Next, draw a horizontal line through the apex. The line should act as strong support or resistance, depending on the triangle's nature and the market’s direction.
Finally, the time zone of the apex is also important in technical analysis. To use it, find the apex first and then draw a vertical line through it.
The vertical line acts as the time element in confirming certain patterns, such as the thrust of a limiting triangle. The thrust is a triangle’s measured move and the market should reverse sharply when it reaches the timezone of the apex.
Decoding Running Contracting Triangles and the Definition of Apex – ForexBrokers.net
Intermediate
Decoding Running Contracting Triangles and the Definition of Apex – ForexBrokers.net
Conclusion
It is not the first time we have treated triangles in this trading academy, but this article went further with the analysis. Because contracting triangles often form, they are part of many technical analysis patterns and trading theories.
The best way to understand a contracting triangle is through the optics of Elliott Waves Theory. It is there where each leg of a contracting triangle is described thoroughly. Also, the labeling helps too.
As this article showed, contracting triangles appear everywhere. They can act as both continuation and reversal patterns and are part of both classic technical analysis patterns and Elliott Waves Theory.
To sum up, if there is one pattern to study in technical analysis, that is the contracting triangle. Focus on the b-d trendline’s break, which marks the consolidation's end.
Related Lessons


See more from this category