Ralph Elliott developed the Elliott Waves Theory in the mid-1900s. At first, traders used it only with stocks and commodity markets because the other financial markets we know today did not exist back then.
The theory is based on interpreting different market cycles to forecast where the market might go next. Unfortunately, cycles of various degrees make it difficult to distinguish between impulsive and corrective waves – the backbones of the Elliott Waves Theory.
An impulsive wave, said Elliott, is a 5-wave structure. Thus, Elliotticians (i.e., traders who use the Elliott Waves Theory to count the market waves) label these waves with the numbers 1 to 5.
Elliott later discovered that another structure besides impulsive waves exists. In contrast to impulsive waves, these are corrective waves, which are labeled with letters, starting with the letter “a”.
This article focuses on corrective waves and, more specifically, on a particular type of corrective wave. So far in this trading academy, we have covered the corrective patterns within the Elliott Waves Theory multiple times. First, Elliott distinguishes between simple and complex corrections, and then he subdivides the complex corrections into more categories.
One of those categories is the subject of this article – horizontal complex corrections. Unfortunately, these corrections often form in the currency market, and spotting them right off the bat is difficult.
Already by now, the reader should have an educated guess about what to expect next. Of course, any complex correction has at least 1 intervening wave, so we will discuss the nature of these waves, too. More importantly, this article focuses on where to expect horizontal complex corrections to form, what the implications of such a correction are, and what follows next.
Horizontal Complex Corrections – Definition
A complex correction, as defined by the Elliott Waves Theory, is one that has a large x-wave. Complex corrections are split into 2 main categories – those with a small x-wave and those with a large one.
In other words, the x-wave’s length tells the Elliott trader what to expect next. The correct labeling of a correction is relevant for the overall interpretation, as it offers the trader an educated guess regarding the next move to come.
For example, suppose the x-wave suggests that the market is forming a triple combination. In that case, the 1st scenario is that the larger degree pattern is a triangle, because triple combinations appear almost exclusively in a triangle. When they do, they are typically the longest leg of the triangular pattern and never fully retraced by a wave of the same degree.
Therefore, the correct labeling of a complex correction is critical for the overall Elliott Waves analysis. In a complex correction with a small x-wave, the x-wave’s length must not exceed 61.8% of the previous a-b-c structure. In a complex correction with a large x-wave, the x-wave must be larger than the previous correction (price-wise).
This is the difference between the 2 categories, and some things are worth mentioning before looking at some examples. One is that the x-wave must be larger than the entire area covered by the previous a-b-c correction. Another is that complex corrections with a small x-wave are much more common than complex corrections with a large x-wave.
This is not the only time in this trading academy when we discuss complex corrections with a large x-wave. Running corrections also have a large x-wave that satisfies the condition mentioned above, but a running correction ends higher (in the case of a bullish trend) or lower (in the case of a bearish trend) than the point where the correction started.
How to Identify a Complex Correction with a Large X-wave
As mentioned above, a complex correction with a large x-wave must have an x-wave so large that it fully retraces the entire price territory of the previous a-b-c. However, it must end below (in a bullish trend) or above (in a bearish trend) the start of the 1st a-wave. Otherwise, it would be a running correction.
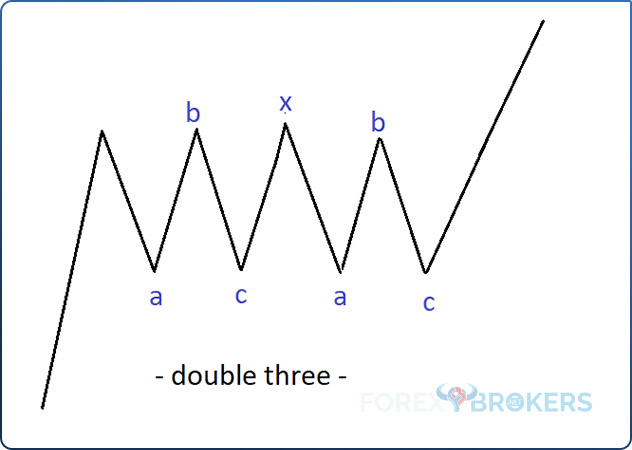
Here is an example of such a correction. This is called a double three pattern, and the thing to note here is that the x-wave, or the intervening wave, exceeds the highest point in the b-wave slightly. Also, the b-wave is longer than the a-wave, but for the pattern to be called a double three, the x-wave must exceed not only the starting point of the a-wave but also the highest point in the b-wave.
To sum up, what we have discussed so far, let’s list the main points. A horizontal complex correction has:
- 1 or 2 intervening waves (the x-waves).
- An intervening wave that exceeds the highest/lowest point in the previous a-b-c correction.
- An ending point below (in a bullish trend) or above (in a bearish trend) is the point where the entire correction started.
Types of Horizontal Complex Corrections
4 types of horizontal complex corrections exist:
- Double three
- Double three combination
- Triple three
- Triple three combination
Double Three
A double three pattern forms on the horizontal, but it can be a tricky pattern. In other words, it may give the impression of a running pattern, and because of that, it can be misleading.
The correct labeling of a double three is a-b-c-x-a-b-c. As the name suggests, a double three is formed by 2 a-b-c patterns connected by a large x-wave. If we consider the 3 types of simple corrections that Ralph Elliott identified (flat, zigzag, triangle), the 2 a-b-c patterns can be either flats or zigzags. However, because of the way a zigzag forms, it is unlikely to figure this out during a double three pattern. Therefore, we can assume that almost always, a double three is formed by 2 flat patterns connected by 1 large x-wave.
This means that during the entire complex correction, there are only 2 impulsive waves (i.e., 2 c-waves belonging to flat patterns), while the rest are corrective. Once again, the image below shows how a double three pattern typically forms during a bullish trend.
This pattern is unusual in any position except the b-wave of a zigzag or as a smaller x-wave.
Note here how the correction forms on the horizontal and that by the time it ends, the bullish trend resumes. But in this form, a double three pattern is rare. Even in the FX market, which is known for consolidating a lot on cross pairs, this pattern is rare.
However, there is a variation of it that forms quite often and gives the impression that the correction is a running one, but it isn’t.
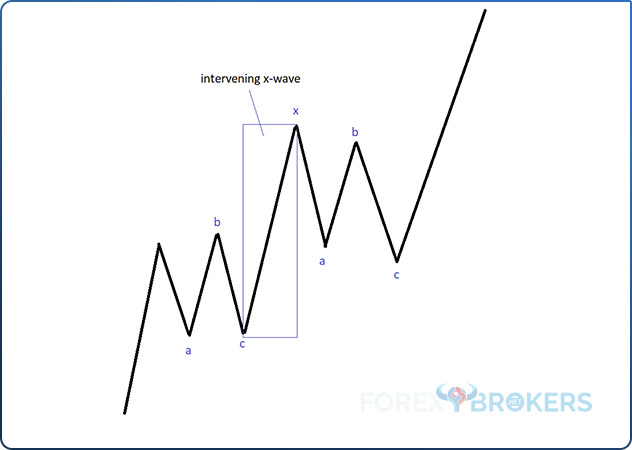
The image above shows a more likely double three pattern, one that appears more often. It has a large x-wave, one that is much larger than the 1st a-b-c. However, the 2nd a-b-c ends below the point where the double three began, meaning that the correction is not running.
Double Three Combination
A double three combination is similar to a double three pattern, with the exception that the 2nd correction is a triangle and not a flat. Because of that, the correct labeling of a double three combination is a-b-c-x-a-b-c-d-e.
The reader has probably noticed that the x-wave’s length is the only difference between a double combination and a double three combination. A double combination has a small x-wave, one that doesn’t retrace more than 61.8% of the 1st a-b-c, while a double three combination has a large x-wave.
The same is valid if we compare a double flat with a double three pattern. A double flat pattern has a small x-wave, one that doesn’t retrace more than 61.8% of the 1st a-b-c, while a double three has a large x-wave.
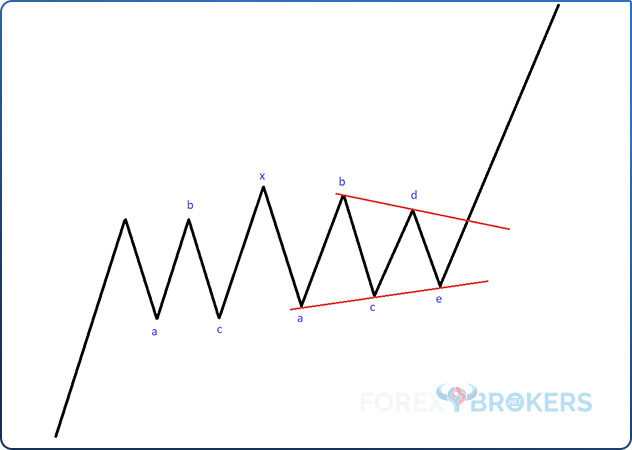
A double three combination is much more common than a double three pattern. The simple fact that it ends with a triangle is enough to explain it, because triangles are the most common corrective patterns. Note here the 2 characteristics of a correction with a large x-wave: the x-wave is larger than the 1st a-b-c, and the triangle ends below the starting point of the entire pattern.
Triple Three
When a double three pattern is extended with 1 more correction, a triple three forms. All of the rules mentioned so far are valid in a triple three pattern as well. The only difference between a double and a triple three is that a triple three has 2 intervening large x-waves needed to connect the three corrections.
The correct labeling of a triple three pattern is a-b-c-x-a-b-c-x-a-b-c. The 2 x-waves may be simple or complex corrections, and because they must be large, it is literally impossible for them to be a triangle.
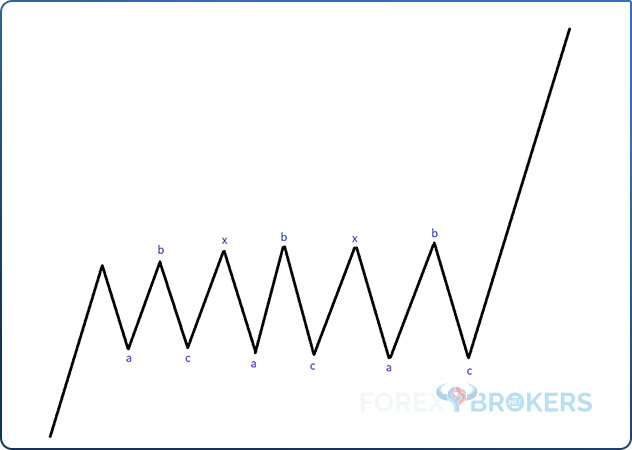
Triple Three Combination
A triple three combination ends with a triangle, and therefore the correct labeling is a-b-c-x-a-b-c-x-a-b-c-d-e. Elliott categorized triangles into limiting and non-limiting types, and in the case of a triple three combination, there is always a non-limiting triangle that ends the pattern.
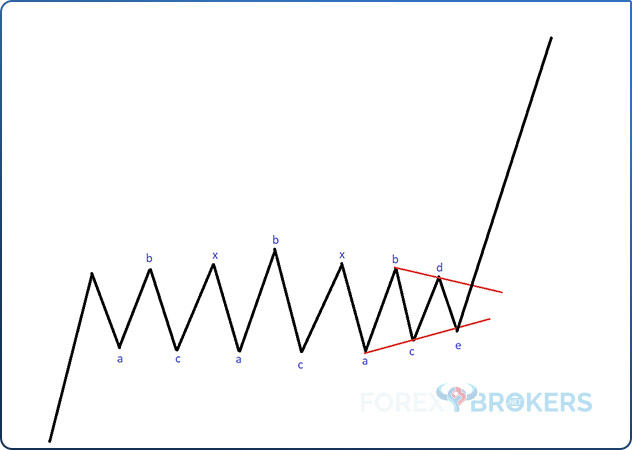
A triple three combination is more common than a triple three for the same reason – it ends with a triangle, and triangles are common patterns. But out of the 4 horizontal complex corrections that we have mentioned in this article, this is the 3rd-most common.
Almost always, when the market forms a horizontal complex correction, it forms a double three combination. If we use percentages, think of the 80%–20% rule. In 80% of cases, when the market forms a horizontal complex correction, it forms a double three combination. The rest of the time, it may form, in this order, a double three, a triple three combination, or a triple three.
Before going into more detail, remember that reality and theory differ. For example, rarely will you find a correction that forms perfectly horizontally. The x-wave’s length often alters the pattern in such a way that makes it difficult to recognize by the theoretical rules.
Where Do Horizontal Complex Corrections Form?
Whenever a corrective wave forms, a horizontal complex correction may appear. However, there are 2 particular locations where a horizontal complex correction forms more often – the 2nd wave of a 3rd-wave extension impulsive move and the b-wave of a zigzag. In both cases, they are continuation patterns, so if you’re labeling a horizontal complex correction at the top or bottom of a trend, chances are that the labeling is incorrect.
Horizontal Complex Corrections as the 2nd Wave of an Impulsive Structure
An impulsive wave has 2 corrective segments – the 2nd and the 4th waves. In theory, a horizontal complex correction may form as both the 2nd and the 4th waves. In reality, it almost always appears as the 2nd wave of an impulsive structure.
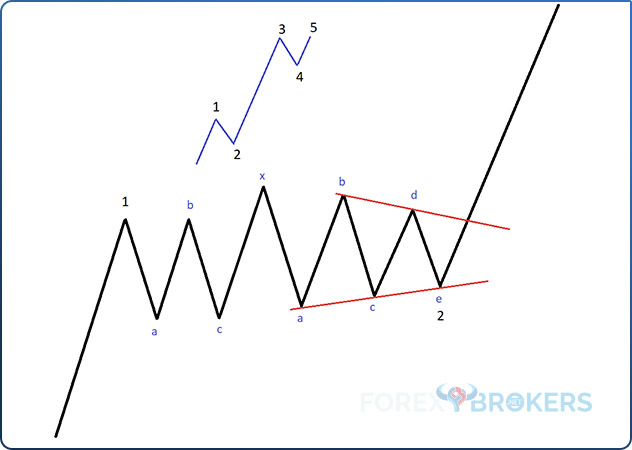
Whenever that is the case, the trader knows in advance what will follow. Because a horizontal complex correction almost always ends with a triangle, as is the case with a double three combination, the trader knows that the pattern will be time-consuming.
The longer it takes for the 2nd wave to form, the stronger the following 3rd wave will be. Because of that, horizontal complex corrections form almost exclusively as the 2nd wave in a 3rd-wave extension and almost never as the 4th wave.
The focus here should be on the contracting triangle and the b-d trendline. Once the price breaks the b-d trendline, the Elliott trader already knows the trade details and what to expect next.
After the price breaks the b-d trendline, a stop-loss order must be set at the end of the e-wave, which marks both the end of the triangle and the end of the horizontal complex correction. For a take-profit order, the trader must measure the 1st wave and figure out the 161.8% extension. By projecting this from the end of the e-wave, the trader can determine the take-profit level, as this is the minimum distance that the market must travel.
Additionally, the principle of alternation helps with trading at the end of the impulsive wave. This principle states that the 2 corrective waves in an impulsive structure must differ in complexity, structure, time, or distance traveled during the corrective phases.
Because horizontal complex corrections are time-consuming and complex, the 4th wave is usually the opposite – it takes far less time and is usually a simple correction. Therefore, by labeling a horizontal complex correction in the 2nd wave of an impulsive structure, the trader knows what the market will do next and can easily trade the future market moves.
Horizontal Complex Corrections as the B-wave of a Zigzag
Another common place where a horizontal complex correction may appear is the b-wave of a zigzag. A zigzag is a simple correction formed by 3 segments with 2 impulsive waves (waves a and c) and 1 corrective (wave b).
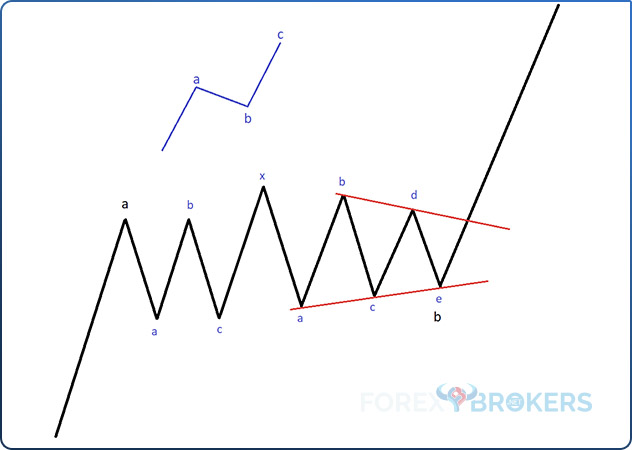
When a horizontal complex correction appears as the b-wave of a zigzag, the trader also knows what will come next. The trading setup is somewhat similar to the one explained previously, with a few exceptions.
The stop-loss level is the same – the end of the e-wave, which marks the end of the triangle and of the double three combination. The entry is also the same – the breaking of the b-d trendline.
What differs is the way we set the take-profit, and we can do that by applying the rules of a zigzag pattern. In a zigzag, the b-wave must retrace a minimum of 1% of the a-wave, and the c-wave should form in the same amount of time that it took the a-wave to form.
In other words, we may set the take-profit using the element of time rather than the length of the c-wave. In principle, the c-wave may have 3 possible lengths – less than 61.8% of the a-wave, more than 61.8%, and more than 161.8%. As Elliott traders, we do not know in advance the length of the c-wave, but we do have the element of time, which helps. All we have to do is to stay in the trade until the time expires. For this, we should measure the time that it took the a-wave to form and project that from the end of the horizontal complex correction.
Examples of Horizontal Complex Corrections
The 1st half of the article was dedicated to explaining the concept of a horizontal complex correction and the respective rules. Also, we mentioned that the double three combination is the most common type of horizontal complex correction of the 4 that the market may form. Finally, we discussed the most likely places where it may appear and how to trade it.
The following sections of this article are dedicated to examples from the currency market. Armed with the theoretical rules, you can now apply them in the market by counting some waves.
AUDUSD – Labeling a Horizontal Complex Correction
Horizontal complex corrections may not be so obvious when they form, and often, the Elliott trader is aware of their presence only after the fact. However, even so, they provide valuable information to traders because of the places where they form as part of an Elliott pattern.
Our 1st example comes from the AUDUSD daily chart. Back in 2015, the AUDUSD pair dropped below 0.80 and then consolidated for a while around the pivotal level. It is not unusual for a currency pair to consolidate in the vicinity of round numbers, as traders often place their take-profit or stop-loss orders at such points.
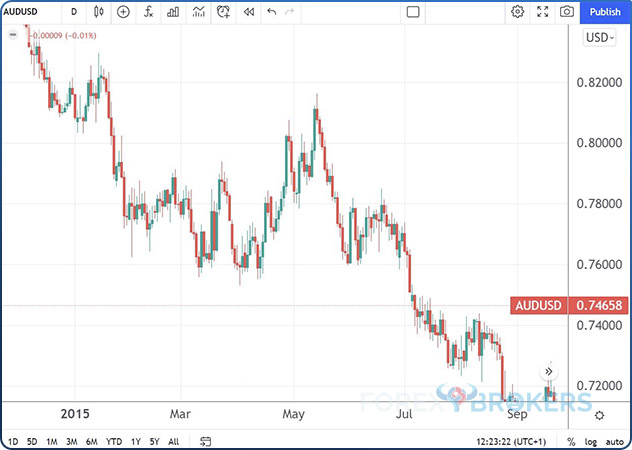
In this case, we see the AUDUSD dropping below 0.8 at the start of the trading year and then finding support at the 0.76 area. It traded between these 2 levels for almost half a year, in a horizontal consolidation.
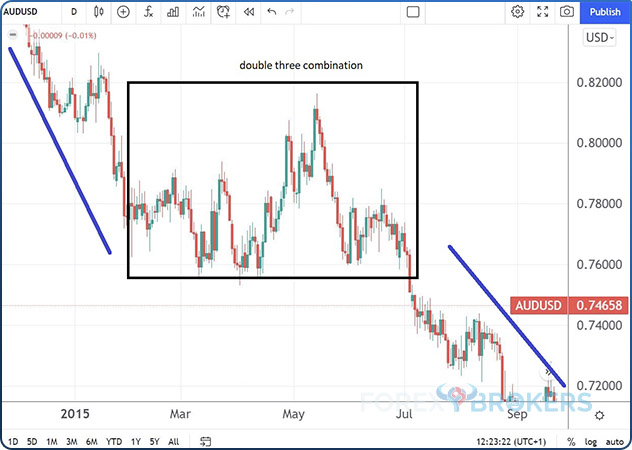
The complex correction wave is visible below. We see that a bearish trend is in place, and the market consolidated for a while before the trend resumed. The price action inside the black rectangle is nothing more than a double three combination pattern.
A Quick Guide on How to Label the Pattern
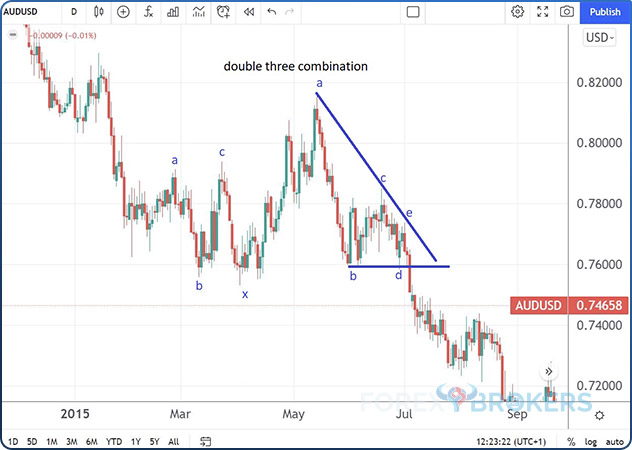
From left to right, let’s start labeling the pattern. We see the market bouncing from the 0.76 area for the 1st time in what seems to be a clearly corrective structure. That would be the a-wave.
The b-wave that follows is strong enough that it fully retraces the previous wave. This is also a corrective pattern, most likely an elongated flat, if we judge it by the long 2nd segment.
Moving forward, the market reverses again, and the price action fully retraces the b-wave too. It forms a so-called irregular flat pattern for the 1st part of the complex correction.
After the irregular flat ends, the x-wave fully retraces the entire a-b-c. This is necessary in a horizontal complex correction, as the x-wave, or the intervening wave, connects the 2 simple corrections.
Following the x-wave, the market forms a contracting triangle. The Elliott trader should therefore follow the rules of a contracting triangle when labeling it, with the focus being on the b-d trendline. When the price breaks the b-d trendline, the pattern ends.
In this case, when the AUDUSD broke below the b-d trendline, or below 0.76, the double three combination ended. As mentioned earlier in the article, a double three combination forms mostly as the 2nd wave of an impulsive move, and thus the move that follows should be powerful. As such, it should come as no surprise that the price quickly dropped several hundred pips shortly after.
EURGBP – Another Double Three Combination
Our next example comes from the EURGBP daily chart. This is one of the most important cross pairs on the FX dashboard. As a quick reminder, a cross pair is a currency pair that doesn’t have the U.S. dollar in its componence, and it tends to consolidate more than dollar pairs.
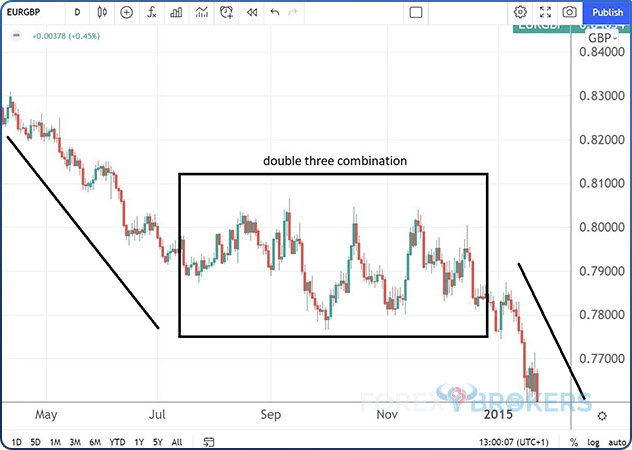
The EURGBP cross pair was in a bearish trend in 2014 as it fell from 0.83 to 0.80. Once again, the round number played a pivotal role, as the pair consolidated for several months just below it. Can you spot the pattern just by looking at the “naked” chart? Once again, this is a double three combination.
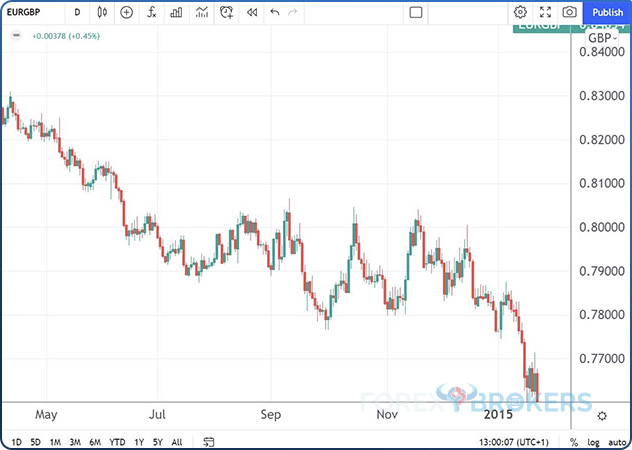
The market drops below 0.80 during a bearish trend and then consolidates on the horizontal for several months. The price action indicates a possible double three combination, especially if we judge it by the last segments.
Labeling the Double Three Combination
A double three combination always ends with a triangle, and it is the most common horizontal complex correction that forms. As such, we should always look for a triangle first, and only if we cannot identify one should we move on to searching for another pattern.
From the 1st time the price reached 0.79, it bounced up in a corrective nature. The upward move, spanning over 100 pips or so, represents the 1st segment of the double three combination pattern – the wave.
According to the rules of a double three combination, the b-wave should retrace a minimum of 61.8% of the previous a-wave. In this case, the b-wave retraces almost the entire a-wave, thus satisfying the condition.
Moving forward, the c-wave is strong enough that it fully retraces the previous segment. The entire a-b-c is a flat pattern with a strong b-wave. This is called a common flat pattern and represents the 1st section of the double three combination.
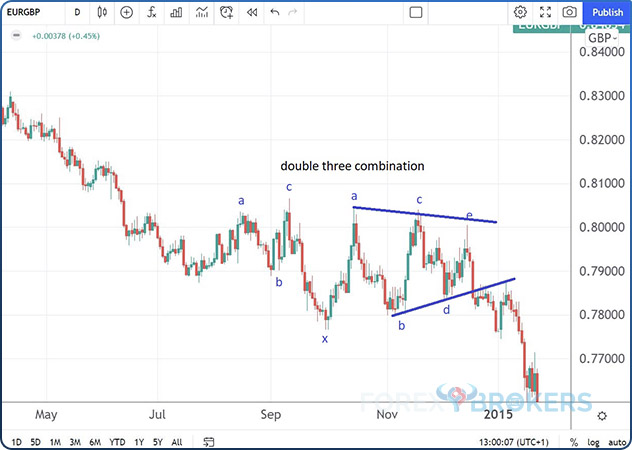
What follows is the x-wave. The market turns once again, tripping the stops below 0.79 in a move that resembles an impulsive wave. Such violent price action is normal during the formation of an x-wave, as this is a corrective wave that typically forms in a zigzag or a zigzag family pattern.
Following the x-wave is a triangle. The triangle at the end of a complex correction is a non-limiting one, meaning that the price action that follows the market breaks the b-d trendline and has no boundaries. Also, the market typically retests the trendline after breaking it, although this is not a mandatory condition.
What is important in a triangle is that no part of the c- and e-waves pierces the b-d trendline. Also, the price should break the b-d trendline in less than the time it took the e-wave the form. If these 3 conditions are met, the Elliott trader has labeled the triangle correctly.
We see that the price action breaks below the b-d trendline and then retests it. The retest represents the perfect place to short the EURGBP cross pair.
How about the stop-loss level?
A double three combination can either be the 2nd wave of an impulsive move or the b-wave of a zigzag. In both cases, the trader should set the stop-loss order at the end of the triangle. The end of the triangle is the highest point in the e-wave. As such, a proper stop-loss order for a short trade is the 0.80 area. If the market is strong enough and reverses above 0.80, the labeling is incorrect. More precisely, either the triangle is incomplete, or the market is forming a triple three pattern.
Putting the Pattern into Context
So far, we’ve presented 3 examples of double three combinations – 1 on the AUDUSD pair and another 1 on the EURGBP pair, also seen below.
But there is more to labeling Elliott Waves than just labeling 1 pattern. The aim here is to put the process into context so you can identify trades.
We have 2 options for the double three combination – the 2nd wave of an impulsive move or the b-wave of a zigzag. Let’s discuss them both here.
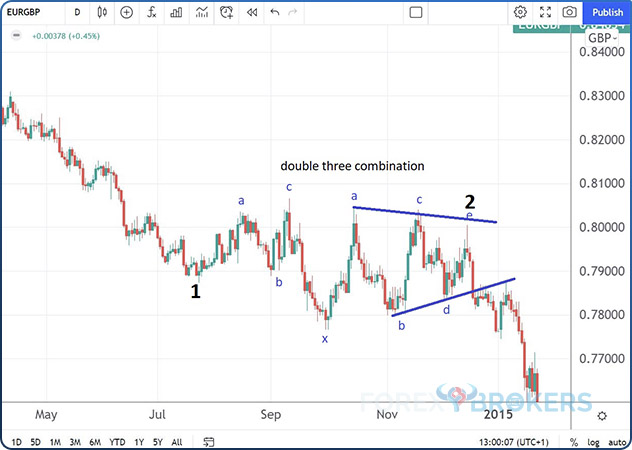
The most likely scenario is that the double three combination is part of an impulsive wave. If that is the case, it is almost always the 2nd wave and not the 4th one.
Therefore, the correct labeling on a larger scale should emphasize the end of the 1st wave, where the double three combination starts, and the end of the 2nd wave, where the double three combination ends.
Remember that trading with the Elliott Waves theory is like putting pieces of a puzzle together. Effectively, traders build a top/down analysis, counting waves on larger timeframes and then zooming in on the smaller ones for more detail. In this case, the impulsive wave must be part of something else – a bigger degree cycle most likely visible on larger timeframes.
How about a zigzag?
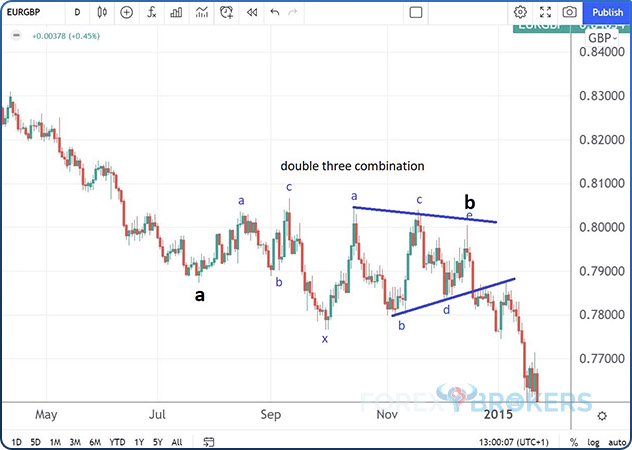
In the unlikely event that the double three combination is a zigzag, traders should focus on the rules of a zigzag: specifically, the element of time and the retracement of the b-wave.
During the formation of a zigzag, the b-wave should not retrace more than 61.8% of the previous a-wave. Most of the time, it does not retrace more than 38.2%, and when it does, the trader should be careful interpreting the zigzag pattern.
Another thing to consider is the element of time. In a zigzag, the c-wave should take approximately the same amount of time as the a-wave took to form. So, what was the double three combination on the EURGBP chart part of – an impulsive wave or a zigzag?
Looking at the Bigger Picture
The 1st thing to do is zoom out to see the bigger picture or switch to a larger timeframe. If we do one of these, the bigger picture helps us put the pattern into context.
The chart below shows the double three combination within the bigger picture. This is the weekly timeframe, and we see the consolidation as part of a bearish trend.

When labeling waves with the Elliott Waves theory, 1 crucial aspect is to know where to start counting from. The simple rule is to start counting on each timeframe from where the previous wave ended on a larger timeframe.
This is tricky because if the previous wave ends with a triangle, as it often does, the highest or lowest point in the wave is not the end of it. Therefore, traders should pay extra attention when labeling waves with the Elliott Waves theory.
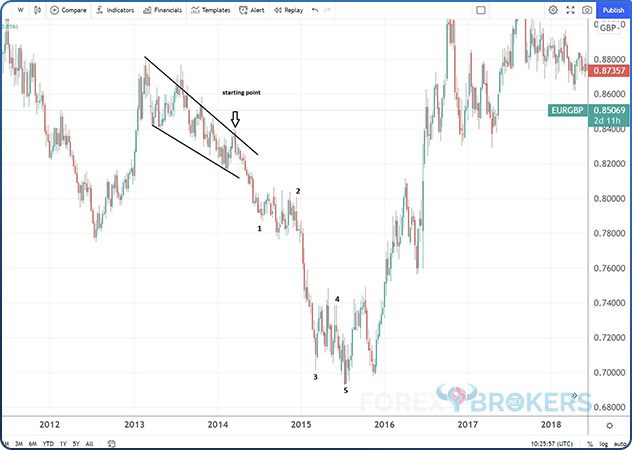
We see on the chart above that such a situation happened here. The EURGBP pair was in a bullish trend that lasted from 2012 to 2013, during which the pair rose over 1000 pips.
However, the 0.88 area was difficult to break, and the price action shows lower highs. The logical consequence is that the market formed a double combination that ended with a triangle, so it is important to mark the end of the triangle to know where the next wave starts from.
The starting point is marked on the chart above and represents the end of the previous triangle.
Trading a Double Three Combination
Now that we know the start of the market segment containing the double three combination, let’s try to label it. We should start by ruling out a zigzag pattern first. This is relatively easy if we look at the element of time before and after the double three combination. We can see that the time differs, so the bigger pattern cannot be a zigzag.
This leads us to the only possible larger-scale pattern – an impulsive wave. Labeling this is easy once we discount the possibility of a zigzag. In an impulsive wave, the move before the double three combination is the 1st wave, and the double three combination is the 2nd wave in the impulsive structure.
To trade this pattern, we should wait for the price to break the b-d trendline, as explained earlier and place a stop-loss order at the end of the triangle. In this case, the stop-loss should be placed at the 0.80 area.
How about the take-profit order? Remember that when the market forms a double three combination as the 2nd wave of an impulsive wave, the 3rd wave is an extended one. Therefore, to determine the target for a short trade, we should measure 161.8% of the a-wave and project that outcome from the end of the double three combination pattern. This is the minimum distance that the market should travel for the 3rd wave to extend.
The price drops, reaches the take profit, and then corrects again, forming the 4th wave of the pattern, before making a new lower low. The impulsive wave ends at the new low.
Conclusion
Horizontal complex corrections have 1 or 2 large intervening waves. This means that the x-wave retraces more than 61.8% of the 1st a-b-c, and it should retrace the entire simple correction.
These are not common patterns to find, but when they form, they are usually the 2nd wave of an impulsive move or the b-wave of a zigzag. Out of these 2 situations, the more likely is that the horizontal complex correction is the 2nd wave of an impulsive move.
The Elliott Waves Theory is complex enough to confuse many traders. This is why we are presenting the theory using the power of examples. In this trading academy, there are many articles dedicated to the Elliott Waves Theory, spread over different sections based on the difficulty of the concepts presented. Only by putting them all together will the trader be able to interpret and trade the market.
