Corrective waves within the Elliott Waves Theory go beyond, amazingly, a simple a-b-c. As pointed out in previous parts of this academy, Elliott noticed the complexity of corrective structures, as well as their variety.
Therefore, it is no surprise that many more corrective structures exist than impulsive ones. The currency market reflects this, as most currency pairs spend a lot of time correcting rather than advancing or declining in impulsive waves.
Later on, this academy will treat concepts like running correction, illustrating that an advancing or declining market is not mandatory to have impulsive activity. A complex correction may "run away" from its starting point, but in the end, it is just a variation of regular complex structures. This is not the first time this academy has treated complex corrections. In the previous section, a generalized classification was already introduced.
However, out of all complex corrections, some appear more often than others. Therefore, they deserve special attention, especially considering the fact that different substructures exist.
Double combinations are the first thing that comes to mind when the trader rules out the possibility that the market is forming a simple correction. According to the Elliott Theory, the price action following simple corrective activity must confirm it. If not, the market forms a complex correction.
The next thing for the trader to decide is what type of complex correction will most likely appear – with a large or small x-wave. Because complex corrections with a small x-wave are far more common, it is recommended that the analysis of the complex structure begins from this point. The first complex correction with a small x-wave is a double combination.
Quick Review of Simple Corrections
Simple corrective waves go beyond just a-b-c. Elliott defined corrective structures as a “three”-wave structure, but he included triangles here too. Only three simple corrective structures exist – flats, zigzags and triangles. Out of these, flats and zigzags have only three segments, while triangles have five. Despite having five segments, a triangle is still considered a “three,” or a corrective wave, because all of its segments are also corrective.
A zigzag has only one corrective segment – the b-wave. The other two segments, waves a and b, are impulsive. Therefore, a zigzag, labeled a-b-c, is a corrective structure as a whole but one that has two impulsive waves of a lower degree.
A flat has only one impulsive segment – the c-wave. The other two segments waves a and b, are corrective. Therefore, a flat, still labeled a-b-c, is a corrective structure as a whole, but one with two corrective waves and one impulsive wave of a lower degree.
Triangles have five segments: a-b-c-d-e. All of them are corrective and throughout the Elliott Waves Theory, there is no further labeling beyond the e-wave.
If you happen to see some Elliott Wave counts that use other letters like y, z, w, or something else, they only represent extensions of the classic a-b-c-d-e of a triangle and, even more often, of a complex correction.
As a rule of thumb, all corrective waves are labeled with letters and not numbers. However, despite such a clear rule, confusion still exists.
For example, the impulsive waves of zigzags and flats are labeled with letters, although they belong to a lower-degree cycle. Or, the 2nd and 4th waves in an impulsive move are labeled with numbers, even though they are corrective structures. In any case, with a lot of practice, the Elliott Waves trader gets used to the logical process laid down by Elliott, and the labeling begins to make sense once in front of a chart.
Complex Corrections with a Small X-Wave – Particularities
A complex correction connects two or three simple corrections. Depending on the length of the connecting/intervening wave, complex corrections have either a small or a large x-wave.
The delimitation of the two categories comes from the 61.8% retracement. If the x-wave’s length, measured from its start to its bottom, is less than 61.8% of the first a-b-c, the following pattern is a complex correction with a small x-wave. In this category, we have double and triple combinations, double and triple zigzags, as well as double and triple flats.
Of the complex corrections with a small x-wave, the double combinations appear most frequently in the currency market. Triple combinations, double zigzags and triple zigzags follow, while double and triple flats are not that common.
In a complex correction with a small x-wave, the intervening wave must be corrective, too. More precisely, you cannot label the x-wave as an impulsive structure – it must be a corrective one. Either simple or complex, the nature of the x-wave is one of the keys to understanding the entire complex correction.
Another thing to consider in any complex correction, not only those with a small x-wave, is that the first corrective part is never a triangle. Therefore, any complex correction part of the Elliott Waves Theory, regardless of its name and complexity, cannot start with a triangle. Many, though, end with a triangle, but there is no way to see a triangle at the start of any complex corrective wave.
Having said that, let us move into the world of double combinations – the most common complex correction part of the Elliott Theory. Because the pattern appears so often, the real-life examples on the currency market chart differ very much from what Elliott intended. However, this article deals with both the theoretical patterns and real examples, showing the ways to correctly identify double combinations on a chart.
Double Combinations
In a double combination, the two simple corrections have one intervening wave – the x-wave. Also, the first correction part of a double combination cannot be a triangle.
Therefore, when looking for a typical double combination structure, consider the following:
- The start of the pattern must be an a-b-c of either a flat or a zigzag.
- Flat patterns appear more often as the first corrective phase of a double combination.
- The x-wave is corrective, too – either a simple or a complex correction on its own.
- The last corrective phase is either:
- A triangle with the a-b-d-c-e structure.
- A zigzag (if the double combination starts with a flat) with the a-b-c structure.
- A flat (if the double combination starts with a zigzag) with the a-b-c- structure.
We can summarize the possibilities for the double combination in the following manner:
- flat – x-wave – triangle
- a-b-c – x – a-b-c-d-e
- zigzag – x-wave – triangle
- a-b-c – x – a-b-c-d-e
- flat – x-wave – zigzag
- a-b-c- x – a-b-c
- zigzag – x-wave – flat
- a-b-c – x – a-b-c
The first two are the most common of the four possibilities for a double combination. In other words, look for a triangle to complete the double combination most of the time.
Before diving into more details about double combinations, think of the logical process part of the Elliott Waves Theory. When interpreting any market swing, the first question to answer is if it is impulsive or corrective. This is the most important question and the answer leads the Elliott trader to the next phase of the analysis.
Assuming the market swing is corrective, the next question is if the market forms a simple or a complex correction. Simple corrections must be confirmed by future price action – if not, the market forms a complex correction.
Double Combination That Starts with a Flat
Two categories of complex corrections exist – with a small or a large x-wave. The ones with a small x-wave appear predominantly, so the trader must analyze the patterns fitting into this category first. A double combination is at the top of this list.
Throughout this trading academy, we have emphasized many times the importance of the Elliott logical process. It keeps things simple and guides the analysis to the next logical outcome.
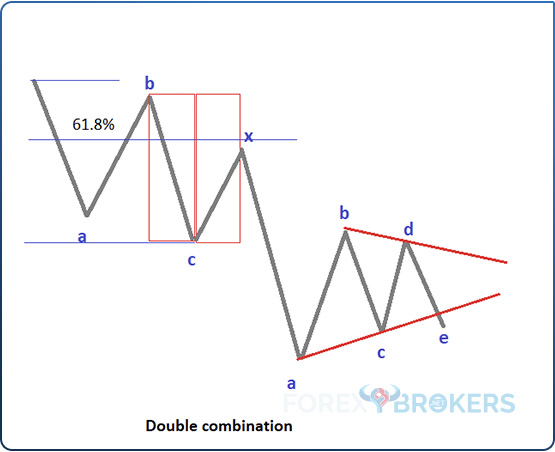
A previous article dedicated to the Elliott Waves Theory introduced the concept of a double combination from a theoretical perspective. The image below shows a double combination that starts with a flat and how Elliott drew the pattern.
Here is how to analyze it. First, consider the first three market segments – the first a-b-c. The b-wave retraces beyond 61.8% of wave a and the c-wave makes a new low. Depending on the length of the b-wave, traders identify the flat pattern type (e.g., common, with a failure, etc.).
Next, it is time to determine whether the flat, the first a-b-c, is a simple correction. At this point, the trader does not know if the market ends the corrective phase or continues to decline. To do that, the trader measures the time it took for the c-wave to form and project it on the right side of the chart – the price must fully retrace the c-wave in less or the same time it took for the c-wave to form.
As it fails and the market makes a new low, the implications are that the swing higher was nothing but an x-wave. Moreover, by the time the market makes a new low, the second correction has most likely already started – in the example below, a triangle.
Double Combination That Starts with a Zigzag
When a double combination begins with a zigzag, the only thing that changes is the first part of it. More precisely, the market forms a zigzag instead of a flat pattern.
In a zigzag, the b-wave retraces less than 61.8% of the previous a-wave. Sometimes, it retraces as much as 50%, but the minimum distance is as little as 1%.
For a pattern to be interpreted as a zigzag, traders must look at similarities between the two impulsive waves. In particular, the time of the two impulsive waves (wave a and wave c) must be similar. Obviously, due to the volatility in the currency market, traders should use their own judgment when interpreting the time element on a chart. In other words, do not be stubborn and search for the exact number of candlesticks in the two impulsive waves – rather, look for the two to be alike.
Besides the first correction, nothing changes in the interpretation of a double combination. Some further differentiation appears when interpreting the channeling component based on the first corrective phase, but more about that in a future part of this academy.
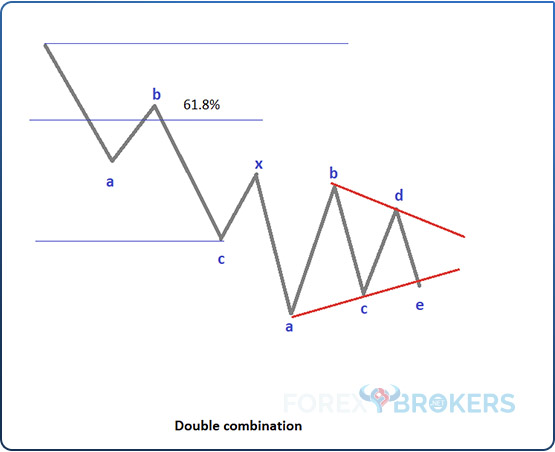
After the first a-b-c ends, the trader must wait and see if it is an independent, simple correction. The way to check that is to measure the time it took for the c-wave to form and project it on the right side of the chart – the price must fully retrace the c-wave in a similar or less time. If not, an x-wave comes.
The x-wave’s length is key for the shape of the double combination. For example, it may stretch beyond 61.8% of the first a-b-c, but it cannot end there. It must end below.
As a tip, in complex corrections with a small x-wave, look for the intervening wave to correct only a small portion of the first a-b-c. The more it stretches into the a-b-c territory, the less likely the market will form a complex correction with a small x-wave.
Double Combination that Ends with a Flat or Zigzag
Before anything, consider these two types of double combinations as extremely rare. A more common form is the one that ends with a triangle. However, such variations may appear in the currency market, especially on the cross pairs.
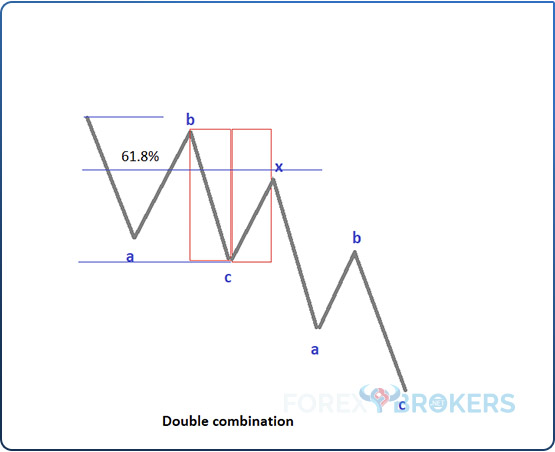
The rule of thumb here says that if a double combination begins with a flat, it ends up with a zigzag. Or, if it starts with a zigzag, it ends with a flat.
The logic behind the statement above is that if a pattern starts with a zigzag and ends with a zigzag, it is no longer a double combination but a double zigzag. A double zigzag has a different interpretation, appears in different places in the Elliott Waves Theory, and has a different trading approach.
Or, if the pattern begins with a flat and ends with a flat, it is called a double flat. Hence, looking for the two corrective phases part of a double combination to alternate is especially important.
The image above shows a double combination that begins with a flat pattern and ends with a zigzag. For the x-wave, nothing changes – it must respect the same rules as explained so far in this article.
The danger when interpreting such a pattern is that many times, the trader is inclined to conclude that the double combination ended with the second a-b-c, only to see that the segment was only the first leg of a contracting triangle, meaning the double combination is of a different type (ending with a triangle).
Once again, consider these variations exceedingly rare and focus on the ones ending with a triangle. They appear very often in the currency market.
Reversible and Irreversible Double Combinations
The next thing to consider when trading double combinations is that they are of two types – completely reversible ones and irreversible ones. More precisely, it is about interpreting the following move after the double combination is completed.
The key to interpreting reversible or irreversible double combination patterns is to look at the shape of the triangle that forms at the end of the pattern. As already explained in this article, the triangle is a non-limiting type of triangle.
Such a triangle, as the name suggests, is followed by a price action that has “no limitations.” The minimum distance the market should travel is the measured move for the non-limiting triangle – 75% of the longest wave of the triangle.
As in many cases when triangular patterns are involved, the apex of the triangle plays a critical role in identifying the type of double combination. To find out the apex, traders project the a-c and b-d trendlines until they meet. That point is that the apex and its shape are responsible for the type of a double combination – reversible or irreversible.
Laying Down the Rules
The Elliott rule that defines the type of the double combination says that if the apex forms on the horizontal, the double combination is irreversible. Conversely, if the triangle has a rising or falling apex, the double combination is reversible.
More precisely, the rule refers to the type of triangle forming at the end of the double combination (as the second simple correction or as the market segment that follows the x-wave). If the double combination forms a horizontal contracting triangle as the last segment, the entire pattern is irreversible. If, on the other hand, it forms a different type of triangle (e.g., irregular), the pattern is reversible.
One more thing to consider – the rule refers to a wave of the same degree. If the market swing belongs to a different cycle, meaning it has a higher or a lower degree, then the rule has no meaning.
For example, if a double combination of an irreversible type appears as a flat's a-wave, the following b-wave must not fully reverse the a-wave. On the other hand, it may form as the e-wave of a triangle and then the next market segment belongs to a cycle of a bigger degree. Hence, the price may fully retrace the double combination despite the fact that it looks like an irreversible one.
Irreversible Types
An irreversible double combination has a horizontal contracting triangle at its end. When that is the case, the apex’s horizontal positioning is easy to spot as well.
The image below shows how such a triangle forms after the intervening x-wave. Also, it shows how to find the apex by dragging the a-c and b-d trendlines on the right side of the chart and finding the intersection point (the apex).
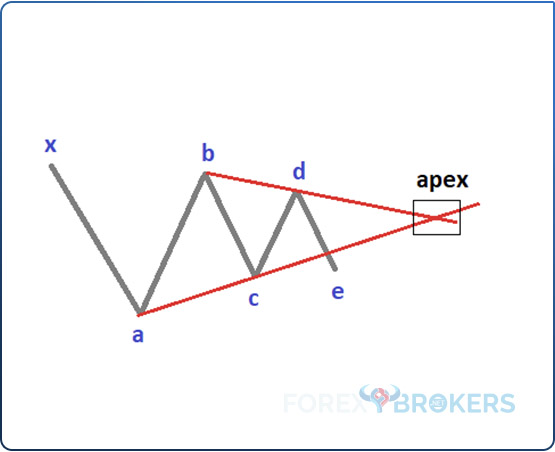
A double combination that ends with a triangle similar to the one above is irreversible if followed by a market segment of a wave degree. For instance, as one of the examples that follow in this article will show if the double combination appears as the a-wave of a horizontal triangle, the b-wave that follows cannot fully retrace the price action because it is of the same degree as the previous a-wave.
Reversible Types
When the apex does not form on the horizontal, it means that the double combination formed a non-limiting triangle of a special type. It could be an irregular triangle or just a triangle with a-e baseline – any type fits here, as long as the apex does not form on the horizontal.
The image below depicts a triangle with a rising apex. Typically, it does not make sense to determine the exact location of the apex. Because the two trendlines, the a-c and b-d, contract, it is safe to assume that their intersection point sometimes in the future (i.e., on the right side of the chart) falls on the upside of the chart.
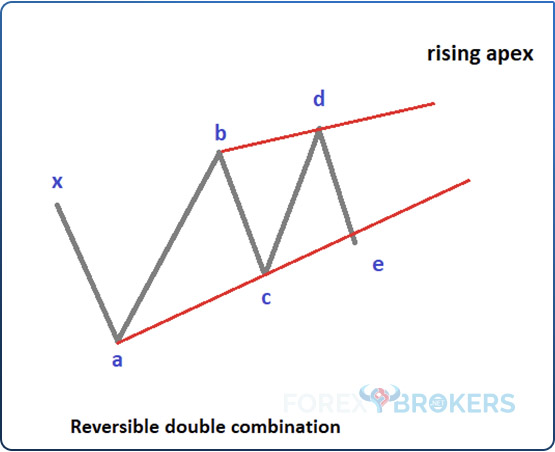
When this happens, the price action to follow such a double combination will fully reverse it. Again, this rule must be thoroughly understood to make the most of it.
For instance, have a look at the image above. Is it possible to have such a double combination as the b-wave of that triangle? The answer is no. If the double combination ends with such a triangle, the price action to follow on a wave of the same degree (the c-wave) MUST fully retrace the b-wave. Hence, if such a pattern appears in the b-wave, the Elliott Wave count is wrong – either the market formed something other than a reversible double combination, or what you are looking for of a bigger degree is not a triangle.
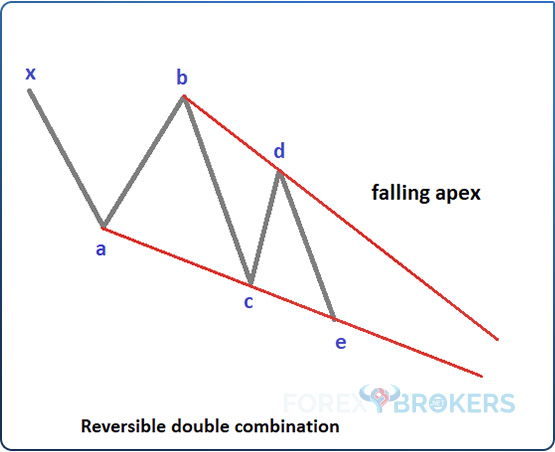
The same goes for the apex of a triangle with falling a-c and b-d trendlines. We can assume that the trendlines meet somewhere on the right side of the chart, but it makes no sense to try to find out the exact spot. For this analysis, it is important only to know if the apex is horizontal, falling or rising.
As the image below shows, when the apex falls, the double combination is reversible by a wave of the same degree. Everything discussed in this section also remains valid for this type of triangle.
Introducing the Channeling Component
A complex yet decisive aspect when trading double (and triple) combinations is the channeling component. Channeling is treated in a separate part of this trading academy, in one of the more advanced sections.
For now, just consider that for a double combination, the price action must revolve around certain lines. Therefore, channeling does not refer to the price action between two parallel lines but to the price action that revolves around two lines that may or may not be parallel.
Depending on the type of the first correction, the two lines required for the channeling component change. At this point, you only need to remember that when a double combination starts with a zigzag pattern, the channeling component requires that the price action revolve around the 0-x trendline and a trendline that connects the end of waves a and c of the zigzag. The two examples show the relevance of channeling and how to apply the concept.
Check out our video about the Trading Double Combinations:
Currency Market Examples of Double Combinations
Double combinations often form in the currency market. Once the price action fails to confirm a simple corrective wave, the logical process leads traders to the double combination as the first and most common complex correction to form.
Because the theoretical concepts, or patterns, were discovered by Ralph Elliott back in the 1930s, when the currency market did not exist, the actual patterns in the 21st century look a bit different. However, the rules remain the same, only that high volatility is typical when trading currencies.
Irreversible Double Combination on the EURUSD 4h Chart
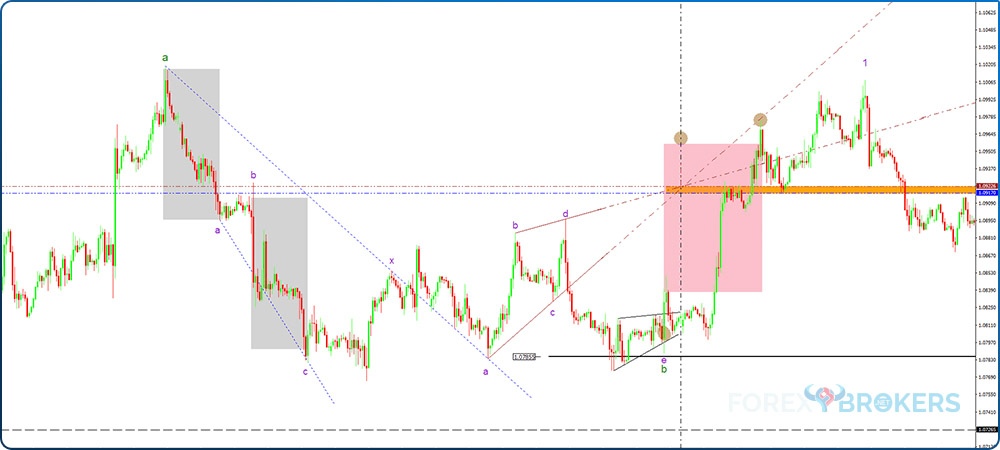
The first example is a possible irreversible double combination forming on the 4h EURUSD timeframe. At the time of writing this article, the EURUSD pair broke higher, ending a non-limiting triangle at the end of a double combination.
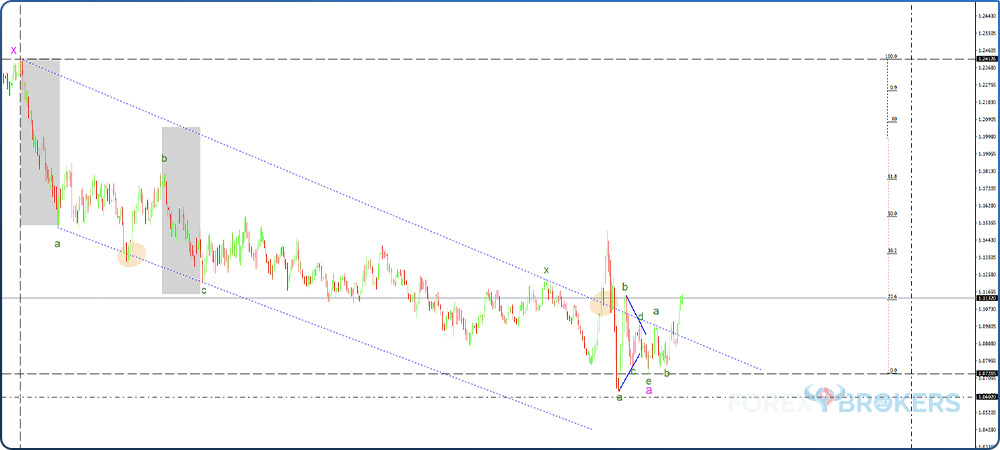
From left to right, it is important to remember what a top/down analysis with the Elliott Waves Theory is. Effectively, the analysis continues on the lower timeframes from where the bigger timeframe left off.
Therefore, on the left side of the above chart, we see a vertical line, suggesting that is where the analysis of the 4h timeframe begins. Moreover, it shows an x-wave on the left side of the vertical line, indicating where the top/down analysis ended on the bigger timeframe.
Step-by-Step Interpretation
The EURUSD dropped without any meaningful pullback. After the market broke the series of lower highs, the implication is that the first swing ended. At this point, the focus shifts to the retracement level the market makes before putting a new lower low.
As the chart shows, the EURUSD failed to retrace more than 61.8% of wave a and then made a new lower low. A zigzag is the first thing that comes to mind.
However, the conditions for a zigzag call for the time it took for wave a to be almost identical to the time it took wave c to form. The only way to find out if the relationship holds and determine the actual location of the zigzag is to measure the time it took the a-wave to form and find a similar market move (timewise). If, at the end of that move, the price makes another lower low, that is the zigzag, provided that in the meantime, there is no retracement beyond the 61.8% retracement.
After the first a-b-c, we see that the market consolidates further, failing to fully retrace the c-wave. Hence, it forms a complex, not a simple, correction.
It becomes clear that we must look for the intervening wave, bearing in mind that a double combination is most likely to appear. Moreover, we already have a bias in that we know that the double combination starts with a zigzag. Furthermore, we know that the double combination is likely to be one of an irreversible kind. How come?
The answer comes from the x-wave at the start of the analysis (top left, in magenta). It indicates a complex correction of a larger degree, most likely a horizontal triangle. Because all of the triangle’s segments are shorter than the previous one, the bias is that the market forms a double combination of an irreversible type. However, if the apex angle of the triangle at the end of the double combination is not horizontal, then the double combination is reversible, and the triangle becomes irregular.
The 0-X Trendline
The channeling component refers to the 0-x trendline and the a-c trendline of the first correction. More precisely, the Elliott Waves Theory requires the price action to “touch” the two lines, either between the two points or after. The two circles show how the channeling component works.
At the end of the double combination, the EURUSD pair formed a horizontal contracting triangle, telling us that a further move higher will not be possible to fully reverse the double combination. More precisely, the following price should not retrace beyond the x-wave seen on the left side of the chart.
Reversible Double Combination on the EURUSD 1h Chart
A reversible double combination, as mentioned earlier, has a triangle that points upward or downward. Such a triangle at the end of the pattern calls for its full reversal.
The hourly EURUSD pair recently formed a double combination that started with a zigzag and formed a triangle at the end. However, as it turned out, the triangle was not a horizontal but an irregular type. The irregularity comes from the fact that the b-wave is longer than the a-wave. As such, the apex has a rising angle, pointing to the fact that the price action that follows the double combination will fully retrace it.
An important thing to mention here is that the e-wave of the triangle is also a triangle, albeit of a lower degree. It happens very often that for the e-wave of a non-limiting triangle, the market forms another triangle. Hence, the end of the double combination's entire length starts from the zigzag's beginning and ends with the triangle that marks the e-wave (where the b-wave in green appears on the chart above). As for the channeling component, if we draw the 0-x trendline, the price action must test it either between the 0 and x points (i.e., the start of the double combination and the x-wave) or after the x-wave. In this case, we see that the price action consolidates on the falling 0-x trendline, confirming part of the channeling.
The other part of the channeling component refers to the price action testing the a-c trendline either between the a and c points or after. In this case, it retested the trendline between the two points, indicating that the channeling aspect of the double combination is completed.
Therefore, by the time the double combination ended, the market fully reversed it. The beauty of a double combination and other patterns that are part of the Elliott Waves Theory is that they allow traders to form an educated guess about the price action to follow after the current pattern. In this case, all the time that the EURUSD pair formed the triangle as the e-wave, traders knew that when the triangle broke higher, it marked the end of the e-wave, respectively, the end of the double combination that the future price action would fully retrace.
Conclusion
Double combinations are the first complex patterns to consider after the price action invalidates a simple correction. It has two simple corrections connected by a small x-wave.
The key thing in interpreting a double combination is to make sure that the x-wave does not retrace more than 61.8% of the first a-b-c. Also, the first a-b-c is either a flat or a zigzag – it cannot be a triangle. Moreover, most double combinations end with a triangle, although some end with a different pattern than the one that started the double combination. Finally, double combinations are of two types – reversible and irreversible.
One cannot advance with studying the Elliott Waves Theory without fully understanding how complex corrections work. As double combinations are the first type of complex corrections and the most common one to appear, it becomes obvious that the Elliott Waves trader must learn to count, interpret, and trade them accordingly.
This is not the last part of this trading academy that deals with the Elliott Waves Theory. Others will come, as part of this section or more advanced ones.
Because there are so many patterns, we cannot treat them all. However, it is important to understand the concept behind simple and complex corrections and how the x-wave connects them.
The future article dedicated to the Elliott Waves Theory part of this section deals with triple combinations. For the trader who has studied double combinations, interpreting triple combinations should be easier.


