The Japanese candlestick patterns belong to classic technical analysis. They come to complement the reversal and continuation patterns discovered in the Western world and bring something new to technical traders.
One of the main advantages of Japanese candlestick patterns over the classic ones is the time element. More precisely, they take very little time to form – often only a couple or more candlesticks and, in some cases, one single candlestick. Because of that, Japanese candlestick patterns are favored by traders.
Japanese candlesticks are mainly reversal patterns. As such, if we compare them with the classic technical analysis patterns, such as the head and shoulders or the double top or bottom, then the time element is a critical advantage for the technical trader.
Japanese candlestick patterns appear more often because they take such a short time to form. Therefore, traders have many opportunities at hand.
Also, the rules of trading Japanese candlestick patterns are the same, regardless of the timeframe used. Sure enough, a pattern on the monthly chart needs more patience from the trader for the market to reach the target. But the rules to trade are the same, thus providing a great tool for sound money management.
This article focuses on two reversal patterns – stars and engulfings. Both are bullish or bearish and can be traded with a risk-reward ratio suitable for most money management strategies.
The aim is to present the setups used to trade these reversal patterns as well as several examples on different timeframes and markets. By the end of this article, the reader should be able to trade stars and engulfing using a sound approach that considers money management for optimal results.
Advantages of Japanese Candlesticks Patterns
There is much literature about Japanese candlesticks to be found online. Books have been written about how the Japanese approach to technical analysis made its way into the Western technical analysis approach. Combining the two gives the trader a better understanding of the market.
A classic technical analysis pattern needs a lot of time to form. For example, consider the head and shoulders pattern.
This is a reversal pattern forming at the top of bullish trends. Or the inverse head and shoulders appear at the bottom of bearish trends.
Trading the pattern is straightforward – draw the measured move and project it from the neckline for the minimum distance the market must travel. But the downside is that it takes a lot of time until the market breaks below or above the neckline.
For a single setup, trading the head and shoulders pattern needs patience. Or this is just what retail traders lack, as patience to wait for the proper setup is an essential part of a sound money management system.
We can say a similar thing about the double top or bottom pattern. Until the market breaks below the neckline, a lot of time must pass. Moreover, if it forms on the larger timeframes, the trader needs even more patience.
All these are not an issue for the Japanese candlestick patterns. Just the opposite is true.
Most Japanese candlestick patterns need only a few candlesticks to complete. In some cases, one candlestick is enough for interpreting a pattern, such as in the case of the Doji candlestick.
Therefore, instead of waiting for days, weeks, or months for a classic technical analysis pattern to complete, the trader could simply use the setups provided by the Japanese candlestick patterns.
Another advantage of Japanese candlestick patterns is that they can be used to confirm a reversal. Let us explain it in a few more detail.
Using the Japanese Candlestick Patterns as Confirmation of a Reversal
Many types of trading exist, but most traders are familiar with two: trend following and picking a top or a bottom. Trend following is straightforward and mostly involves trading a series of higher highs and higher lows (in a bullish trend) or lower lows and lower highs (in a bearish trend).
Picking a top or a bottom is also known as contrarian trading. Contrarians believe that the current market perception is wrong and that a reversal is imminent.
Contrarian trading is the riskier of the two trading styles because the trader goes against the consensus. As such, money management is paramount for success.
Traders use reversal patterns when trying to pick a top or a bottom. But as mentioned earlier, classic reversal patterns need a lot of time to form, so the trader needs something else for an early positioning.
Even a rising wedge (i.e., a classic technical analysis pattern forming at the end of bullish trends) cannot be traded until the price moves below the so-called 2-4 trendline. It can take a while to do so.
Therefore, the best approach is to use Japanese candlestick patterns as confirmation of a reversal. For example, if an evening star appears at the top of the rising wedge, it reinforces the classic reversal pattern.
As such, contrarian traders may trade the evening star at first, as it only needs three candlesticks to form, and then trade the rising wedge by the time the price breaks below the 2-4 trendline. In this way, the Japanese reversal pattern reinforces the classic technical analysis that usually takes much more time to form.
Easy to Implement in a Sound Money Management System
Perhaps the most relevant thing about Japanese candlestick patterns is the straightforward way to trade them. As such, they are easy to implement in a sound money management system.
A sound money management system is one comprising stop-loss and take-profit levels, as well as a proper risk-reward ratio. In the currency trading world, such a ratio is 1:2 or higher. More precisely, the trader stands to gain two for every pip risked.
But sometimes, finding the entry and exit levels is difficult. The Japanese candlestick patterns integrate perfectly with a sound money management system, so they are highly valued by traders.
Essential when trading is the ability to interpret and execute a setup. It is one thing to build a technical setup respecting a sound money management system and another thing to execute it.
The main problem comes from the trader. The psychological aspect of trading plays a trick on all of us and often leads to improper decisions.
In this case, the biggest mistake is closing a trade too early. Interestingly enough, traders tend to let the market reach the invalidation or stop-loss level, but they find it difficult to let the profits run.
The proper setup when trading morning and evening stars requires a risk-reward ratio of 1:3. If profits are booked earlier, the ratio changes, and the initial money management system does not make sense anymore.
Hence, plan your trade, and trade your plan.
Stars
Most Japanese candlestick patterns come in two sets. Effectively, it means that for every bullish pattern, there is an opposite one, a bearish pattern.
Stars are no different, as two types of stars exist – morning and evening. Just like their names suggest, a morning star is a bullish pattern, meaning that it appears at the end of a bearish trend, while an evening star is a bearish pattern, meaning that it appears at the end of a bullish trend.
Trending conditions, therefore, are mandatory when interpreting stars. In fact, trending conditions are a requirement for all reversal patterns.
Stars are reversal patterns comprising three candlesticks. If, for instance, the trader analyzes the daily chart, then three days are enough for the pattern to form.
Out of the three candlesticks, the one in the middle is the smallest one. By small, we refer to the candlestick's real body.
Remember from other articles that a candlestick has several parts – an upper tail, a lower tail, and a real body. All of them are used to interpret the price action, and the real body is the price action between the opening and closing levels.
The real body belonging to the candlestick in the middle should be small compared to the real bodies of the other two candlesticks. Ideally, the candlestick should resemble a Doji (i.e., a candlestick that has the same opening and closing levels).
Morning Stars
As the name suggests, morning stars are bullish patterns, meaning that they form at the end of a bearish trend. A morning star, therefore, must be preceded by bearish price action.
During a bearish trend, the market keeps forming lower lows and lower highs. Bulls, however, are on the watch for a contrarian trend.
The first candlestick belonging to a morning star always has a strong, bearish, real body. Nothing indicates that a reversal is imminent, as the price action inside the candlestick is extremely bearish.
As mentioned earlier, the candlestick in the middle should have a small real body – or none. Ideally, it should be a reversal pattern on its own, such as a Hammer or a Doji. Both patterns are treated in this trading academy, so the reader might find it reasonable to review the trading rules and what the patterns stand for.
Finally, the last candlestick in the pattern is the one that acts as a confirmation. It also has a strong real body, but the price action is bullish. A bullish price action means the closing price is much higher than the opening price.
As a rule of thumb, for the morning star to be valid, the third candlestick must close into the territory of the first one by covering at least half of the first candlestick's territory. The bigger the third candlestick's real body, the better.
Incorrect Patterns – Examples
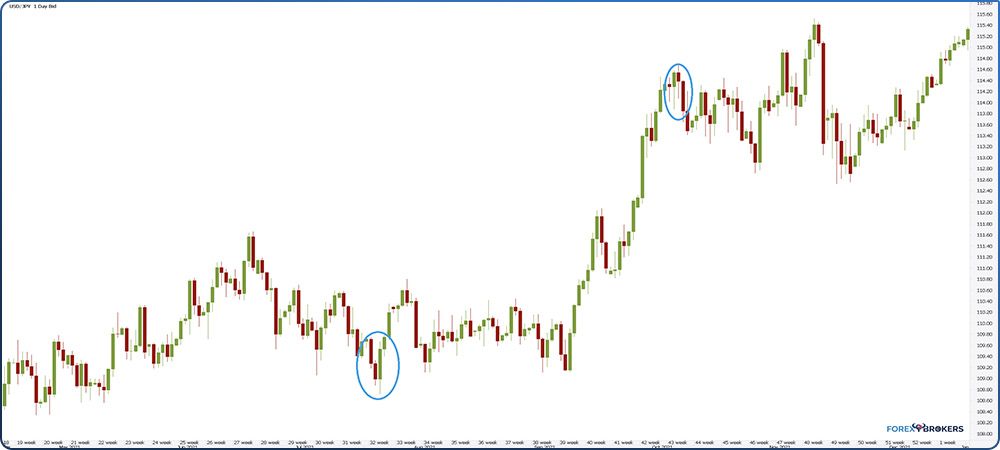
Reading a candlesticks chart can be misleading. Patterns that look like the right ones are, in fact, incorrect.
Take the chart below. The blue area on the left shows a possible morning star, but it is incorrect because there are two candlesticks in the middle. Remember that a star only has one candlestick in the middle and the entire formation comprises three candlesticks.
The same can be said about the example on the right side of the chart, only this time, we talk about an incorrect evening star.
Be Aware of the Sunday Candlestick
Another thing to consider when interpreting stars is the timeframe. In particular, the daily timeframe requires special attention.
Many brokers also show the so-called Sunday candlestick on their platforms. On Sundays, trading does occur as some markets open earlier, such as New Zealand.
For this reason, for a couple of hours, trading is possible. Most brokers display this short-term market activity as a full candlestick. However, this candlestick differs from all others because of the hours it covers.
Because of the short time, the Sunday candlestick is very small. Sometimes, it is just a line on the screen; some other times, it has a very small real body.
These characteristics make it the ideal candidate for the second candlestick part of a star pattern. But traders should ignore such a setup whenever possible, or at least to ensure they know how the broker displays the Sunday market activity.
Some other brokers do not display the Sunday market activity at all. However, this is incorrect because if trading occurs and the market is open, then the chart must show it.
Example of a Morning Star – AUD/USD
The following chart presents a morning star pattern on the AUD/USD 4h timeframe. Let us walk through it a bit and outline the conditions needed to correctly interpret a morning star.
First, there must be a bearish trend before the morning star pattern. Remember that the first candlestick in the reversal pattern should be part of the bearish trend. Hence, it should have a strong real body, typically displayed in red.
Practically, bears are in control, and nothing suggests that a reversal is imminent. Therefore, the first bullish sign comes when the chart displays the second candlestick – the one in the middle.
Trading the pattern at this point is not recommended because of the bearish trend that exists. As such, the trader must wait for the third candlestick to close and check if the closing level is above half of the first candlestick's real body's distance. All these conditions are respected by the morning star shown below.
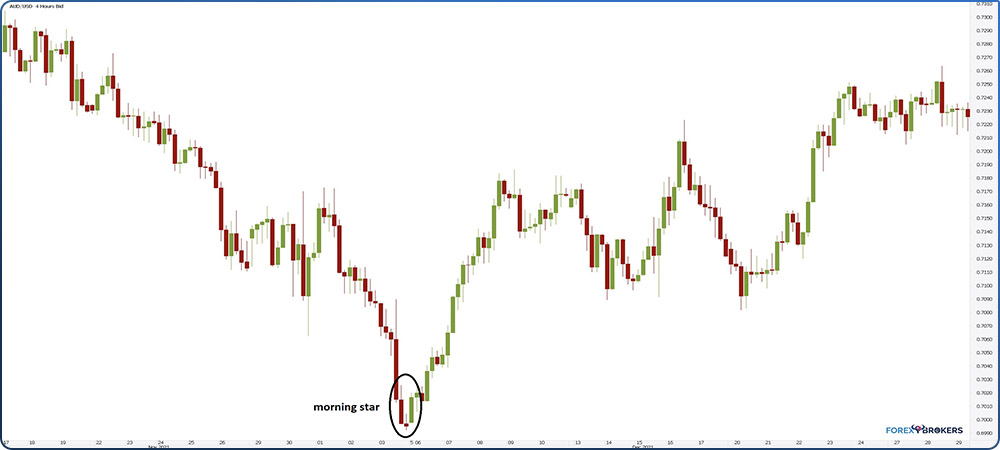
As the reader can notice, the morning star marks the lowest point in an inverse head and shoulders pattern. Such a pattern is formed out of a consolidation area on the left, acting as the left shoulder, followed by a sharp move lower that is quickly retracted. That is the clue that the market formed a reversal pattern. Because the morning star is at the bottom of the pattern, it reinforces the classic technical analysis pattern and the bullish case.
Morning Stars on Larger Timeframes – EUR/USD Monthly Chart
The beauty of all Japanese candlestick patterns is that their interpretation is the same regardless of the timeframe. The same rules apply regardless of whether the star forms on the hourly, 4h, daily or larger timeframes.
Later in this article will cover the rules for trading a star later. They are the same regardless of the timeframe, and the only thing the trader needs to focus on is discipline and patience in executing the trade.
The chart below shows a morning star formation that appeared on the EUR/USD monthly timeframe. This is the largest timeframe, and the price action that followed was a strong bullish trend once the third candlestick in the pattern closed.

As the chart shows, morning or evening stars are not mandatory to form at the bottom, respectively, at the top of a trend. Put simply, the market may make a low or a high before the pattern's completion. It is, however, mandatory for the reversal pattern to appear near the bottom or top.
In the case of the EUR/USD monthly chart example, the morning star appears as part of a double bottom pattern – a classic technical analysis reversal pattern. As such, just like mentioned previously in the article, the Japanese candlestick pattern comes to reinforce the classic technical analysis reversal one.
Evening Stars
Evening stars are the opposite of morning ones. For this reason, it makes no sense to show other examples.
Nevertheless, we should mention once again the conditions for an evening star's formation. First, a bullish trend must be in place. Effectively, the trader must check if the market makes a series of higher highs and higher lows.
Second, the first candlestick in the evening star pattern should not offer any clue about the reversal pattern in the making. It should have a strong real body, typically shown in green.
Moving forward, the candlestick in the middle must have a small or no real body. Ideally, it should be a reversal pattern on its own, such as a Doji candlestick.
Finally, the last candlestick part of the pattern must have a strong, bearish, real body. Moreover, it must extend beyond half of the distance traveled by the first candlestick's real body.
With all conditions in place, trading the patterns may begin.
How to Trade Morning and Evening Stars
When trading Japanese candlestick patterns, money management is paramount. In other words, a clear setup for entry and exit must exist before the trade evening starts.
Planning allows the trader to manage the resources in the trading account better. Also, it shows discipline and removes some inherent emotions when trading.
Risk-reward ratios give a disciplined approach to trading. By using appropriate ones, the trader allows the account to grow even if not all trades are profitable.
The Setup Needed
Several steps are needed when trading a star. The first one is to mark the pattern's territory.
Remember that a star only has three candlesticks. Therefore, focus on the highest and lowest points these three candlesticks make. Next, mark the area with two horizontal trendlines. Basically, you mark the pattern's upper and lower edges.
It means that all the work begins only after the third candlestick is closed. But that is okay because when trading a morning or an evening star, traders must wait for a market pullback before entering the trade.
The best way to make sure the pullback is not missed is to use pending orders. In the case of a morning star, a buy-limit pending order ensures that the entry is not missed, regardless of the time of the pullback. Conversely, a sell-limit pending order should be used in an evening star case.
As a reminder, a buy-limit pending order is used when the trader intends to enter the market at levels below the current ones. Conversely, a sell-limit pending order is used when the trader intends to enter the market at levels above the current ones.
The next step is to place the stop-loss order. This is the invalidation level, or what invalidates the pattern, and it is the lowest point in a morning star formation or the highest one in an evening star formation.
Finally, the setup must consider an exit level. Where to close the trade and book the profits, if any?
Risk-reward ratios are useful in this case. For morning and evening stars, the trader can easily use a risk: reward ratio or r:r ratio of 1:3. Effectively, it means that for every pip risked, the trader's plan is to make three.
Trading a Morning Star Pattern
The chart below shows the AUD/USD 4h chart and the earlier morning star pattern. Focus on the setup based on the steps presented in the previous paragraphs.
A pullback should occur after the star's completion. Typically, the retracement should cover anywhere between 38.2% and 61.8% of the distance between the upper and lower edges. Therefore, the pending buy-limit order may be placed anywhere between these levels.
What lies between the entry price and the lowest point in the Morning star is the risk taken. It means that for a r:r ratio of 1:3, the reward should exceed the risk by three times. Therefore, the easiest way to find the exit level is to project the risk three times.
As the chart shows, the market traveled much more than that. This is such a case that the bullish trend that started with the morning star formation had no pullback until a much higher level.
Traders willing to chase the trend for r:r ratios bigger than 1:3 might want to use a trailing stop order or manually trail the market. Ideally, the distance used is the initial risk.

Trading an Evening Star Pattern
Because an evening star is the opposite of a morning star, trading the pattern is similar. Only this time, the trader should use a pending sell-stop order to enter the market from higher levels than the current ones.
The USD/JPY chart below shows a classic setup for trading an evening star pattern. After drawing the pattern's edges, the sell-limit order offers the perfect entry for a short trade that respects the 1:3 risk-reward ratio. Once again, the bearish trend continued for much higher levels, and those willing to trail the market may end up with even bigger profits.
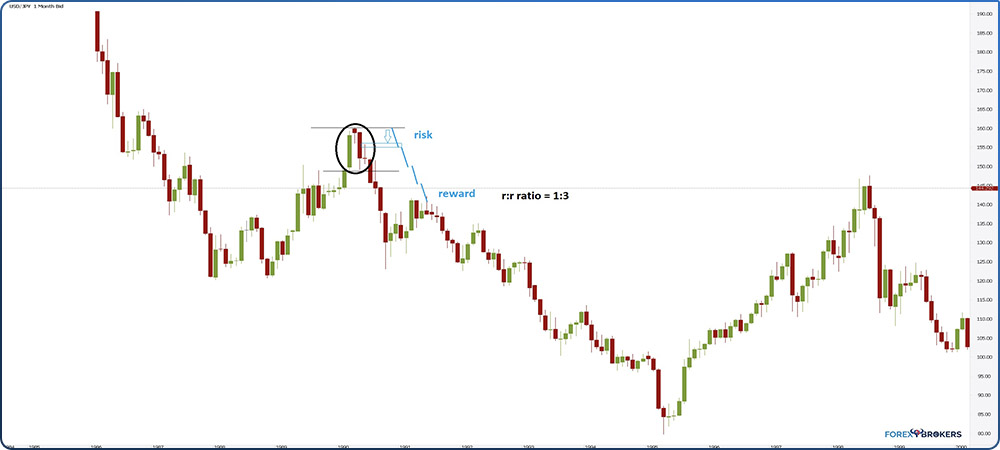
Once again, having the patience for the market to reach the take-profit level is crucial. Because this is the monthly timeframe, the trader will be tempted many times to book the profits before the planned exit point.
Think of what happens every trading month in terms of the economic data released. Every first Friday of the month, the Non-Farm Payrolls in the United States show the state of the labor market in the world's largest economy. It moves the stock market and, indirectly, the currency market because the market's expectations of future interest rates change accordingly and sometimes in a blink of an eye.
Also, at least one central bank announces its monetary policy during any given trading month. Before any such releases, the market conditions are tight, and the trader will be tempted to book the profits, if any, as a precautionary measure.
However, by doing so, the trader breaks the rules of trading a technical setup that does not depend on any fundamental factors.
All Stars End Up Being Profitable?
The short is no. This is why a stop-loss order is used in the first place. Also, this is why using risk-reward ratios makes sense.
A risk-reward ratio of 1:3 is important because, for every profitable trade, the trader may lose three others and still break even. The secret is to adjust the traded volume so that the pips risked always amount to the same percentage – ideally, 1% of the trading account and not more than 2%.
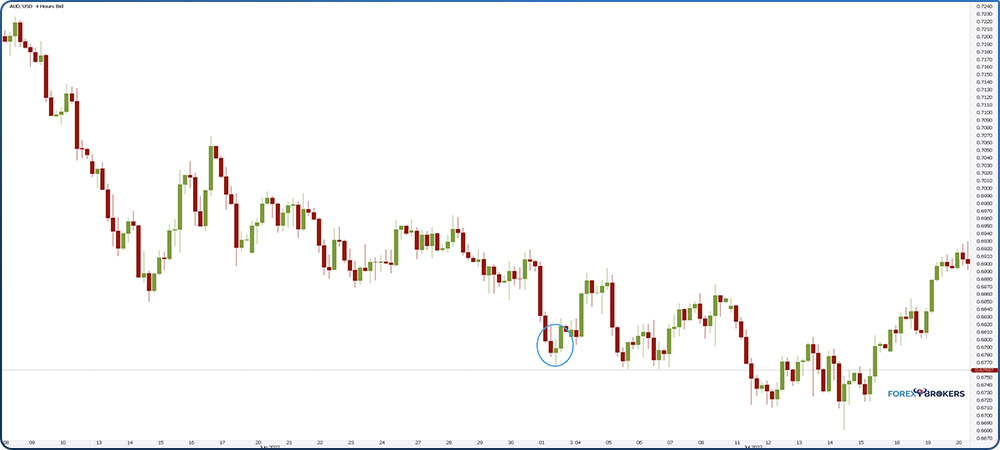
The AUD/USD chart presented below shows a possible morning star pattern. All conditions of a morning star pattern are in place; the market even bounced but failed to rally as it did in previous examples.
Check out our video about the Stars and Engulfing patterns:
Engulfings
The last part of the article presents the engulfing pattern. Just like stars, engulfings are reversal patterns.
The difference is that the engulfing pattern has two candlesticks instead of three. Therefore, it takes less time than it takes a star to form.
Out of all Japanese reversal patterns, engulfings are the most trickier ones. Traders confuse them easily, and that ends up in poor trading results.
Another distinction between engulfings and stars is that a pullback is not mandatory to follow after the pattern's completion. Finally, the risk-reward ratio differs. For engulfings, it is smaller, of just 1:2.
Nevertheless, such a risk-reward ratio is difficult to find and use with many trading setups. Because of that, the trader should not ignore the engulfing pattern whenever appears on a chart.
Bullish and Bearish Engulfings
Only two candlesticks are needed for an engulfing, but that does not make the pattern easy to identify.
The first candlestick should go in the direction of the underlying trend. Basically, nothing suggests that a reversal might be in the cards.
The trick is to interpret the second candlestick more precisely in the closing price.
As such, the rule of thumb states that the second candle's closing price must exceed the opening candlestick's opening price. That is the engulfing. However, the engulfing refers only to the real body and not to the tail as well. As such, the pattern is incorrect whenever the second candlestick also engulfs the previous candlestick's tail.
The engulfing pattern can easy to be mistaken for another Japanese candlestick pattern – the piercing.
The difference between the engulfing and the piercing pattern is that the second candlestick in the piercing pattern should close below the first candlestick's opening level but above 50% of the first candlestick's real body.
Bullish Engulfing
A bullish engulfing forms at the end of a bearish trend. Therefore, the trader must check if bearish trending conditions exist by looking for a series of higher highs and higher lows.
The first candlestick aligns with the overall bearish trend, but the second candlestick is bullish. As a result, it should end above the first candlestick's opening price but not above the highest point in the first candlestick's upper shadow. Put simply, it should end between the highest point in the first candlestick and the first candlestick's opening price.
A bullish engulfing pattern is much more powerful than a piercing pattern.
Bearish Engulfing
A bearish engulfing is just the opposite. The first candlestick goes in the direction of the underlying bullish trend.
Next, the second candlestick should close below the previous candlestick's opening price but above the previous candlestick's lowest point. If these two conditions are met, then the market forms a bearish engulfing pattern.
Examples of Engulfing Patterns
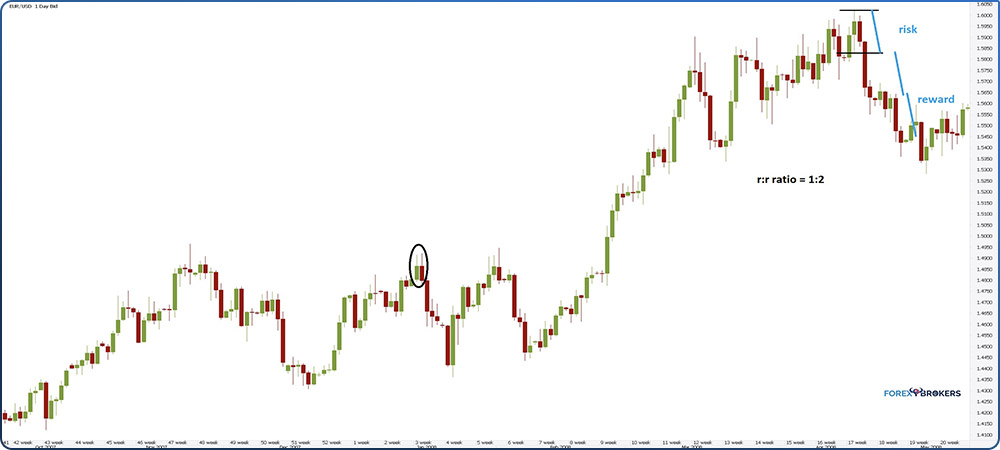
The EUR/USD daily chart presented below shows two examples of a bearish engulfing pattern. Focus on the second candlestick in both cases.
In both cases, the real body is bigger than the previous candlestick's real body. Also, it does not close below the lowest point in the previous candlestick.
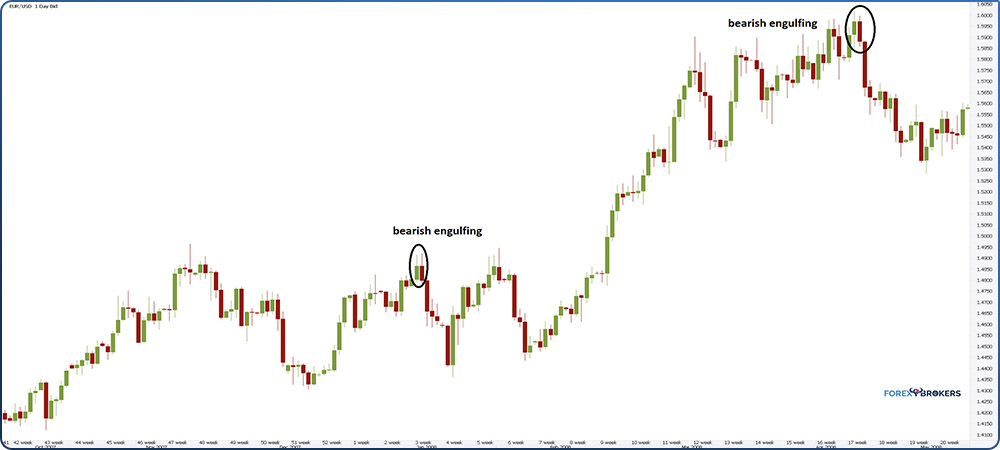
The second example on the chart above shows a special bearish engulfing. What is special about the setup is that the two candlesticks part of the engulfing pattern appear at the end of a rising wedge.
Rising wedges are classic technical analysis patterns suggesting a reversal is imminent because the Japanese reversal pattern formed in the same place reinforces the bearish scenario.
So what should a trader do? Remember that any trade risk should not exceed 1% or a maximum 2% of the trading account. In such a trade, where the setup is reinforced by another pattern pointing in the same direction, the trader might trade with the maximum risk the money management system allows.
How to Trade the Engulfing Pattern
Trading the engulfing pattern differs from trading morning and evening stars, but the two setups have some things in common.
For example, the first step in both cases is to mark the pattern's highest and lowest points with two horizontal lines.
Unlike the morning star, no pullback is expected. Therefore, the distance covered by the two candlesticks represents the risk taken. Remember that the number of pips can be adjusted so that the percentage risked on any given trade will not exceed 1% or a maximum of 2%.
Finally, the risk: reward ratio should be 1:2. Effectively, it means that the trader expects double the reward for the risk taken.
Conclusion
Japanese candlestick patterns offer a great way of trading with a disciplined attitude. This article presents a simple setup for building a proper management system and shows how to correctly interpret stars and engulfing patterns.
Morning and evening stars, as well as bullish and bearish engulfings, are reversal patterns. This allows for great risk-reward ratios of 1:3, respectively 1:2. Both patterns require a small number of candlesticks for completion – stars need three candlesticks, engulfings only two.
For their correct interpretation, the technical trader must be aware of two tricks. One is to avoid stars that have as the middle candlestick one that forms on a Sunday. Another is to make sure that the second candlestick in the engulfing pattern does not exceed the lowest (in a bearish pattern) or the highest (in a bullish pattern) point of the previous candlestick.
All in all, these are relatively simple patterns. Their advantage is that they appear on all the timeframes and their interpretation is the same. Also, needs far less time than classic technical analysis patterns.
This trading academy presents many articles dedicated to Japanese candlestick patterns. Because of their simplicity, they are patterns that are easy to understand, discover and trade.
