
531
One of the most underrated technical analysis tools is Andrews’ Pitchfork. The basic concept behind Andrews’ Pitchfork is fairly simple – 3 parallel lines designed to forecast future price action.
Yet, this is not a simple technical analysis tool like a trendline or channel. Over time, trading with Andrews’ Pitchfork has led to an entire trading theory with plenty of intriguing concepts and controversies.
Trading with Andrews’ Pitchfork evolved over the years. The concept is very old, even older than the Elliott Waves Theory, Gartley and Gann.
In this article, the focus is on introducing the tool, its elements, and the way to use it. Moreover, we will look at additional concepts used together with Andrews’ Pitchfork, such as integrating the lower lows/lower highs and higher highs/higher lows series with the tool. Furthermore, concepts like the Schiff line will add to the complexity of Andrews’ Pitchfork, helping to build a trading theory rather than a simple trading tool.
Selecting the starting points is the most difficult part of using Andrews’ Pitchfork. The 3 parallel lines must start from somewhere, and the way to do it started a controversy in the decades after Dr. Alan Andrews introduced the concept to the technical analysis community for the first time.
We will dedicate, therefore, a big part of this article to how to set the starting points, also called the pivot points. In doing so, we will use plenty of examples from today’s currency market.
Nowadays, any modern trading platform offers the Andrews’ Pitchfork tool. It is integrated into the default settings of all retail traders’ platforms and sometimes even variations of the original tool exist. Prepare for a detailed explanation of the concept using plenty of practical examples.
A Short History of Dr. Alan Andrews’ Pitchfork
The theory was created in the 1960s by Dr. Alan Andrews and has undergone some changes. At the time, it was selling for $1,500 to the investing community and that was not a small price to pay in the 60s.
In time, the theory went through some changes. Roger Babson helped Alan Andrews develop the tool, and he is also credited with some concepts, especially where to place the pivot points. Another friend, George Marechal, contributed to the tool as well, and basically, the final version is the creation of the 3 minds. However, the final version of the tool is credited to Dr. Alan Andrews as part of his technical analysis techniques called the Action/Reaction techniques. Andrews’ Pitchfork was one of them.
What Does Andrews’ Pitchfork Look Like?
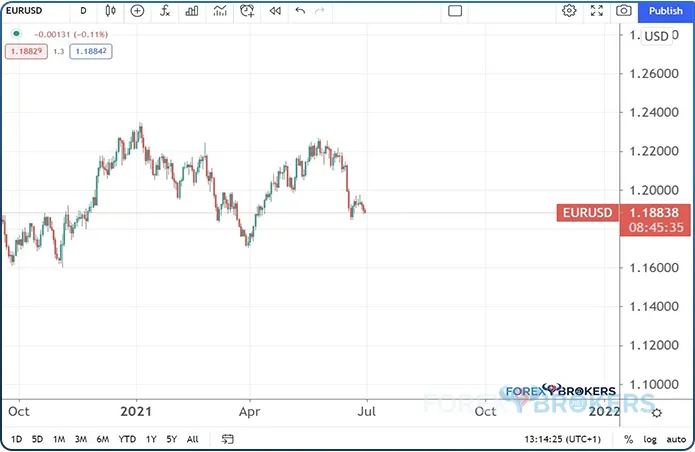
As mentioned earlier, Andrews’ Pitchfork is part of any modern trading platform. Below is the recent EURUSD price action, showing how 2021 played off up to the time of writing this article.
Focus on the price action from the start of the year. The EURUSD pair declined from above 1.23 to 1.17, only to bounce back above 1.22 ahead of the FOMC June meeting. At the June meeting, the Federal Reserve of the United States surprised the markets by delivering a hawkish statement. More precisely, the central bank signaled more rate hikes than the market expected and sooner. As such, the EURUSD pair dropped from above 1.22 to 1.18.
The big question here is – where will the EURUSD go next? Is the previous bullish trend over? We should mention here that the EURUSD pair trended higher during the 2020 COVID-19 pandemic. It bounced from around 1.06 to 1.23 on the back of a weak USD. But at this point, traders should use technical analysis tools to help them trade the current price action.
Ideally, the tools used should be able to provide a forecast and an invalidation level. Andrews’ Pitchfork is such a tool.
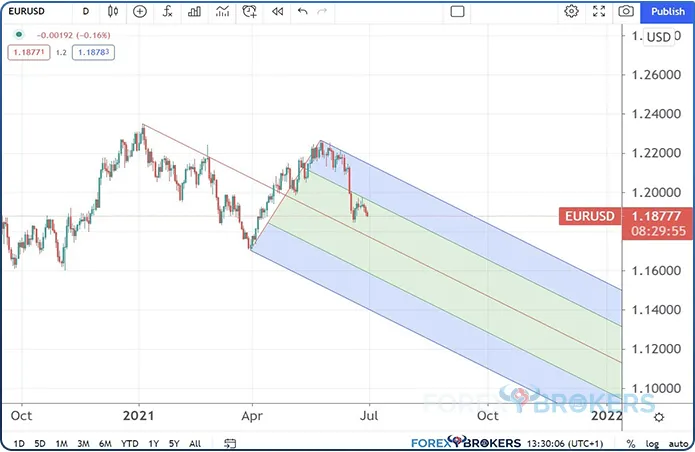
The pitchfork is formed of 3 lines. More precisely, we should say that it is formed of 3 main lines because the original tool has many variations. For example, the chart above shows the 5 lines. However, in reality, the 2 green lines are only there to signal the 50% dynamic support or resistance when the price is inside the channel.
As you can see, the pitchfork starts from a high; it uses the recent low and the first higher low. Basically, the tool is useful when traders expect a new trend to form and it can be used after the fact. For instance, it does not matter if the market is already trending as long as the trader knows precisely where to place the pivots.
Three Pivot Points – P0, P1, P2
When using Andrews’ Pitchfork, setting the pivots is all that matters. Because the 3 parallel lines start from the pivot points, changing the starting level results in changing the tool’s angle. Therefore, the forecast is altered by simply using the wrong pivots.
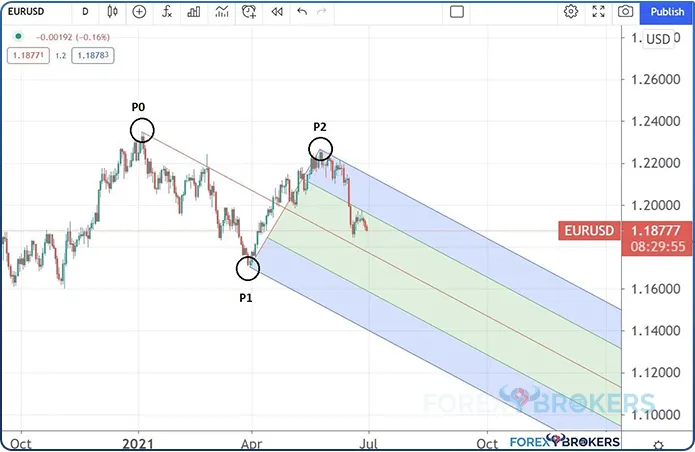
The pivots are labeled P0, P1, and P2. However, the software does not mark them, so the chart above shows them only to enable you to form the correct idea.
The P0 marks the start of the pitchfork. It is typically the highest or lowest point in the previous trend, although it is not mandatory. Another article part of this trading academy that deals with Andrews’ Pitchfork will focus on integrating the tool with the Elliott Waves Theory. You will learn that Andrews’ Pitchfork can be used from the end of an Elliott wave, which does not need to be the highest or lowest level in the previous trend.
In any case, P0 always belongs to the previous market trend. If that trend was bullish, like in the case of the EURUSD above, the P0 is the last higher high. If, on the other hand, the trend was bearish, the P0 is the last lower low.
The other 2 pivots, P1 and P2, are responsible for the pitchfork’s angle. In a bearish trend, P1 is typically the first low, while P2 is the first lower high. In a bullish trend, P1 is typically the first high, while P2 is the first higher low.
Now that we know what the pitchfork looks like, let’s focus on its elements. More precisely, on the 3 parallel lines that start from the 3 pivots.
Andrews’ Pitchfork Elements
While interconnected, the elements must be interpreted together. We already know that the 3 lines start from the 3 pivot points, but it is important to find the right place for the pivots. Otherwise, the 3 lines would not make sense.
The 3 lines that start from the pivot points are:
- UML – Upper Median Line
- LML – Lower Median Line
- ML – Median Line
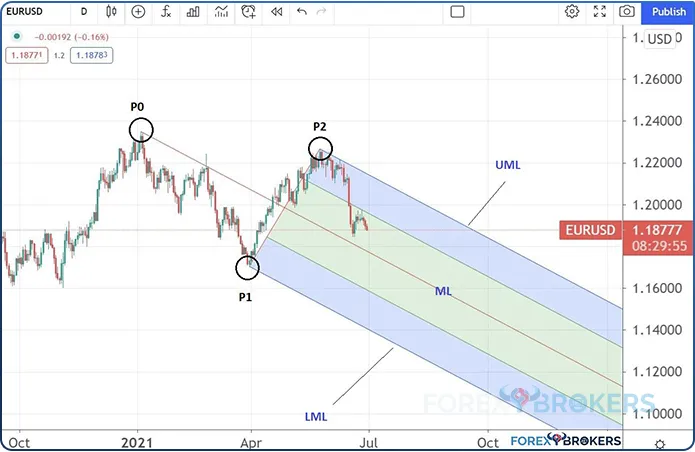
Upper Median Line
Andrews’ Pitchfork may be set to show a trend (bullish or bearish) or a horizontal consolidation area. In all cases, the Upper Median Line (UML) offers support in a bullish trend and resistance in a bearish trend and a horizontal consolidation.
In the case of the EURUSD example used in this article, the UML defines the upper edge of the falling channel. Therefore, it offers dynamic resistance on every attempt for the market to move higher.
However, a move above the UML during a bearish trend is not inconceivable. It does not invalidate the bearish trend – only a move above the Schiff line would do so. In case you’re wondering what the Schiff line is, the concept will be introduced later in the article.
Lower Median Line
The Lower Median Line (LML) is derived from the P1 in a bearish trend and it offers dynamic support. It also offers support during a bullish trend, but in such conditions, it is derived from the P2 rather than the P1.
But the 2 lines are not the center of attention when it comes to trading with Andrews’ Pitchfork. The line to focus on instead is the Median Line (ML).
Median Line
The ML is the most important element part of Andrews’ Pitchfork. It has a great characteristic – it attracts price.
That being said, it is worth mentioning that it is not mandatory for the price to reach the ML, but it happens very often. When it doesn’t, the pitchfork is not invalidated as long as the invalidation level given by the Schiff line is not crossed. More about that later.
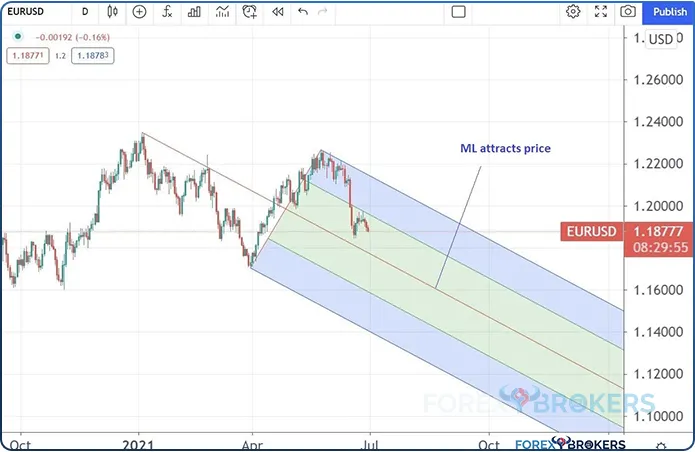
For now, keep in mind that the ML attracts price. When correctly integrated with the Elliott Waves Theory, Andrews’ Pitchfork is useful in identifying the end of the third wave in a third-wave extension impulsive move or the end of an a-b-c correction. In both cases, traders assume that the Elliott Wave structure ended by the time the price action reached the ML.
Schiff Line
A very important concept of trading with Andrews’ Pitchfork is the Schiff line. It is not known precisely where the name Schiff comes from, but it is secondary in importance.
What matters is knowing how to use the line and what it means for the overall market interpretation. The rule of thumb says that the Schiff line acts as an invalidation of the pitchfork’s setup.
Drawing the line is very simple. All we have to do is connect the P0 and P2 in our EURUSD example and project the line on the right side of the chart.
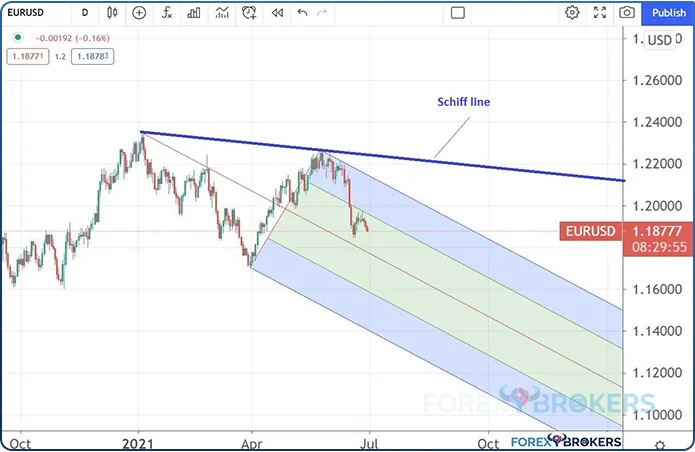
Now we have a better picture of all the pitchfork’s elements. This does not mean that the market must reach the ML or the LML. But it does mean that the price action remains bearish while below the Schiff line.
Therefore, traders willing to initiate a short position may want to place the stop-loss order at the Schiff line. Even better, some traders wait for the market to close above the Schiff line before deciding if the bearish setup was invalidated.
How to Set the Pivot Points
By now, it is clear that one of the greatest challenges of trading with Andrews’ Pitchfork is setting the pivot points. To illustrate how to do this correctly, we will use another example, this time from the EURJPY price action.
The EURJPY cross evolved in a bullish trend during the COVID-19 pandemic. From May 2020, it bounced from 115 and did not look back all the way to the 134 area. By using Andrews’ Pitchfork, we can easily track the bullish trend, knowing in advance what levels to add to the longs and where the market might react.
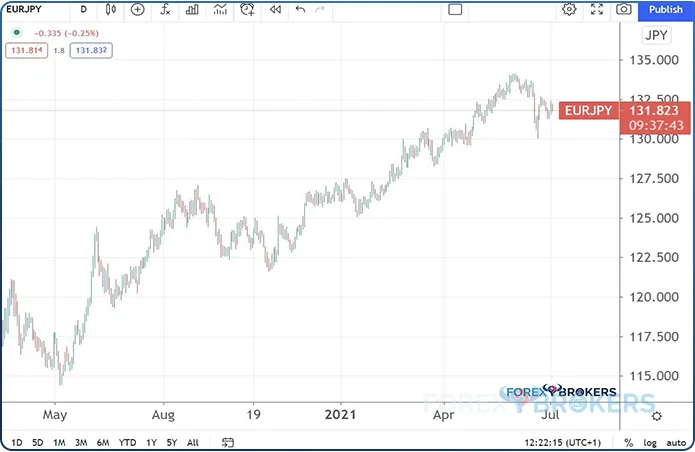
The first step is to check the previous trend’s invalidation. In our example, the EURJPY pair formed a bearish trend prior to the bounce from the 2020 lows. Like any bearish trend, it was characterized by a series of lower lows and lower highs. As long as the series remains in place, we cannot use Andrews’ Pitchfork for the simple reason that we do not know if the previous lower low will also be the last one.
As such, the first thing to do is to make sure that the bounce is strong enough to break above the previous lower high. On such a move, the bearish trend is invalidated.

Somewhere between June and July, the EURJPY pair broke decidedly higher. The 121 area acted as strong resistance; when it was broken, the market invalidated the previous lower high. From this moment on, the previous trend was invalidated.
However, it is not enough to draw the Andrews’ Pitchfork. Remember that we need 3 pivot points confirmed. At this point, we know the previous market low, which acts as P0. Next, the move higher that broke the previous lower high acts as P1. How about P2?
Waiting for Market Confirmation before Drawing the Pitchfork
So far, we have said that a rising pitchfork uses the previous low, the first higher high and the first higher low. However, there is a catch.
The confirmation for the P2 comes only after the market makes a new higher high. Until that happens, Andrews’ Pitchfork cannot be used.
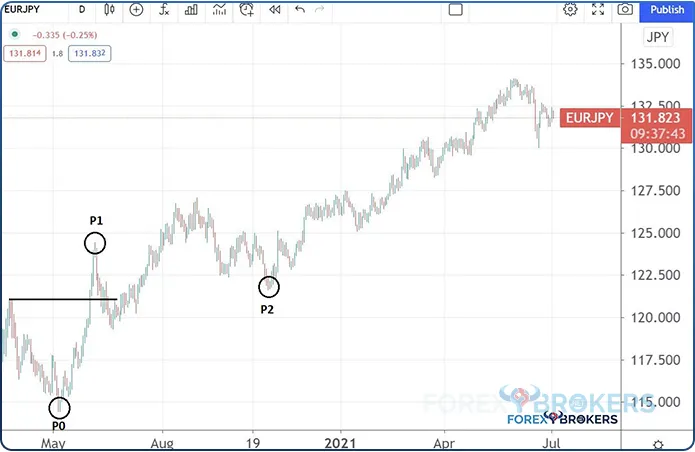
Let’s follow the price action on the chart above, from left to right. First, we see that the market broke above the previous lower high.
Second, the bullish price action continued, and it even made a new higher high. However, the first swing lower formed too abruptly, making it impossible to use Andrews’ Pitchfork. Thus, all traders needed to do was wait for a new higher high. The higher high came toward the end of 2020, and that is the moment that we have confirmation for all 3 pivot points. Hence, we can use Andrews’ Pitchfork to define the rising trend.
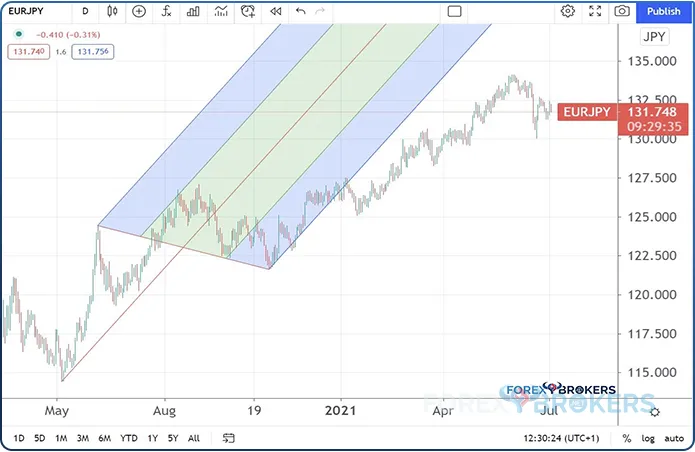
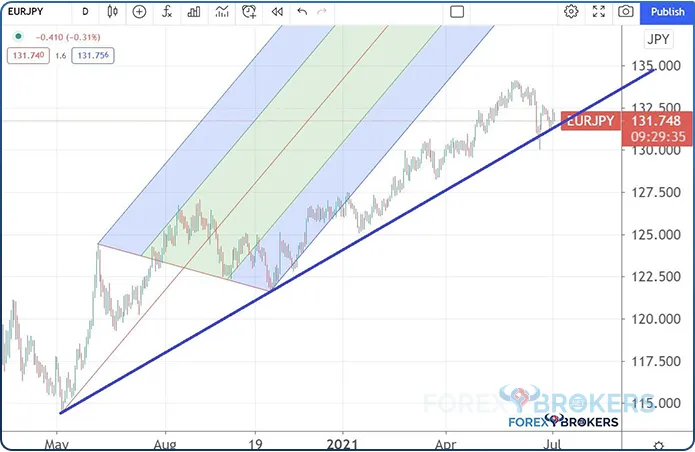
This is how Andrews’s Pitchfork looks like when applied correctly, using the rules described in this article. We see that after P2, the price action was not strong enough to reach ML despite this line being known for attracting price. However, it is not mandatory to do so. What matters for the Pitchfork trader is the ability of the price to stay above the Schiff line.
It did so until recently, as the Schiff line acted as dynamic support all the way to the 134 level. But a recent decline to the 130 level pierced the Schiff line for the first time. Is this enough to call an end to the bearish trend? No, because the market bounced back above the Schiff line. However, it is a sign of weakness, and bullish traders may want to close the positions on such a sign as the price keeps pressing against dynamic support.
How to Trade with Andrews’ Pitchfork – Examples
The remainder of this article is dedicated to examples. The best way to learn is through examples; before we start, there are some things to mention.
First, Andrews’ Pitchfork, as a tool, has undergone numerous changes. Nowadays, some trading platforms offer additional tools besides the original one, such as the Schiff Pitchfork or the Modified Schiff Pitchfork. What is important to remember is that these are only different ways of looking at the same thing.
Second, it turned out that some projections from the initial levels are worthy of a trader’s attention. Once again, as is the case with multiple trading theories or tools, the Fibonacci levels play a crucial role.
Therefore, in some of the following examples, you may note projected levels above or below the UML or LML, respectively. The Fibonacci levels give birth to some of the most powerful dynamic support or resistance levels in today’s technical analysis.
Third, we will introduce a new concept. It refers to the confirmation of the pivot points. More precisely, after the process used to properly find the pivot points, there is one thing to check – how the price action treated the ML before the trader was able to plot the pitchfork. If there is some kind of rejection, 2 conclusions can be drawn.
One respects the interchangeability principle. If the price found resistance on the ML prior to the pivot points’ selection, the likelihood is that it will find support the first time when the price action reaches the ML after the pivot points’ selection. Hence, the confirmation offers us an educated guess about what to do when the price hits the ML for the first time.
Having said that, let’s have a look at how to trade with the Andrews’ Pitchfork tool.
Trading the Pivot Points
The first strategy to illustrate involves the 3 pivot points. More precisely, this is a strategy to use from the moment that the trader can draw the pitchfork.
In a rising trend, the entry point is when the market makes a new higher high, thus confirming the last pivot point. The full setup requires the following steps:
- Wait for the market to make a new higher high when compared to the first pivot point.
- Go long on a close above the level.
- Place the stop-loss order at the previous higher low.
- Set the take-profit order by using a risk-reward ratio of 1:2.
- Book half the profits when the market reaches a risk-reward ratio of 1:2 and move the stop at break-even for the rest.
- If the price breaks below the Schiff line, exit the trade.
EURJPY – Trading a Bullish Trend with Andrews’ Pitchfork
The EURJPY pair has been in a bullish trend since the COVID-19 pandemic began. Investors sold the Japanese yen and bought the euro as the Japanese yen pairs have a direct correlation with the stock market indices in the United States. Thus, strong performance from the US stocks also led to a strong performance for the Japanese yen pairs.
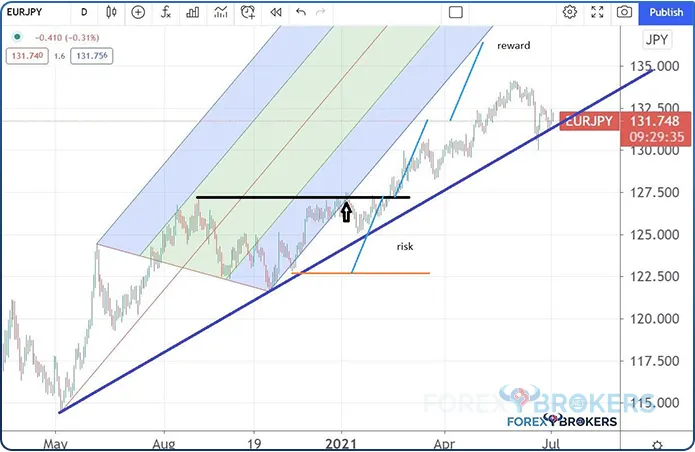
From left to right, the market bounced from the lows and broke the previous lower high. That is the moment when we can identify P1. However, we cannot use the first higher low for the P2 because the decline was too abrupt. Hence, we must wait for a new higher low and a higher high to correctly draw the pitchfork.
The 127.50 area is the entry and the strategy required a stop-loss order at 122.50. While five hundred pips is a lot for a stop-loss, traders must remember that the risk must be adjusted to the size of the trading account.
For example, by risking 1% on any given trade, the distance to the stop-loss order does not really matter. All traders need to do is adjust their volume in such a way that if the market reaches the invalidation level, the loss will not exceed 1%.
Moving forward, we see that the market reached the 1:1 risk-reward ratio at 131.75. At that place, the strategy requires booking half the profits and tightening the stop for the rest of the position by raising it to break even.
The market did not reach its original target, but it did break the Schiff line. This is a signal to exit the trade because the bullish trend looks weak. As such, further profits were made for the rest of the position.
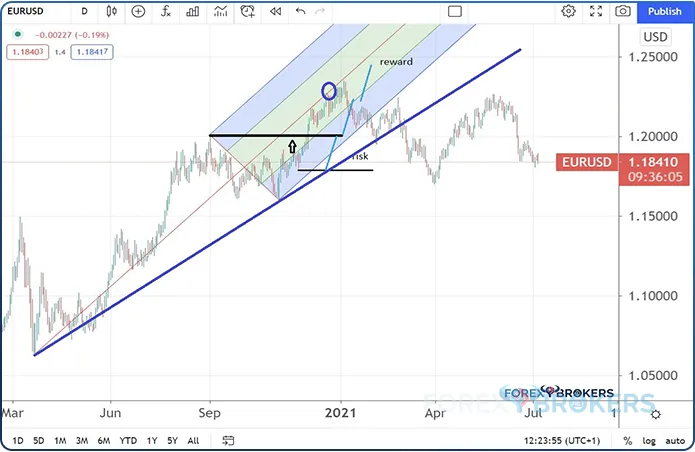
EURUSD – Bullish Pitchfork Setup Late in a Rising Trend
The next example comes from the EURUSD pair. Just like the EURJPY pair, the EURUSD was bullish during the COVID-19 pandemic.
Despite the fact that the European Central Bank eased the monetary policy to support the economy, so did the Fed. The difference between the two quickly affected the EURUSD pair, which rose from 1.07 to over 1.23.
But it is only in late 2020 that the Andrews’ Pitchfork setup could be used. The problem before that was that the market needed to break the previous lower high, as explained earlier in the article.
After the market broke above the highs in the P1, or above 1.20, traders could go long with a stop-loss order at the previous higher low. We also see in this setup how the ML attracts the price.
The trader needed a stop of about two hundred pips, close to 1.18; thus, we can calculate the reward using the 1:2 risk-reward ratio. In other words, by risking two hundred pips, the equivalent of 1% of the trading account, we expected to gain four hundred pips, the equivalent of 2% of the trading account.
However, we notice that the market reached the first checkpoint or the 1:1 risk-reward ratio, and then quickly reversed. Because the stop-loss was already raised at break-even, we avoided any loss and added 0.5% in profit for the trading account. Eventually, on its way lower, the market also broke below the Schiff line.
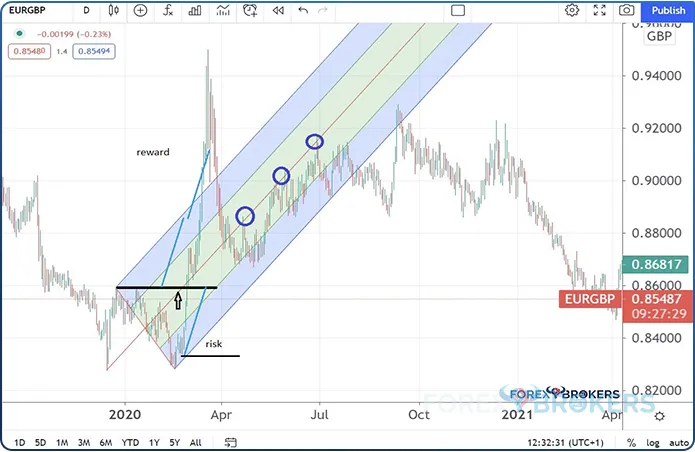
EURGBP – Bullish Setup before the Brexit Referendum
The EURGBP cross offered some of the most interesting setups during the Brexit referendum of 2016 and the years it took the 2 parties to negotiate the divorce. Here is a setup forming at the end of 2020 with the entry on the long side at the end of the first quarter, just about the time the COVID-19 pandemic started.
To build the pitchfork, we see that the market did not make a new lower low for P2, thus offering the chance to go on the long side on the first break above the high in P1. For this trade, the risk was about two hundred and fifty pips, with an entry at 0.86 and a stop loss at 0.83.50. Again, the volume traded should be adjusted so the risk does not exceed 1% of the trading account.
It turned out that the move higher was so aggressive that the market reached the initial target shortly after. By following the steps described earlier, the trade gave a 1% gain (0.5% for the first half and another 0.5% for the second one).
Once again, we see the ML’s ability to attract price as the market tests the dynamic level 3 times before reverting.
Trading Dynamic Support and Resistance Levels with Andrews’ Pitchfork
The next examples refer to a concept familiar to the readers of this trading academy. Support and resistance is a classic technical analysis concept that respects the interchangeability principle. Also, support and resistance levels come in 2 forms – horizontal and dynamic.
Of the two, the dynamic levels are more difficult to break. They follow the price action closely.
Here is the EURGBP daily chart. It continues from where the previous chart left off. From the 0.94 area, the EURGBP dropped aggressively. The market consolidated until the Brexit negotiations ended in December 2020 and then the British pound started to appreciate against the euro.
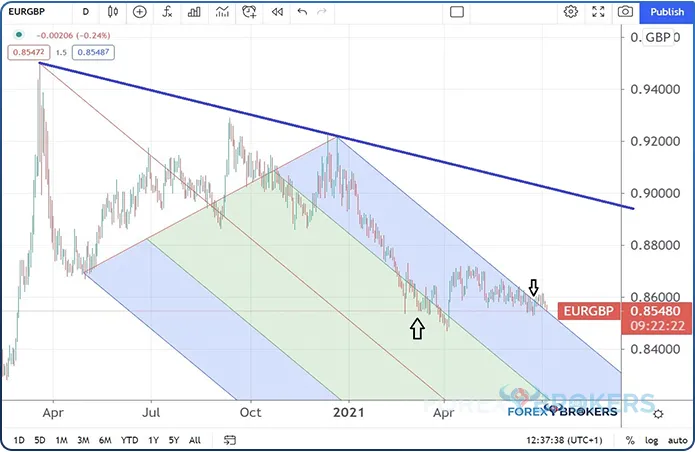
If we follow the rules to build the pitchfork, we see that the market found dynamic support and resistance at certain levels after Andrews’ Pitchfork was drawn on the chart. More precisely, the UML acted as dynamic resistance, while the 50% distance between the ML and the UML acted as dynamic support.
Andrews’ Pitchfork Confirmation
The next strategy described in this article deals with an interesting concept designed to reinforce the strength of the Andrews’ Pitchfork setup. It refers to the price action in the past before we were able to draw the pitchfork.
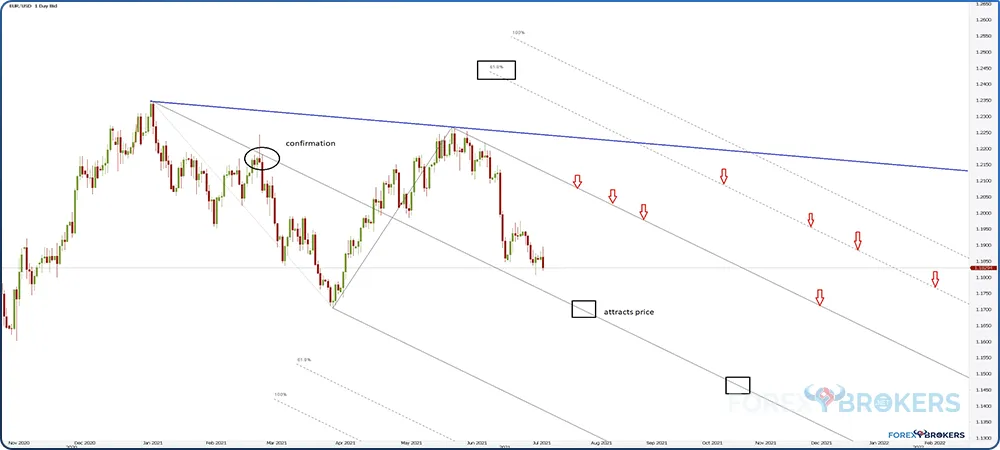
Below is the recent price action in the EURUSD chart. This is the daily timeframe and we were able to draw the pitchfork following the steps described in this article.
We see that this pitchfork is different. This broker gives traders the opportunity to further draw dynamic levels from the original lines. As such, we can add various Fibonacci levels to find relevant dynamic resistance, such as the 61.8% level, but more on that later in the article.
The concept of pitchfork confirmation refers to the market rejection from the ML before the 2 pivots were in place. In other words, after drawing the pitchfork, we should check if the market reacted to the ML in the past. If it did, it reinforces the pivot points and, thus the parallel lines that make the pitchfork.
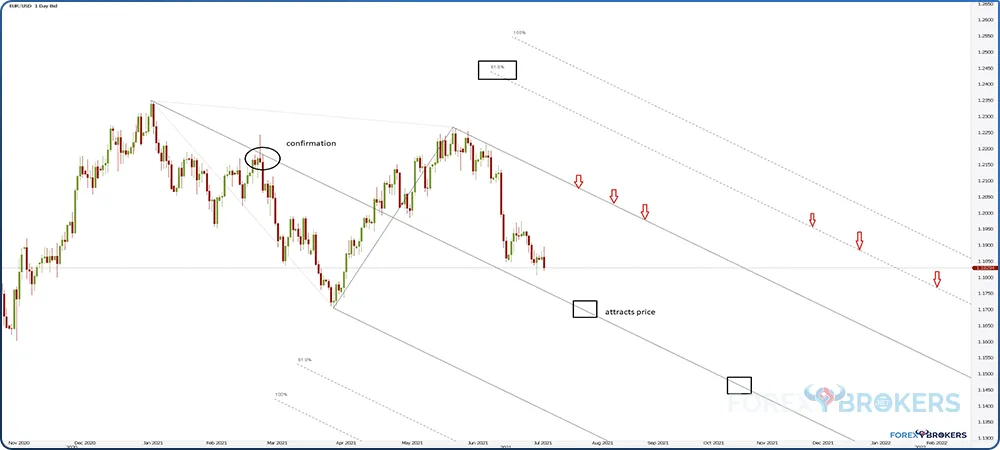
In this case, we see the EURUSD confirming the pitchfork. In fact, the market was rejected from the ML, as the line acted as strong dynamic resistance in the past.
By using the interchangeability principle described earlier, the ML should act as dynamic resistance the first time the price reaches it. Also, we should remember that the ML attracts price, but one should not insist on the short side by the time the EURUSD reaches that level. Dynamic resistance is expected at the UML and the projected levels on any possible bounce.
In case you are wondering why the red arrows are placed where they are, the answer comes from the Schiff line. Remember that a move above the Schiff line invalidates the bearish setup; thus, the projected lines cannot offer dynamic resistance if the market moves above the Schiff line.
USDCHF – How Andrews’ Pitchfork Confirmation Works
Our final example comes from the weekly timeframe. The USDCHF pair is one of the most heavily shorted currency pairs on the FX dashboard due to the Swiss franc’s safe-haven qualities.
Despite the Swiss National Bank keeping the interest rate in negative territory, the lowest in the world, investors still sold the Swiss franc on every bounce.
The example below shows the price action in recent years, and the most important thing here is the pitchfork’s confirmation. We see that the market confirmed the pitchfork’s placement. Moreover, the ML acted as strong dynamic resistance, suggesting that the first time the price reaches the ML after the pivot points, the ML will act as support.
We see how the market bounced from the ML 3 times in a row. Thus, the previous confirmation was enough for traders to find great areas from where the price might bounce.
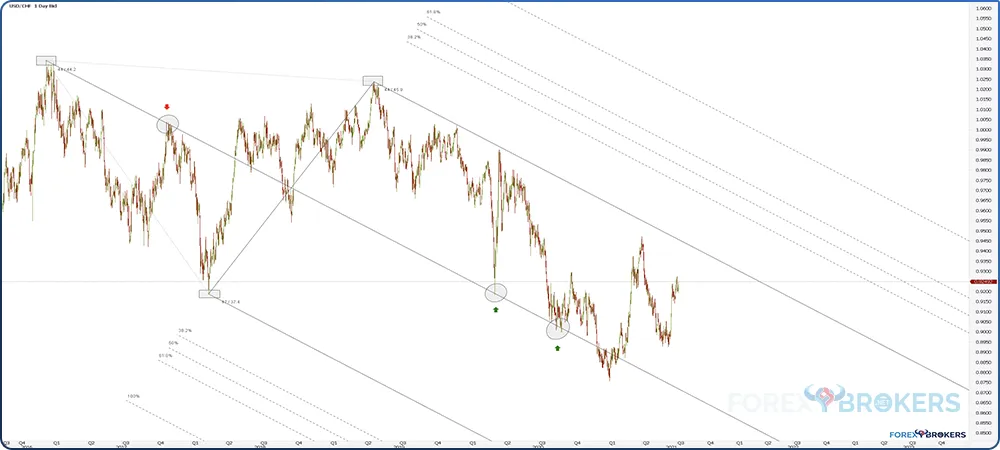
Building Dynamic Areas with Andrews’ Pitchfork
A dynamic area is an area where multiple support or resistance levels form. It is also an area that is difficult to break, especially if it forms on larger timeframes.
The same pitchfork on the USDCHF pair offers the perfect example of how to build a confluence area. For this, we need to use different Fibonacci levels and project parallel lines with the UML.
The 3 lines highlighted below are the 38.2%, the 50%, and the 61.8% distances from the UML. By drawing the Schiff line, we see that it makes sense to talk about a confluence area only below the Schiff line; otherwise, the bearish setup would be invalidated.
Remember that dynamic levels follow the price action and the price will have a hard time breaking above. Effectively, it means that on any future move higher, traders should avoid being on the long side by the time the market reaches the confluence area because it will find strong resistance.

Conclusion
Andrews’ Pitchfork tool is technical and has made its way onto all modern trading platforms. It is formed by 3 parallel lines derived from 3 pivot points and offers a clear view of future market action.
This article introduced the concept and used various examples to show how to trade with Andrews’ Pitchfork. The beauty of these strategies is that they work on all the timeframes and markets, thus offering plenty of opportunities to the disciplined trader.
The article also focused on money management and how to implement risk management principles in any trading setup. Risk management must accompany any trade to avoid unnecessary drawdowns.
Andrews’ Pitchfork has undergone changes over time. From the initial, simple concept, many different variants appeared. However, the 3 parallel lines are at the center of any pitchfork and traders should pay extreme attention to the pivot points.
Choosing the right places for the pivot points has historically been controversial. One of the aims of this article was to offer a clear solution of how to do so, as all the trading strategies and Andrews’ Pitchfork’s interpretation depend on it.
Finally, this is not the last article dedicated to the subject. This trading academy takes the concept further and shows how to integrate the pitchfork with the Elliott Waves Theory. Together, the 2 technical concepts make it easier to count the Elliott Waves and thus to profit from every market swing.
Related Lessons


See more from this category