

532
Many types of triangles exist in technical analysis, and no one studied them better than Ralph Elliott. Elliott put the basis of the Elliott Waves Theory back in the 1930s, and, in the meantime, various other technicians contributed to it.
Every trader knows what a contracting triangle looks like – its trendlines converge towards a common point on the right side of the chart. But contracting triangles are of multiple types, such as horizontal, irregular, running, and so on.
Elliott went even further and discovered that some triangles, mostly contracting ones, have different roles when counting the market waves. He broadly classified them as limiting and non-limiting triangles.
As the name suggests, the price action following a limiting triangle is "limited." In other words, only a marginal new high or low should be expected before a price reversal.
In contrast, a non-limiting triangle does not impose any limitation on future price action. Out of the two, limiting triangles are the rarest ones, while non-limiting form most of the time.
However, when limiting triangles appear on a chart, they give traders plenty of information about future market moves to make anticipating future price levels easier. This article will cover both limiting and non-limiting triangles, emphasizing limiting triangles.
That is because limiting triangles must respect so many rules, and if only one is broken, the pattern does not fit. But if it does, it offers incredible opportunities.
But we won't limit ourselves to these triangles only. Instead, we will also cover the non-limiting triangles in detail because they are very common and have an interesting characteristic – they appear only as part of complex corrections.
Contracting and Expanding Triangles
A general feature of any triangle is that it is formed out of five segments. Because all five segments are corrective, the Elliott trader should use letters to label a triangle – a-b-c-d-e.
Another feature of a triangle is that it can only expand or contract. Therefore, interpreting the b-d and the a-c trendlines gives us the triangle's nature.
By connecting the end of waves b and d, respectively, a and c, it becomes clear if the triangle is contracting or expanding. For the sake of simplifying and not repeating things, this article deals only with contracting triangles for two reasons.
One is that everything regarding contracting triangles is valid for expanding triangles, too. Another is their frequency – contracting triangles form more frequently than expanding ones.
Therefore, we can say that contracting and expanding triangles are limiting or non-limiting. However, contracting triangles form more often; this article presents only limiting and non-limiting triangles.
Because limiting triangles form more often, there are many rules such a triangle must follow. This is why the main focus of this article is on limiting triangles, as it is paramount for the Elliott trader to understand how they form, where they appear, and how to interpret them.
Limiting Triangles
Limiting triangles do not form often. Just the opposite.
One of the reasons is that a limiting triangle must respect so many rules that even if one single rule is broken, the pattern fails to fall into this category. But this is what makes these triangles so special.
Because they do not form so often, there is little to find out about them in the technical analysis literature. However, their scarcity is just the right ingredient to make them powerful patterns.
The essential thing to remember when interpreting a limiting triangle is that it accurately predicts the price action to follow after its formation. Moreover, it does so for both the current Elliott structure and the upcoming one.
Limiting triangles are difficult to find before their end. However, they are easy to spot afterward and can still reward the trader because of the pattern's implications on future price action.
Perhaps the most important characteristic of a limiting triangle is what it signals. But it signals a top or a bottom. The market will have a hard time advancing or declining after a limiting triangle, and very often, it forms a terminal impulsive wave.
Where Do Limiting Triangles Form?
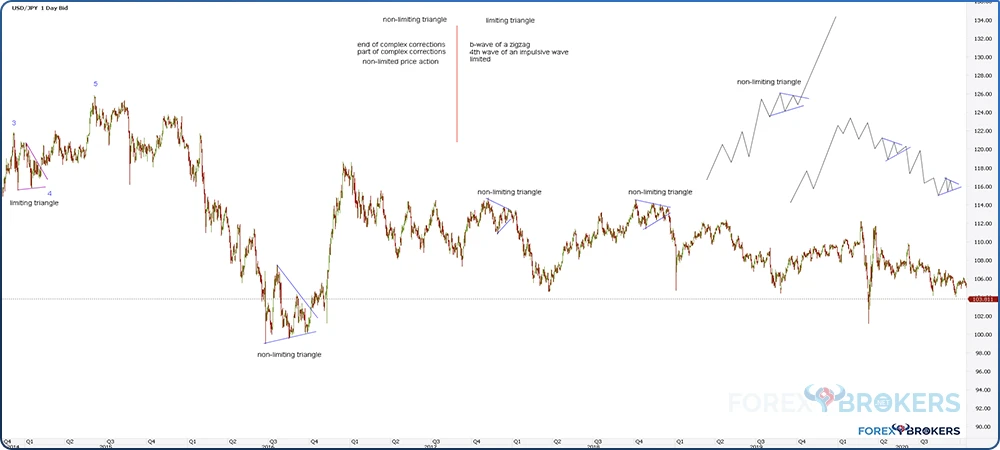
One characteristic that makes limiting triangles scarce is that they appear only in two places. One is the 4th wave of an impulsive move, and the other is the b-wave of a zigzag.
In both cases, the price action that follows is limited in the sense that a top or a bottom must follow. If the limiting triangle is the 4th wave of an impulsive structure, the 5th wave marks the top or the bottom, depending on the impulsive wave's structure – bullish or bearish. Similarly, if the limiting triangle is the b-wave of a zigzag, the c-wave that follows gives the top or the bottom.
Just like that, the Elliott Waves trader can disregard any other possible place where a limiting triangle may appear—trading a limiting triangle is extremely rewarding.
Rules of a Limiting Triangle
The reason why a limiting triangle does not form so often is the fact that the pattern must respect plenty of rules. And it all starts with the apex.
The key to interpreting a limiting triangle is the apex. As a reminder for the Elliott trader, the apex of a contracting triangle is the intersection point of its two trendlines – the a-c and the b-d trendline.
The first thing to do before interpreting a triangle as limiting or non-limiting is to find its apex. Ideally, the trader should mark the level with a horizontal trendline, which will turn out to be extremely useful in interpreting future price action.
Something to keep in mind here. In the case of limiting triangles, the apex is always close to the triangle's end. However, in the case of non-limiting triangles, the apex may be close to the triangle's end or far away on the right side of the chart because the two trendlines may end up being almost parallel.
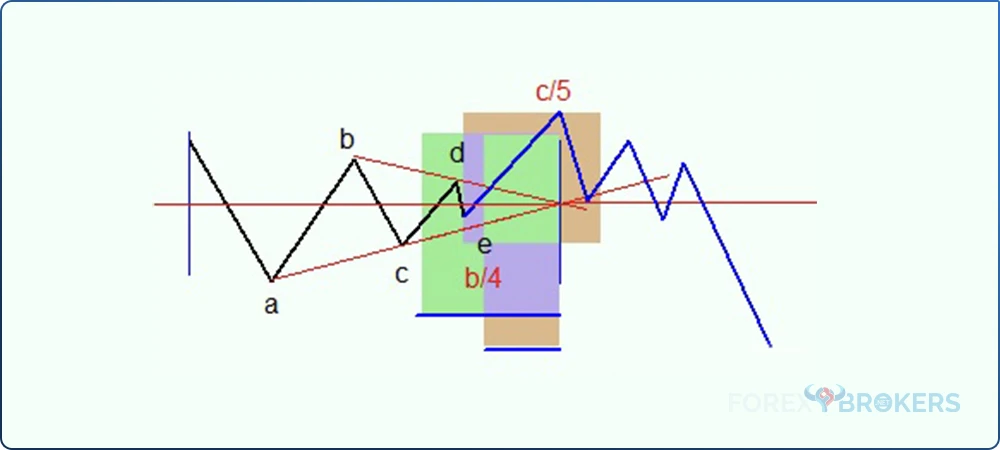
The image above shows a limiting triangle, and the horizontal red line is the apex. Focus on the labeling – the triangle is either the b wave of a zigzag or the 4th wave of an impulsive move. Therefore, it means that the following move can only be the c-wave of a zigzag or the 5th wave of an impulsive move.
After finding the apex, the next step is to use the time element in the triangle's interpretation. To do so, use a Fibonacci time zone tool (offered by all trading platforms) and measure the time taken from when the triangular pattern started until the apex's time zone.
For example, the most popular platform for the retail trader, the MetaTrader platform, offers the tool under the Fibonacci tab to be found when clicking on the Insert tab on the main menu.
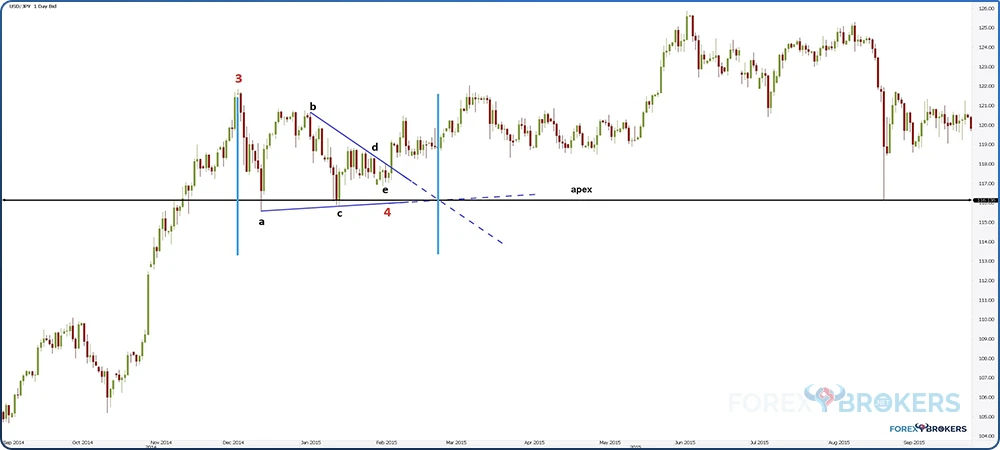
In short, measure the time from the beginning of the triangle until the apex. The rule says that the triangle must end before 20%-40% of the apex. In the picture above, the green area represents 40% of the said distance, so the time rule regarding the apex is respected.
Time is very important when interpreting a limiting triangle. By failing to understand its importance, the Elliott trader will have difficulties interpreting the Elliott Waves Theory correctly.
Interpreting the Thrust of a Limiting Triangle
The next thing to consider is the thrust of a limiting triangle. The thrust is the triangle's equivalent of the measured move to follow after the price breaks the b-d trendline.
Any pattern's measured move represents only the minimum distance that the market must travel. For example, think of the head and shoulders pattern presented here in this trading academy, too.
The head and shoulders is a reversal pattern, meaning that it forms at the end of bullish trends. Its measured move equals the distance from the highest point in the head to the neckline, projected from the neckline.
But that is only the minimum distance that the market should travel to confirm the reversal pattern. The market can easily move well beyond the end of the measured move.
However, this is not the case for a limiting triangle's measured move. Because of its nature, the triangle contains the price action, and the end of the measured move is usually a good place for taking an opposite trade.
Depending on the type of the triangle (e.g., horizontal, irregular, etc.), the thrust or the measured move differs. In the case of a horizontal triangle, the market cannot go much more than 75% of the triangle's longest wave.
On the other hand, in the case of an irregular contracting triangle, the thrust should be around 75% of the longest wave.
As such, simply measure the a-wave of a horizontal contracting triangle and find 75% of it. By projecting it from the end of the e-wave, the Elliott trader finds out the potential end of the c-wave of a zigzag or the 5th wave of an impulsive move.
Or, in the case of an irregular triangle, simply measure the length of the b-wave and find out 125% of it. Because the b-wave is the longest segment of an irregular triangle, this is the segment to use for finding out the measured move.
Interpreting the Time Element
Once again, the time element is crucial in the interpretation of a pattern part of the Elliott Waves Theory. This time, the rule says that the measured move, or the thrust, must be reached in less than 50% of the time taken by the triangle.
Therefore, the thing to do is to use a Fibonacci time zone tool once again and measure the time from the start of the triangle until the end of it (i.e., the end of the e-wave). Next, use a shape and measure half that distance. Finally, project it from the end of the e-wave. The measured move must come in less than that time.
So, not only that the Elliott Waves Theory give us the distance that the market should travel after the triangle's breakout (i.e., the measured move), but it also gives us a time limit for it. If the time expires and the market does not reach the minimum distance or the thrust, then there is a different interpretation of the limiting triangle. But more on that a bit later.
Still, there is one more rule to look for in interpreting the time element. That is – the thrust of the triangle must come in the time zone of the apex.
In other words, use a vertical line to mark the time zone of the apex. The measured move, or the thrust, must come around that time and in less than half of the time, it took the limiting triangle to form.
A New High or Low Is Mandatory
Another important thing in interpreting a limiting triangle is the price action that follows. After the market breaks the b-d trendline, the price must make a new high (in a bullish pattern) or low (in a bearish pattern).
How to Spot a Terminal Impulsive Wave
Based on everything mentioned so far, the Elliott trader knows that the presence of a limiting triangle tells us that a reversal follows. If the limiting triangle is the b-wave of a zigzag, then a reversal is in the cards after the c-wave ends.
Or, if the limiting triangle is the 4th wave of an impulsive move, a reversal is in the cards after the 5th wave ends. But there is a catch here.
The c-wave of a zigzag and the 5th wave of an impulsive structure can be either a classic or a terminal impulsive wave. Is there a way to find beforehand which one it is? The limiting triangle offers a pretty good solution.
Two things should be considered here. One is that if the price continues to rise or fall beyond the time of the apex, it means that the market is forming a terminal impulsive move for the c-wave of a zigzag or for the 5th wave of the impulsive move.
Simply put, the trader should mark the time zone of the apex with a vertical line. Next, wait for the market to reach the measured move and peak around the time zone of the apex. If it does so but continues to rise or fall, depending on the underlying trend, then the c-wave or the 5th wave must be terminal impulsive structures.
Another is that the price should quickly retrace to the apex level once the thrust of the triangle is reached. If it does so, the c-wave of the zigzag or the 5th wave of the impulsive wave are classic impulsive structures. If not, they are terminal impulsive ones.
A Limiting Triangle Is Not Retested
One key element in interpreting a limiting triangle is the b-d trendline. For almost all triangles, this trendline is being retested by the price action.
In other words, after the market breaks the b-d trendline, it is retesting it. But in the case of a limiting triangle, the retest should not exist. If you see one, it means that the triangle is non-limiting.
A few more words about retesting the b-d trendline. Any triangle must respect the breakout rule regarding the b-d trendline.
As a reminder, the price action must break the b-d trendline in less or the same time it took the e-wave to form. If it does so, the market confirms the pattern. The breakout should be so powerful that the price action does not return to the b-d trendline anymore.
Interpreting the Two Trendlines
The two trendlines, the a-c and b-d, must be "clean." Effectively, it means that they should contain the entire price action during the limiting triangle's formation. Not even one small piercing is allowed, or else the triangle is not a limiting one.
Simply draw the two trendlines. The price action between the points (i.e., between the end of waves a and c and b and d) should not pierce the two trendlines. Moreover, the price action should also not pierce the projection of the two trendlines.
The Apex Provides Strong Support and Resistance
Finally, the interpretation of a limiting triangle ends with the apex. It should offer strong support or resistance, and the market needs at least two trials before it breaks it.
After the break, the principle of interchangeability comes into place. Therefore, support turns into resistance, and resistance turns into support.
These are all the rules of a limiting triangle. If the price action fails to respect even a single one, then the market does not form a limiting triangle.
So please read them all again and have another look at the previous picture presenting a limiting triangle. Next, this article presents some examples in the FX market so the trader has an understanding of how to find and interpret a limiting triangle correctly.
Examples of Limiting Triangles
In the following section of this article, we will look at a limiting triangle formed on the USD/JPY currency pair in 2015. The reader will discover that even a triangle formed such a long time ago has important implications for the price action that follows in the upcoming years.
The Bank of Japan was uneased by the Japanese yen's strength, so it embarked on a quantitative easing program in 2012. At that time, the USD/JPY was trading below 80.
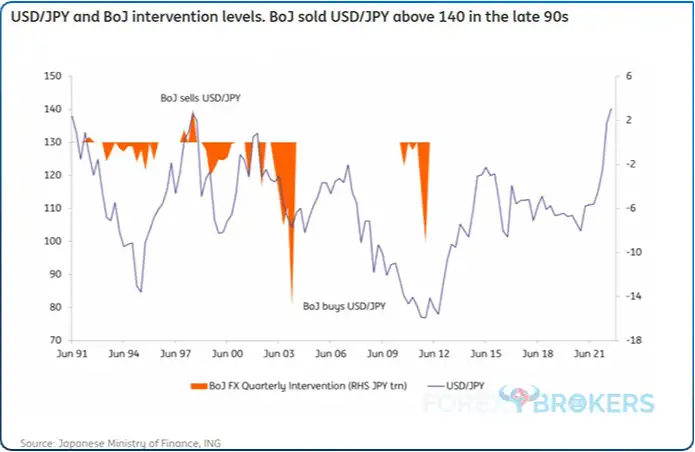
The efforts paid off, and the USD/JPY bounced from the lows. The exchange rate regained the pivotal 100 level, and after consolidating for a while, it traveled all the way above 120.
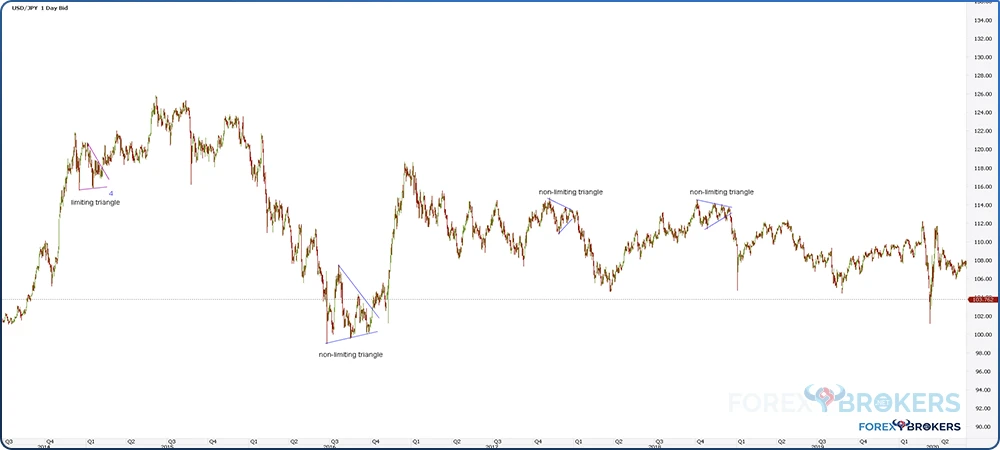
By the time the limiting triangle formed, the market had rallied hard from the lows. Towards the end of the move, the market formed a limiting triangle, shown in blue below.
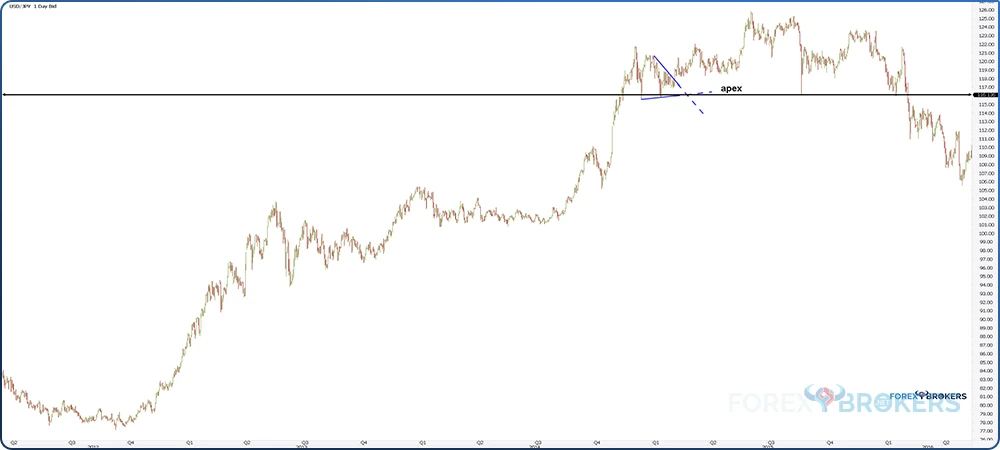
USD/JPY – 2015
The chart above shows the power of such a triangle. It was able to "limit" the rally, as, after its formation, the advance ended.
Here is a closer look at it. Based on the market's rally prior to the triangle's formation, we can safely assume that the limiting triangle was the 4th wave of an impulsive structure. Therefore, after the limiting triangle, the 5th wave must have followed.
The horizontal black line represents the limiting triangle's apex. The level is an important support or resistance area for the price action to follow, and the time zone helps us interpret the triangle.
We said earlier that the triangle is likely the 4th wave of an impulsive move. Therefore, what ended before the limiting triangle was the 3rd wave, and what followed after was the 5th wave.
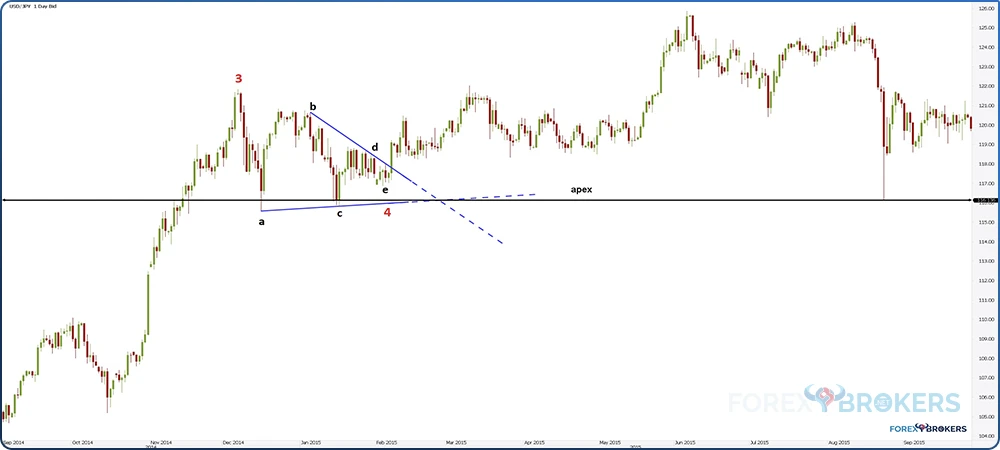
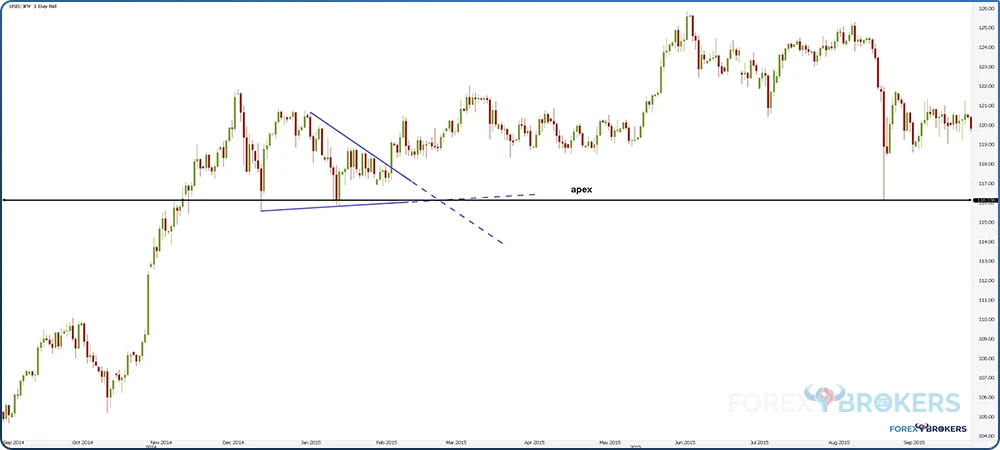
The chart above focuses on the two trendlines – the a-c and b-d ones. Next, go back to the rules of a limiting triangle and see if they are respected.
We can see no parts of the triangle piercing the two trendlines. More precisely, after connecting the end of wave a with the end of wave c, and the end of wave b with the end of wave d, the two trendlines should be "clean". No piercing is allowed – between the points that mark the trendlines and beyond them.
Also, check out the breakout point. The price breaks above the b-d trendline and does not retest it. One of the rules says that the b-d trendline should not be retested, and it is not.
Finally, the time rule regarding the limiting triangle is respected as well. The chart below shows that the triangle ended between 20%-40% of the distance from its start to the time zone of the apex (the area between the two vertical blue lines).
Interpreting the USD/JPY Limiting Triangle
As mentioned earlier, the limiting triangle was part of an impulsive move, acting as the 4th wave. It is now time to focus on what happened after the triangle's end and see how the pattern effectively limits the price action.
To do that, the Elliott trader must return to the rules presented in the first half of this article. One of them states that the thrust, or the measured move, must come around the time zone of the apex (i.e., the vertical blue line on the right side of the chart above).
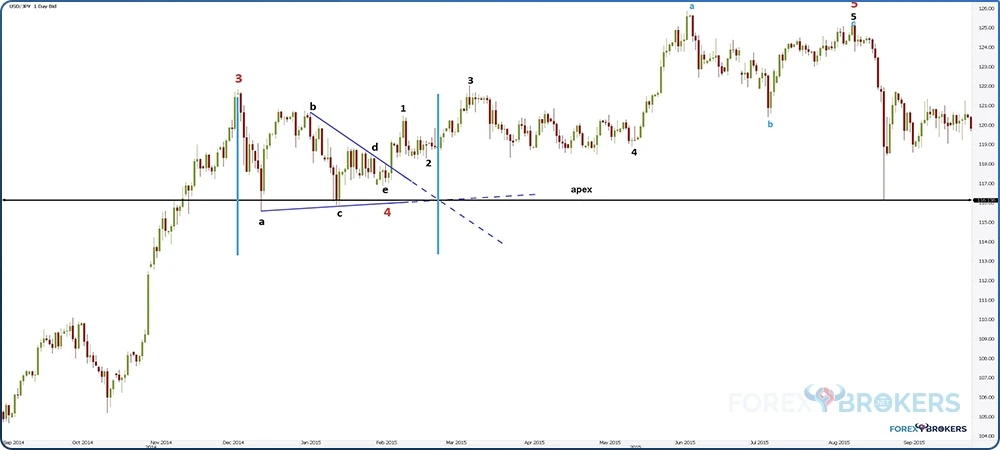
We see the spike higher right after the b-d trendline's breakout, but it was quickly retraced. Hence, the thrust was not reached around the time zone of the apex.
Moreover, another rule states that the market must make a new high. But there is no new high until the price exceeds the time zone of the apex.
Finally, the market keeps advancing well beyond the time zone of the apex. Remember, if the 5th wave was supposed to be a classic impulsive move, then the market should have returned to the apex immediately.
Because it fails to do so and keeps advancing, it means that the 5th wave of the impulsive move is a terminal impulsive structure. Hence, the limiting triangle helps us know the next pattern in advance.
So why is this information important? It matters because a terminal impulsive wave is always retraced in less than half of the time it took the market to form it. Often, it takes less than 25% of the time.
Armed with this information and knowing where the 5th wave started (i.e., at the end of the previous 4th wave or at the end of the limiting triangle), we should expect that the market will quickly retrace to the apex once the terminal impulsive wave ends.
Terminal Impulsive Wave – 5th Wave Extension
Three types of terminal impulsive waves exist. The most common one is a first-wave extension, meaning that the first segment is the longest one.
Next is the fifth wave extension. So, naturally, the fifth wave is the longest one.
Finally, it is the third wave extension, but this pattern rarely occurs.
Remember from previous articles part of this trading academy that all the segments of a terminal impulsive wave are corrective. However, despite this characteristic, they are still labeled with numbers.
The chart above shows that the market formed a fifth-wave extension terminal impulsive move. It had a flat pattern for the last segment, and the market collapsed once the terminal impulsive structure ended.
The price action following a terminal impulsive structure is extremely aggressive. In this case, the USD/JPY exchange rate collapsed, dropping hundreds of pips in a manner of only a few hours.
Where did it find support? Just like the rule of interpreting a limiting triangle says, it bounced from the apex – as it was supposed to.
USD/JPY Bouncing Twice from the Limiting Triangle's Apex
The apex of a limiting triangle should offer strong support or resistance, depending on the main trend's direction. In this case, the limiting triangle acted as a bullish continuation pattern; therefore, the apex should serve first as support and then as resistance once the market breaks below.
Also, the price should bounce at least twice from support. It did, as reflected by the chart below.
For those in the market at that time, the sharp move lower in the USD/JPY exchange rate happened during the summer. More precisely, in August 2015, the famous US stock market crash happened when the Dow Jones and other major US indexes collapsed in minutes.
Because the USD/JPY was directly correlated to the US stock market at that time, the weakness in the US stock market quickly triggered a similar move in the USD/JPY.
But the apex offered strong support. The market bounced twice from the apex, as it was supposed to, and finally broke lower. For those curious enough to see what happened next, feel free to follow the price action in the years that followed, and you'll find out that the apex offered horizontal resistance the first time the market tried to move above it.
Non-limiting Triangles
The final part of this article is dedicated to non-limiting triangles. In sharp contrast to limiting triangles, these triangles appear very often.
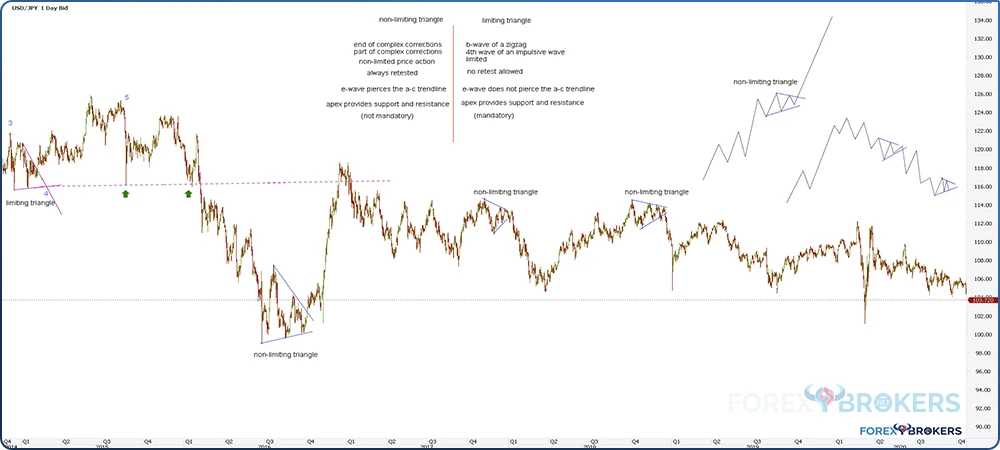
A non-limiting triangle is always part of a complex correction. Despite being so common, here are some things to consider when interpreting such a triangle:
- The apex of a non-limiting triangle plays no important role in the future price action.
- After the b-d trendline's break, a retest is very common, although not mandatory.
- The Elliott Wave trader would be better off interpreting the non-limiting triangle in the context of the complex correction it is part of rather than as a single pattern.
- It is mandatory for the price action inside the triangle to pierce the a-c trendline. Also, the e-wave is typically piercing the a-c trendline, and some parts of the d-wave may also pierce the b-d trendline.
Here is the same USD/JPY chart used earlier for interpreting a limiting triangle. The limiting triangle is shown on the left side of the chart, and on the right side, the reader can see three different non-limiting triangles.
In these cases, the non-limiting triangles acted as patterns at the end of complex corrections. Once the price broke the b-d trendline, the market rallied.
Where Do Non-limiting Triangles Form?
Remember that triangles, and especially contracting ones, are the most common corrective patterns. In fact, no other pattern forms so often, impulsive waves included.
To illustrate it, let us compare the two types of triangles – limiting and non-limiting. We mentioned earlier that limiting triangles form only as the b-wave in a zigzag or the 4th wave in an impulsive structure.
However, a non-limiting triangle may appear as the:
- X-wave of any complex correction
- Last corrective phase of a double combination
- Last corrective phase of a triple combination
- Last corrective phase of a double three-running
- Last corrective phase of a triple three-running
- Last segment of a double three-combination
- Last segment of a triple three-combination
Examples of Non-limiting Triangles
The best way to spot the difference between limiting and non-limiting triangles is to interpret them together.
Focus on the left and right sides of the chart below.
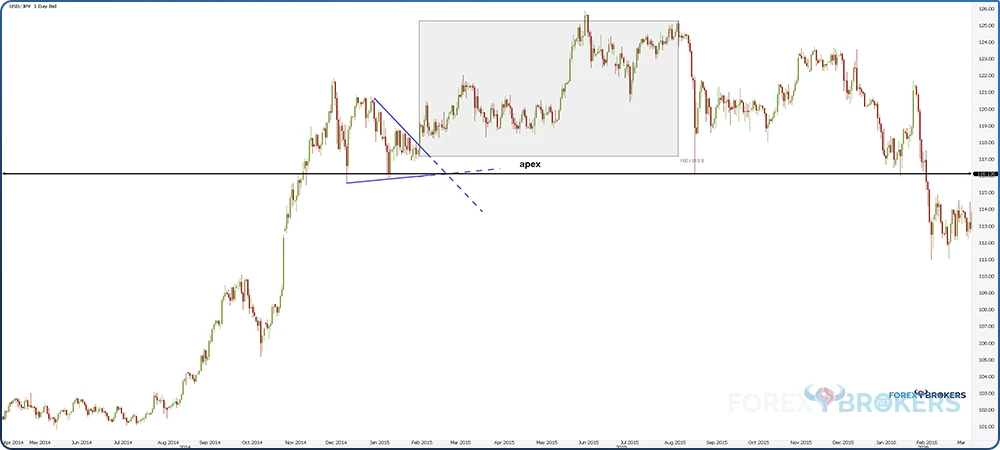
On the left, there is the limiting triangle discussed in this article. On the right, the reader may spot various non-limiting triangles and some places where they may form. As the names suggest, the price action following a limiting triangle is "limited", while the price action following a non-limiting triangle is not limited. In other words, the market may advance or decline without restrictions once a non-limiting triangle ends.
To finish with the examples, let us interpret the price action following a limiting triangle and a non-limiting one. From left to right on the chart below, once the terminal impulsive wave ended, the USD/JPY pair found support at the apex of the limiting triangle.
It bounced twice from the level and then moved below. From that moment on, the apex's area acted as resistance due to the interchangeability principle.
After support was broken, the decline continued in a steady, bearish trend. For most of 2016, the USD/JPY consolidated in a triangular pattern.
The consolidation closely followed the uncertainty in the US stock market. In addition, the US presidential elections loomed large, and the election of President Trump in 2016 triggered a sharp move higher in the stock market and, implicitly, in the USD/JPY.
At the time, the new President's agenda looked promising for the economy, so the stock market rallied after initially tanking. Because of the direct correlation, the USD/JPY exchange rate followed.
But the rally that followed, while aggressive, stalled at the horizontal resistance given by the apex of the previous limiting triangle that formed in 2015. Hence, the limiting triangle strongly impacts the price action that follows even years after the triangle's completion.
Conclusion
Limiting triangles do not appear very often, but they have predictive powers. As shown by the example on the USD/JPY daily chart, the limiting triangle forming in 2015 had predictive power for many years to come.
A limiting triangle pattern must respect many rules. If only one of them is broken, the market forms some other pattern, not a limiting triangle.
Nevertheless, limiting triangles are powerful patterns. Their beauty consists in the fact that while simple patterns, they predict a top or a bottom.
Depending on the timeframe, this may be an important clue to consider, one that may lead to profitable trades. The example in this article used a triangle forming on the daily chart, but how about a limiting triangle forming on even larger timeframes?
In sharp contrast to limiting triangles, non-limiting ones are everywhere. Corrective patterns are more common in the Elliott Waves Theory, and non-limiting triangles are part of many of them. A limiting triangle can't be part of a complex correction. Also, a complex correction can't start with a non-limiting triangle.
The most common place for a non-limiting triangle is to form at the end of complex corrections, such as at the end of double or triple combinations. As for limiting triangles, they form only in two places – either as the b-wave of a zigzag or as the 4th wave of an impulsive structure. In both cases, the limiting triangle is a simple, independent correction.
The concept of limiting and non-limiting triangles is complex. However, there is still some more to be revealed about the Elliott Waves Theory in other upcoming articles part of this trading academy.
Related Lessons


See more from this category