
302
Technical analysis refers to interpreting historical data to forecast future market movements. Unfortunately, to many, technical analysis is nothing short of pure fantasy, as there are plenty of examples showing it does not work.
However, other examples point to its usefulness in interpreting and trading markets. For this reason, technical analysis became part of investment subjects and any serious investment coursework.
The area is incredibly vast. For example, we can talk about technical patterns, such as triangles and wedges. Also, we can speak of trading theories, such as the Elliott waves theory or Drummond geometry. Moreover, Japanese candlestick techniques are also part of technical analysis, just like many other technical concepts. In short, whenever a trader looks at past price data and draws a conclusion from it, they are engaged in technical analysis.
Regardless of whether technical, fundamental, or of a different nature, the outcome of an analysis is a trade. Any trade must have an entry and an exit. The entry is the price at which the security was bought or sold, and the exit is either the stop-loss or the take-profit level.
All these are known variables, part of any sound money management plan. What is unknown is the time element, and this introduces us to this article's topic.
Time is a critical component in the investing and trading world. How long does it take to reach the desired target level for the market? It could be 1 minute, 1 hour, 1 day, several days, weeks, months, or years—time is the big unknown.
However, some technical patterns allow us to make an educated guess about the time element. In other words, it brings the trader closer to estimating when the price should reach a certain level.
What Is the Time Element?
The time element refers to how long an asset's price takes to reach the target level if everything goes as planned. It also acts as an invalidation level, just like a stop-loss order.
Let's start with the first one. As mentioned earlier, every trade has three elements—the entry level, the stop-loss, and the take-profit. But what if we could add another element, such as time?
Obviously, the more elements or clues we have of a trade, the better the planning and the sounder the money management. Therefore, if a trader could add time to a trade, the chances of obtaining a positive return from that trade increase exponentially.
Time may also act as an invalidation level. Imagine a pattern with a measured move used to set the take-profit level after the breakout. Sometimes, the measured move is accompanied by some time "constraint."
For example, the price must reach the measured move in less or the same time it took the pattern to form. But what if time passes and the market is not even close to the measured move? Or if time passes and the price does not reach the measured move but is nearby? In this case, the passing of time acts as an invalidation of the pattern.
Because the measured move was not reached, the pattern was not what the trader thought it was. Keep in mind that the measured move is the minimum distance the market must travel to confirm the pattern.
Therefore, the time element acts as the fourth element in a trade and as an invalidation tool. In the latter case, it acts just like the stop-loss order. The original setup is invalidated if the market reverses and the price hits the stop-loss order.
The same happens with the time element — if time passes and the price does not reach the measured move, the original pattern is invalidated. The difference between the two is that the time element may invalidate the pattern, but the trader can still turn a profit, whereas, in the first example, a profit is impossible.
Is Time More Important than Price?
This is a tough question to answer, and the truth is that one without the other makes successful trading difficult. Imagine the following.
Say you are an FX trader and are bullish on the EUR/USD pair. According to your analysis, the market should drop over 1,000 points from the current exchange rate of 1.14150 to 1.0450.
A thousand pips is a long trip in the FX market. It is the equivalent of 10 big figures (i.e., 1 big figure is the equivalent of 100 pips).
Such a forecast is incomplete if not accompanied by the time element. When should the EUR/USD reach the target? Because if it does so in a decade from now, only a few traders, if any, would be interested in the trade.
Moreover, most trades charge a negative swap for holding positions open overnight. Therefore, any long-term holding should consider all additional charges.
Meanwhile, if you forecast that the EUR/USD should reach the target in about 10 months, that is an interesting statement. Swing traders and investors may want to sell all the spikes generated by bear market rallies, for example. Or it becomes much easier to count the waves using Elliott's principles if the time element is known in advance.
Therefore, we may say that time is often more important than the price itself. However, only when interpreted together will the two generate positive returns.
Price and time—know where the price goes and when. To many, this is as close as it gets to the holy grail in trading financial markets.
Two big areas in technical analysis are responsible for most of the setups that allow traders to use the time element: classic technical analysis patterns and the Elliott Waves Theory.
The Time Element in Classic Technical Analysis Patterns
Classic technical analysis is the first form of technical analysis. It dates back to stock market trading at the start of the 1900s when traders spotted patterns that the prices made on the stock market.
The patterns were documented in time, and new traders added new concepts and different ways to trade them. These patterns belong to classic technical analysis; all traders have heard of them at least once during their careers.
Here, we can include patterns such as ascending or descending triangles, flags, pennants, double tops, double bottoms, and so on. However, not all classic technical analysis patterns can be traded using the time element. Some of them have no time constraints, but some do, and they are the subject of this section.
These are the 4 classic technical analysis patterns that allow the incorporation of the time element when trading:
- Pennants
- Wedges
- Flags
- Head and shoulders
In all these cases, the time element acts as an invalidation measure. In the first 3 cases, it invalidates the entire pattern if the price target is not reached in time. Finally, in the last case, the time element reiterates the pattern, giving the trader extra confidence that the pattern is correct.
Pennants
Pennants are continuation patterns formed mostly during bullish trends. A pennant represents a tight consolidation or a market breather before the main trend resumes.
The major difference between a pennant and a flag is the tight consolidation. Another interesting characteristic of the pennant is that the consolidation is always a contracting triangle. Compared with most contracting triangles, the only difference is that this one takes only a short time to form. Therefore, one may say that the first use of the time element when interpreting a possible pennant formation is to look at the time it took the market to consolidate. It should be quite short.
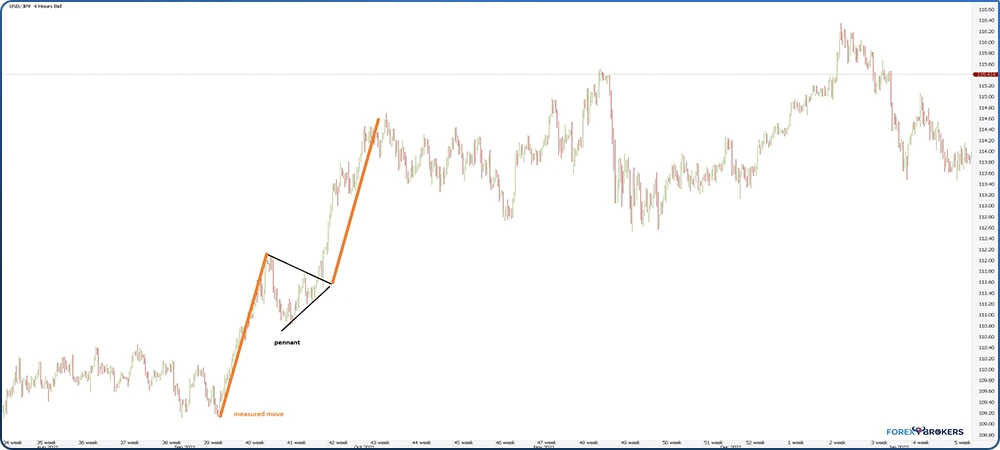
The USD/JPY is one of the currency pairs that traveled the most during the COVID-19 pandemic. In 2021, the pair marched higher in a strong, bullish trend.
The chart above shows a classic pennant pattern, defined by the steep rise and a short-term, triangular consolidation. This is still a large time frame, so traders had plenty of time to observe the pennant.
How to trade the pattern? The classic technical analysis interpretation follows a 2-step approach. First, the trader needs to measure the distance from the previous consolidation until the pennant's formation. In other words, the steep moves higher—almost vertically.
Second, the trader should wait for the breakout, that is, for the moment when the market breaks above the triangular consolidation.
The distance from the start of the pattern until the triangular consolidation is called the measured move, and by projecting it to the upside, we find the target.
Adding the Time Element to a Pennant's Interpretation
But only the measured move doesn't tell us much. What if the price advances 100 pips and then another consolidation starts?
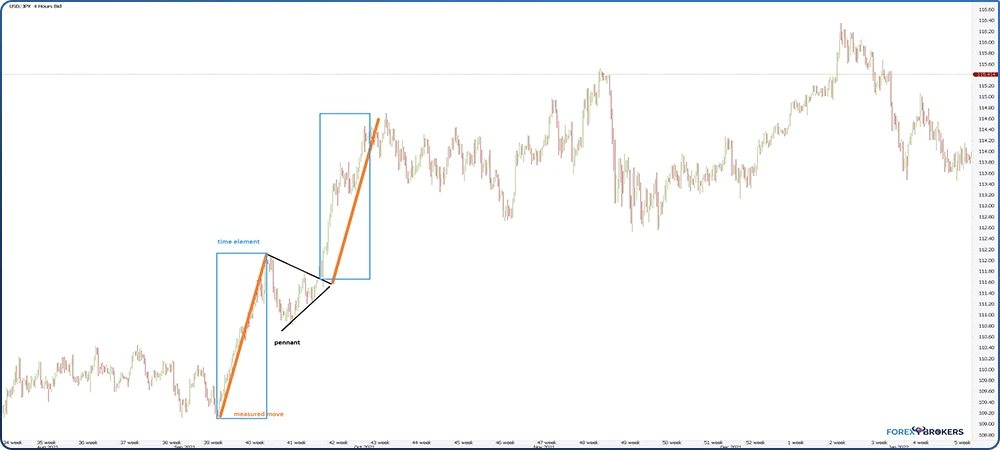
We must use the time element to make sure we interpret the pattern correctly. The key is to use a shape and measure the time it took the market to travel from the previous consolidation until the pennant's formation or count the candlesticks.
Next, copy the shape or the time element and project it on the right side of the chart, starting with the breakout moment — more precisely, from the moment the market broke above the triangle's upper trendline.
Now, not only do we have a price target for the trade (i.e., the measured move in orange), but we also have a time constraint for it (i.e., the blue rectangle).
The rule of thumb when using both is that the market must reach the measured move in less or the same time it took the market to travel from the previous consolidation until the pennant.
As you may notice on the chart below, the market broke higher and then consolidated by about half the measured move's distance for a while before resuming to the upside. Assuming the consolidation continued and time expired, the trader should exit the market. This way, a profit would still be booked, whereas the trader who did not use the time element would stay for the measured move and risk a reversal.
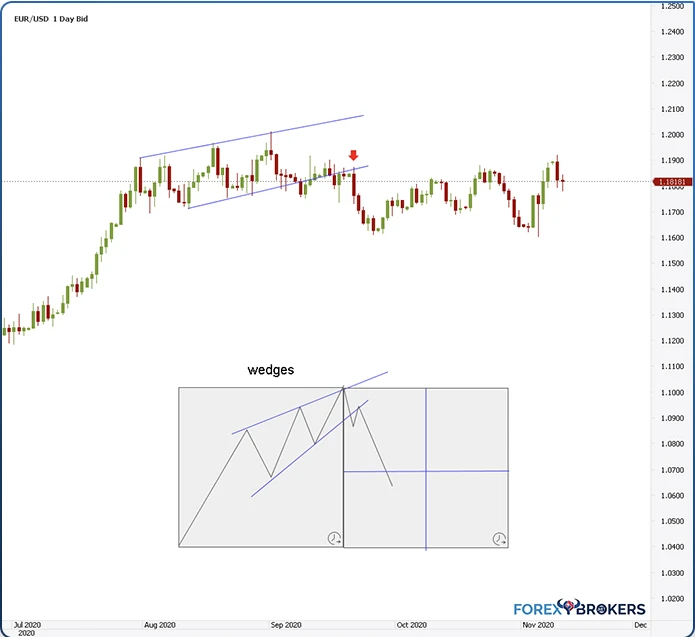
Wedges
A wedge is a reversal pattern. It forms at the end of bullish and bearish trends, unlike the pennant. Conventional wisdom says that rising wedges are "falling," and falling wedges are "rising," suggesting the bearish, respectively bullish outcome expected after a wedge's formation.
However, it is not every time that a wedge reverses a trend. Most of the time, it does so, but sometimes the market just corrects for a while before making a new higher high or lower low in a bullish, respectively bearish trend.
A rising wedge occurs when the market makes a series of higher highs in a bullish trend but only marginal ones. In a falling wedge, the opposite happens—the market makes a series of lower lows in a bearish trend, but only marginal ones.
The wedge pattern is given by the 2 trendlines connecting the higher highs and higher lows (in a rising wedge) and the lower lows and highs (in a falling wedge). The key is to wait for the market to break below the lower trendline (in a rising wedge) or the upper trendline (in a falling wedge) before entering on the short, respectively, on the long side.
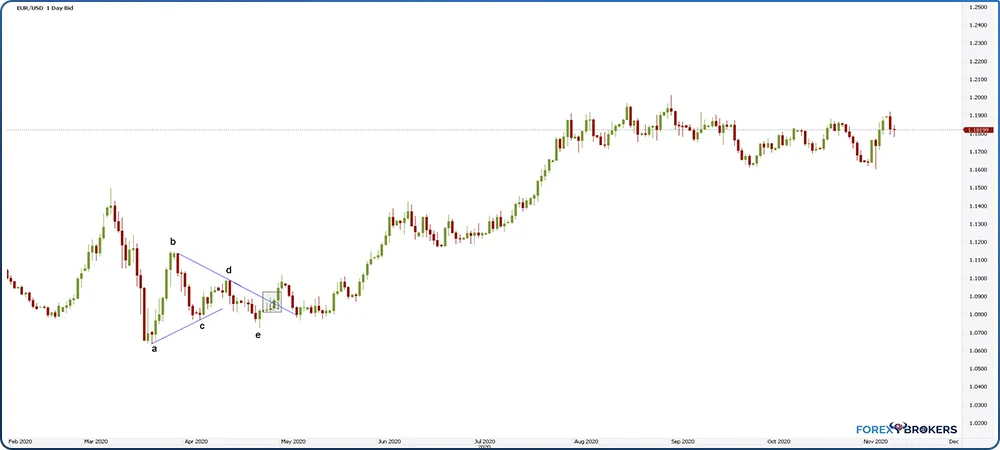
Below is the EUR/USD chart showing the price action in 2020. The pair jumped from 1.07 on the news that the Federal Reserve of the United States has opened USD swap lines with other major central banks in the world to provide much-needed liquidity to the financial system. This was a negative development for the U.S. dollar, so the EUR/USD moved higher.
A rising wedge formed—a reversal pattern. Moreover, the price broke below the lower trendline, offering an incentive to go short.
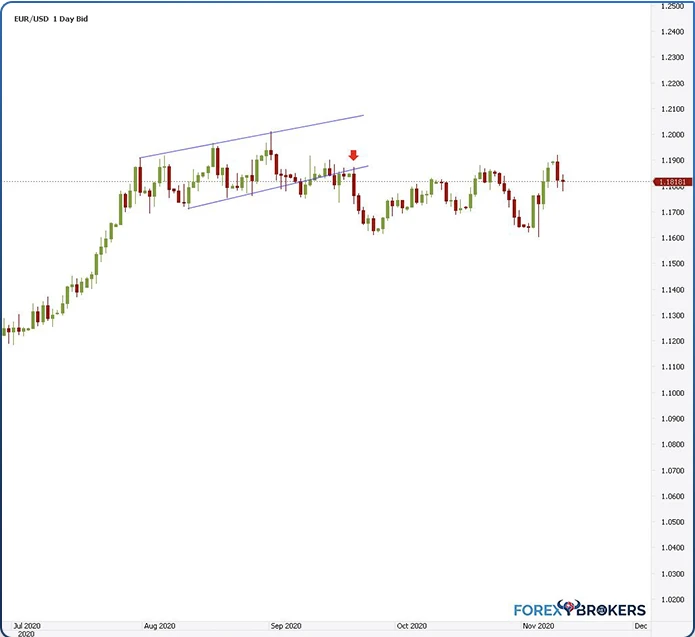
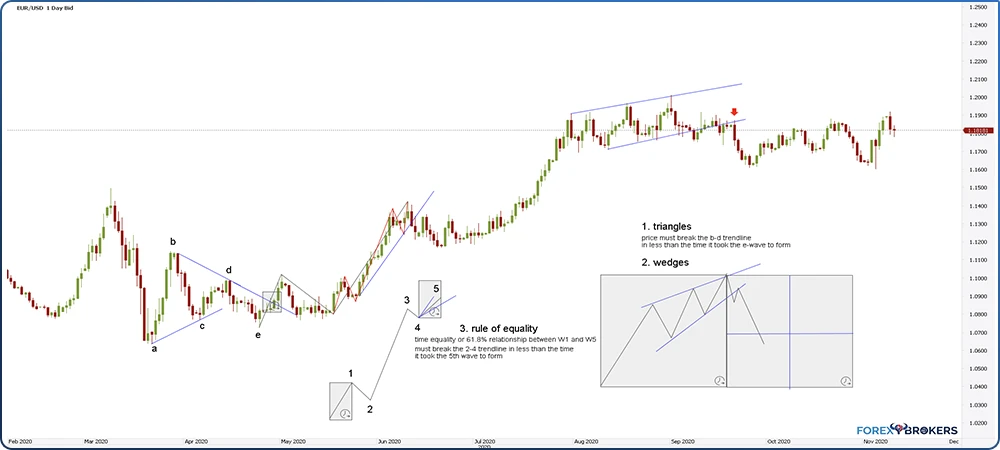
However, while the market did fall below the lower trendline, the rising wedge did not act as a reversal pattern. In fact, the EUR/USD rotated back higher, and by the end of 2020, it was traded above 1.23.
Was there a way to tell that the wedge would not act as a reversal pattern? Yes — the time element.
Adding the Time Element to a Wedge's Interpretation
To ensure we interpret the wedge correctly, we need to add the time variable to the analysis. The rule of thumb when trading a wedge pattern is to set the take-profit level using both the price and time as part of the analysis.
First, make sure to find out the 50% retracement level of the entire wedge. In other words, use a Fibonacci retracement tool to drag it from the previous consolidation to the top of the rising wedge. That's the distance traveled during the wedge's formation. By finding the 50% retracement, we have the take-profit or the target for the short trade triggered when the price breaks below the lower trendline.
Besides price, we should also use time. The rule is that the market must reach 50% of the wedge's distance in 50% of the time it took the wedge to form. If not, the wedge is not a reversal pattern, and the risk is that the market will reverse and make a new higher high.
The EURUSD did just that—the time expired, and then the market reversed to end the year above 1.23. Hence, the rising wedge did not act as a reversal pattern, and the time element was useful in averting a bad trade.
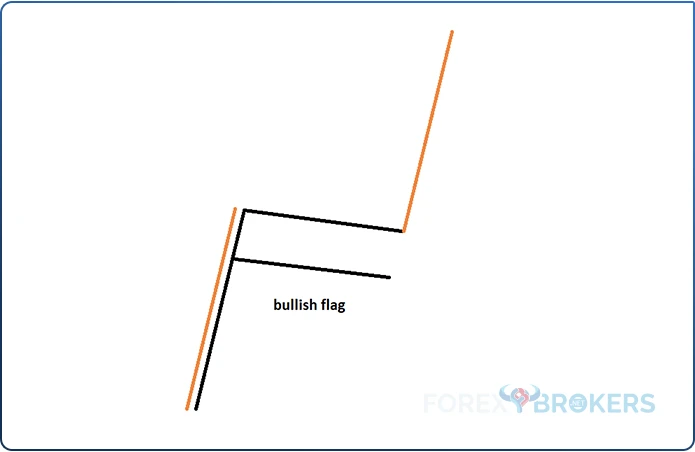
Flags
Flags are continuation patterns similar to pennants and appear both during bullish and bearish trends. The market advances or declines with a violent, almost vertical move and then begins to consolidate.
Unlike pennants, flags consolidate more. While one of the main characteristics of a pennant is that the consolidation takes only a short time, in the case of flags, it takes much longer. Another difference is the shape of the consolidation. In the case of a pennant, the consolidation takes the shape of a contracting triangle, but in the case of a flag, the consolidation takes the shape of a horizontal or corrective channel.
Yet another difference comes from the nature of the consolidation. A pennant's consolidation always happens on the horizontal. It is not the same in the case of a flag. During a flag's consolidation, it is most common that the consolidation will go against the main trend, even if only slightly.
A flag's measured move is the distance traveled from the previous consolidation until the flag's formation, projected from the upper trendline. Remember that the flag should be a continuation pattern and that the consolidation is just the market consolidating before the trend resumes. It may be that an important economic news or market event is underway, and the market is simply awaiting the outcome.
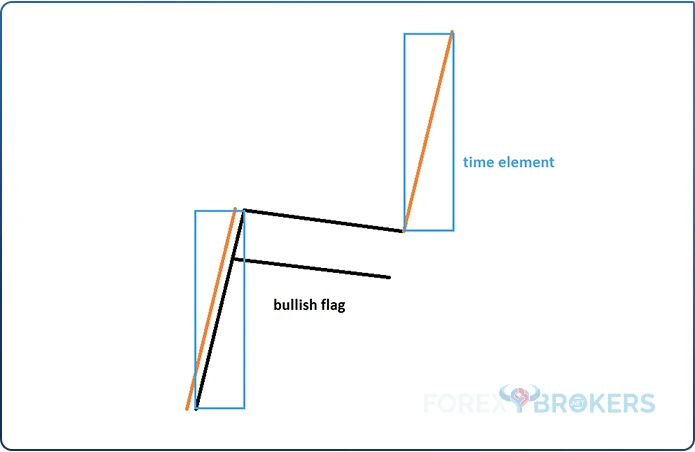
Adding the Time Element to a Flag's Interpretation
What's missing from the above picture? The correct answer is the time element.
While we do know the measured move, wouldn't it be nice to have an educated guess regarding when we should expect the market to reach it? We can find out by using a similar method as when trading pennants.
First, use a shape and mark the time it took the market to travel from the previous consolidation to the flag. Next, project the time element from the flag's upper trendline. That is the time constraint for the price to reach the measured move. Should it do so in the required time, the flag is validated. Should it not, the flag is invalidated as a continuation pattern, and the trader should exit the trade.
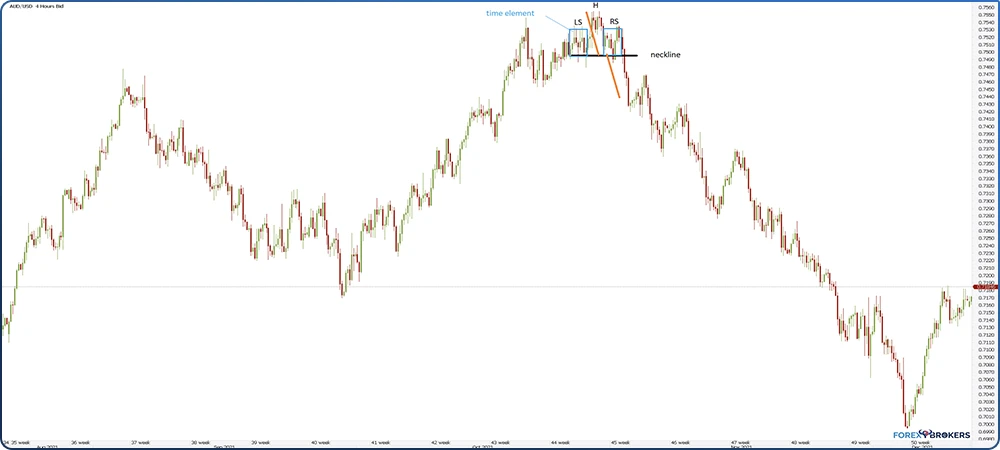
Head and Shoulders
The head-and-shoulders pattern is one of the most popular reversal patterns in classic technical analysis. It forms very often, both at the end of bullish, respectively bearish trends. The pattern is called an inverse head and shoulders when reversing a bearish trend.
It has multiple elements, and its interpretation is straightforward. The pattern has a head, 2 shoulders, a neckline, and a measured move. When the market moves beyond the neckline, the measured move represents the minimum distance the price should travel.
The head and shoulders pattern was already discussed extensively in a different section of this trading academy. We now want to add the time element when interpreting the pattern.
When analyzing the pattern from a time perspective, the key is to look at the time it took the 2 shoulders to form. In technical analysis, it is often said that what is on the left side of a chart is free information.
Indeed, it is.
The first element in the head-and-shoulders pattern is the left shoulder. Naturally, the pattern becomes obvious only after the market completes the head, but it is not too late to measure the time it took the left shoulder to form and project it from where the right shoulder begins.
The rule of thumb is that the more the 2 shoulders resemble in terms of time, the more powerful the reversal pattern. To illustrate, the AUDUSD chart below shows how the time element reinforces the reversal pattern. Moreover, it shows that the move following a head-and-shoulders pattern, having the 2 shoulders equal in time, is extremely powerful.
The Time Element in Elliott Wave Patterns
Besides the classic technical analysis patterns, the time element plays an even more important role in the Elliott Waves Theory. The theory involves counting impulsive and corrective waves based on various rules meant to interpret cycles of different degrees.
According to Ralph Elliott, traders should use numbers to label impulsive waves and letters to label corrective waves. The theory has tons of mutually exclusive rules and uses trendlines and Fibonacci ratios to find out the entry and exit of a trade. It is, if you want, trading by following a logical process.
Fibonacci ratios play a critical role in the Elliott Waves Theory. For instance, Fibonacci levels are the pillar for distinguishing between zigzags and flats, but that is only one of many examples.
Besides Fibonacci ratios, the time element is also used to confirm various Elliott patterns. The theory is full of patterns, such as impulsive waves (classic or terminal) or corrective ones (simple or complex).
Moreover, throughout the theory, the time element plays a critical role. If you want, together with the Fibonacci ratios, the time element is the one that connects and confirms various Elliott patterns.
Here are some ways the time element is used when counting waves with the Elliott waves theory:
- Determining simple corrections
- Trading terminal impulsive waves
- Interpreting a triangle's b-d trendline
- Interpreting limiting triangles
- Trading zigzags
- Interpreting the rule of equality in impulsive waves
- Finding the end of the fifth wave
Determining Simple Corrections Other Than Triangles
Elliott identified 2 major categories of corrective waves — simple and complex. A simple correction is either a flat, a zigzag, or a triangle. Complex corrections are made of combinations of similar or different simple corrections connected by 1 or 2 intervening waves.
But how to differentiate between the two? Is there a way of knowing when a correction is simple or when it is part of a bigger, complex correction?
The answer comes from — you guessed it — the time element.
If we exclude triangles from the simple-corrections category, only flats and zigzags remain. So why should we exclude triangles?
Because complex corrections may start only with a flat or a zigzag, it makes no sense to consider triangles.
Here is the rule of using the time element to determine if a correction is simple or part of a complex one.
First, measure the time it took the c-wave to form — the c-wave of either the flat or the zigzag. Second, project the time on the right side of the chart from the moment the c-wave ended. Third, draw a trendline from the beginning of the corrective wave and connect the end of the b-wave.
After these 3 steps, wait and see what the market does. If the move following the c-wave reaches the 0-b trendline in less time than it took the c-wave to form, it means that the flat or zigzag was a simple correction. Furthermore, it needs to fully retrace the c-wave, too.
Terminal Impulsive Waves
A terminal impulsive wave is a special type of impulsive structure. While it is labeled with numbers, all of its waves are corrective.
Three types of terminal impulsive waves exist based on which wave extends. The most popular terminal impulsive wave is the one with the first wave extension, followed by the one with the fifth wave extension and ending with the one with the third wave extension.
The time element plays a key role in 1 of the 3 terminal impulsive waves. So, naturally, it is the first wave extension terminal impulsive wave.
Keep in mind that in a terminal impulsive wave, all segments are corrective. However, the market does advance or decline, meaning that the first and the third waves are either flats with a long c-wave or zigzags.
The time element is used when interpreting the fourth wave. By then, the first 3 segments are already known.
The rule says that the fourth wave should either be equal to the second one in time or take about 61.8%. Hence, the thing to do is to measure the time it took the second wave to form and project 100% and 61.8% of it from the end of the third wave. This way, traders know when the fourth wave might end and can prepare for trading the fifth wave.
A Triangle's B-D Trendline
Time plays a role when interpreting triangles, too. Triangles are corrective patterns with 5 segments, all of them corrective.
In this case, the time element helps identify the end of the triangle. Put differently, it confirms the triangular pattern.
Here, the rule is very simple — the market must break the b-d trendline in less or the same time it took the e-wave to form. Therefore, the trader should measure the time it took the e-wave to form and project it from the end of the e-wave. If the b-d trendline's break comes in less or the same time, the triangle is confirmed. If not, it means that the triangle did not end.
Limiting Triangles
Another use of the time element is in limiting triangles. Such triangles are special because they appear only as the b-wave of a zigzag or the 4th wave of a classic impulsive wave.
Also, they must respect numerous rules. If only one of them is broken, the pattern is not a limiting triangle. One of these rules states that a limiting triangle must end before 20%–40% of the time of its apex.
Hence, we need to find out the apex first and mark the time second. The way to do so is to project the a-c and the b-d trendlines and find their intersection point. This is the apex.
Next, use a vertical line and mark its time. Finally, use the Fibonacci Time Zone tool and edit it in such a way that it displays the 20% and 40% areas. The e-wave, and thus the triangle, must end before the maximum 20% time distance from the apex.
Zigzags
A zigzag is another corrective wave. It has only 3 segments, labeled a-b-c. However, 2 of these segments are impulsive—waves a and c.
For this reason, a zigzag is often misinterpreted as an impulsive structure.
One characteristic of a zigzag is that the b-wave should not retrace more than 61.8% of wave a. But that is not the most important one.
Instead, the time element is defined for a zigzag. More precisely, the 2 impulsive waves, waves a and c, must take about the same time.
Hence, the trader knows in advance when to expect the end of the zigzag by projecting the time it took wave a to form from the end of wave b. If the time rule is not respected, the zigzag pattern should be discarded.
Rule of Equality in Impulsive Waves
One of the less-known rules when interpreting impulsive waves is the rule of equality. It comprises both price and time, as they are important when interpreting an impulsive wave.
The rule of equality refers to 2 nonextended waves. In a classic impulsive wave, there are 3 so-called motive waves (1, 3, and 5) and 2 corrective ones (2 and 4). Depending on which of the motive waves extends, the other 2 must respect the rule of equality.
Let's use the third wave extension to illustrate the rule. You can see one example below.
The third wave extension impulsive move is the most common one. For the market move to be impulsive, traders must check to see if the rule of equality is respected. Both price and time are important here.
The rule states that the 2 nonextended waves must be similar in time or relate to 61.8% for the time element. In other words, we have 3 possibilities to interpret the fifth wave.
One is that the fifth wave takes about the same time to form as the first wave. Another is that it will take only 61.8% of it, and the final one is that it will take 161.8% of it.
Finding the End of the Fifth Wave
Yet another use of the time element is to find the end of the fifth wave in a classic impulsive wave. Here's how.
Two trendlines play a role when interpreting a classic impulsive wave—the 0-2 and the 2-4. No parts of the first wave should break the 0-2 trendline. Moreover, no parts of the third wave should break the 2-4 trendline.
But the 2-4 trendline also plays a role in identifying the end of the fifth wave and the end of the entire impulsive wave. The thing to do is to measure the time it took the fifth wave to form and project from its ending point.
The rule says that the market must break the 2-4 trendline in less or the same time it took the fifth wave to form. If it does so, the fifth wave is a classic impulsive wave. If it fails to do so, the fifth wave is a terminal impulsive wave, and thus, it should be treated accordingly.
Conclusion
Time has extensive use in technical analysis. This article showed how it might discard a pattern if the time rule is not respected. For instance, it is even more relevant than the price in many parts of the Elliott waves theory.
Price and time are essential in interpreting financial markets. However, traders tend to focus more on the price element when setting their entry and exit levels, which, in a way, is normal.
But the time element tells much more than the price does. Sure enough, identifying the correct market direction is important, but knowing when the market moves is also relevant.
To sum up, only when used together do price and time offer invaluable information to technical traders. Because of that, any analysis omitting the time element is incomplete.
Related Lessons


See more from this category