The Elliott Waves Theory uses a set of rules to interpret market cycles of various degrees. Ralph Elliott developed the theory by studying the stock market in the 1930s, and since then, the Elliott Waves theory has fascinated traders worldwide.
Computers have made it easier to interpret market waves. Because the theory starts from the bigger cycles to the smaller ones, today’s trading platforms made it easier to build a so-called top-down analysis by starting from the monthly chart and moving with the analysis to the smaller timeframes. This way, the different timeframes are part of the same Elliott Waves analysis.
Also, computers made it easier to fully grasp the patterns Ralph Elliott documented. Double or triple combinations, double or triple three running, double or triple zigzags, and so on, are difficult to identify.
The Elliott Waves theory may appear simple at first look, but that is misleading. Instead, this is one of the most complex trading theories ever developed and one of the few that incorporates the time element, besides the price, in the analysis.
This article presents the waterfall concept with the Elliott Waves theory. It is a wonderful concept that combines the power of the Fibonacci ratios when interpreting complex corrections with a small x-wave, and it is used to spot a top or a bottom by Elliott traders.
After explaining the theory behind the waterfall concept in the first part of this article, we will use some examples that will help the reader understand the Elliott Waves theory and the purpose of the waterfall concept.
What Is the Waterfall Concept – Theoretical Background
Fibonacci ratios are used extensively in the Elliott Waves Theory. Every pattern documented by Elliott is based on Fibonacci ratios.
Here are some examples:
- The b-wave of a flat pattern must retrace more than 61.8% of the previous a-wave
- In a zigzag, the b-wave’s retracement is around 23.6% or 38.2% of the previous a-wave
- The 5th wave in an impulsive move is usually 61.8% of the 1st wave
Therefore, Fibonacci ratios are everywhere in the Elliott Waves Theory. As such, it should come as no surprise that they are the cornerstone of the waterfall concept.
The waterfall concept is seen in complex corrections with a small x-wave, more precisely, in double and triple zigzags and double and triple combination.
All these patterns start with either a flat or a zigzag. To use the waterfall concept, the trader must focus on one particular moment – the moment when the market breaks below (in a bearish trend) or above (in a bullish trend) the lowest/highest point of the first correction. In fact, all the derived Fibonacci ratios are based on the first correction.
Considering the four corrections with a small x-wave, the waterfall concept can be found mostly on complex corrections that start with a zigzag. More exactly, in double and triple zigzags and double the triple combinations that start with a zigzag.
As mentioned earlier, the key is for the market to move beyond the end of the first correction. At that point, the Elliott analyst should measure the first a-b-c and take 61.8% of it. Next, the outcome should be projected from the end of the c-wave to find the next level of support or resistance.
Finally, the trader should measure 38.2% of the first a-b-c and project it from the support or resistance level found earlier to find the next place where the market might hesitate.
An Illustration of the Waterfall Concept with the Elliott Waves Theory
The image below shows a contracting triangle. According to Elliott, all segments of a triangle are corrective.
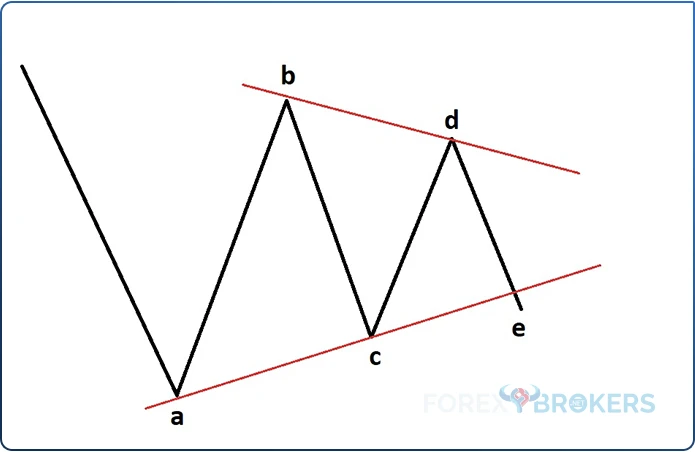
Therefore, one should expect to find only simple or complex corrections as either of the waves a, b, c, d, or e of a triangle. One important aspect here – if the market forms a double or triple zigzag, or a triple combination, as the entire leg of a contracting triangle, then it cannot be fully retraced by a wave of the same degree.
Let us assume that the a-wave of the triangle from above is a double zigzag. In this case, the double zigzag should follow the waterfall concept and look like the one below.
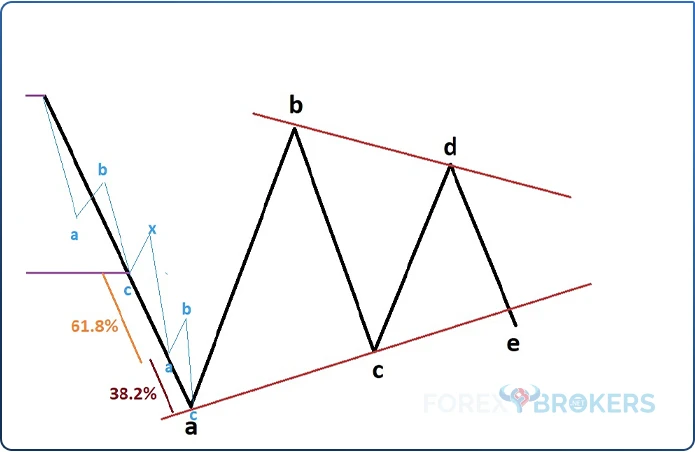
Focus on the blue pattern – it is a double zigzag that respects the waterfall concept. First, measure the first a-b-c with a Fibonacci retracement tool and take 61.8% of it.
Second, project the outcome from the end of the first correction. The resulting level should be the next support level, where the second a-wave of the double zigzag should end.
Third, measure 38.2% of the first correction and project it from the previous support or the end of the second a-wave. The resulting level is the end of the double zigzag pattern.
Whenever a pattern respects the waterfall concept or the external Fibonacci relationships it brings, it confirms that the analysis is correct. For the market to respect such a relationship between different Fibonacci levels and, at the same time, to respect the internal relationships of a pattern, it means that there is little or no room for error in the Elliott Waves interpretation.
Double Zigzag
It should come in handy at this moment to review the conditions of a double zigzag pattern. This is important because the double zigzag pattern must respect a lot of rules independent of the waterfall concept.
Does it mean that if the waterfall concept is not present, the double zigzag is invalidated? Absolutely not.
But if a waterfall structure is present during the formation of a double zigzag, it reinforces the pattern.
A double zigzag is a complex correction with a small intervening wave – the x-wave. The x-wave must not retrace more than 61.8% of the first a-b-c.
The first a-b-c is a zigzag on its own. As such, waves a and c are impulsive, while wave b is corrective. Also, waves a and c tend to take a similar time to form. The same rules apply to the second a-b-c, and the entire pattern should be labeled as a-b-c-x-a-b-c.
Refer back to the triangle above. If the a-wave respects the rules of a double zigzag and the pattern also has a waterfall structure, then the Elliott trader is confident of the pattern.
Therefore, one can move forward with the implications. If the a-wave is a double zigzag, it means that the b-wave of the same degree can’t fully retrace it. Hence, on any retracement beyond 50%-61.8%, the trader should start shorting the market.
The Waterfall Concept – Triple Combination
Perhaps the most common place for the waterfall concept is a triple combination. The separate parts of the triple combination should respect the Fibonacci ratios that make the waterfall concept.
What Is a Triple Combination
A triple combination is a complex correction with two small x-waves. The two small x-waves, also called intervening or connecting waves, connect the three corrections that make the triple combination.
Also, the x-waves, both of them, must be corrective – simple or complex.
Whenever thinking of a triple combination, start with the three simple corrections discovered by Elliott – flats, zigzags, and triangles. Combining them and using two x-waves as intervening segments give you a triple combination.
However, some constraints do exist.
Constraints of a Triple Combination
The rule says that a triple combination cannot start with a triangle. Hence, only two options remain – it may start only with a flat or a zigzag. Out of the two remaining options, the first one, the flat, is more likely to be found as the first corrective wave in a triple combination.
After the first correction, an intervening wave must form. Typically, this is a horizontal correction, slightly trending against the first correction’s trend.
For the intervening wave, the Elliott analyst should consider that the x-wave must not retrace more than 61.8% of the entire distance traveled by the first correction. Therefore, measure the distance from the start until the end of the first correction and use a Fibonacci retracement tool to find out the 61.8% retracement level – the x-wave must end below (if the triple combination is bearish) or above (if the triple combination is bullish) that level.
As mentioned earlier, the x-wave must be corrective as well – simple or complex. You may find a triangle as the first x-wave in a triple combination, for a double flat pattern, or something along these lines. As long as it is corrective, the x-wave is valid. The tendency, however, is that the x-wave will be a simple correction – a triangle, flat, or a zigzag, in this order.
The second correction may be anything but a triangle. This is yet another constraint for how these complex corrections are built.
For the second correction, the bias is that the market will form a pattern different from the first. Therefore, if the first simple correction was a zigzag, the second one will likely be a flat. Or, if the first simple correction was a flat, the second one will likely be a zigzag.
The Second X-wave in a Triple Combination
The second intervening wave may be any simple correction – a flat, a zigzag, or a triangle. However, it is rarely a triangle, so expect a zigzag or a flat pattern.
Also, the second x-wave is unlikely to be a complex correction.
The Third Correction In a Triple Combination
If there is one thing to remember about triple combinations, it is that they almost always then end with a triangle. Therefore, if the Elliott trader should not look for a triangle as the first or the second correction part of the triple combination, the trader should look for one as the last part.
Chances are that this would be a contracting triangle. Out of all contracting triangles that exist, the odds favor a horizontal contracting triangle, although other variations may easily form too.
Where to Expect a Triple Combination
Triple combinations do not form anywhere. Because of their “scarcity”, triple combinations help the trader to evaluate the overall Elliott Wave count.
One place to expect a triple combination is in a contracting triangle. It usually is the entire segment of the contracting triangle.
Also, an important aspect here – it will be the longest segment of the triangle. Therefore, wave A is the longest in a horizontal contracting triangle and the waves to follow are smaller. Hence, the triple combination can only appear as wave A in the horizontal contracting triangle.
Moreover, in an irregular triangle, the wave B is the longest. Hence, a triple combination can only be used as the wave B of an irregular triangle.
Triple combinations also appear as part of a terminal impulsive wave. We have covered terminal impulsive patterns in various articles part of this academy. They are impulsive waves or five-wave structures, but all waves are corrective. A triple combination can be any part of a terminal impulsive move, with the odds favoring waves 1, 3, or 5.
Why Is Important to Recognize a Triple Combination Even after the Fact?
A triple combination tells the trader what the market might form next. For example, imagine that the market rallied for quite a while and then suddenly made a correction on the bigger timeframes.
If that correction is a triple combination, then the implications are that the market will form a triangle. Moreover, the triangle will be a horizontal contracting one. Furthermore, if the rally before the triple combination is believed to be part of an impulsive move, then the triple combination is the start of the fourth wave.
But if the fourth wave is a triangle, such a possibility exists only if the triangle is limited in nature. Finally, a limiting triangle signals a major top lies ahead. Hence, only by recognizing a triple combination, even if after the fact, one might tell what the market will form next.
Another aspect is that elongated flats typically form as part of triple combinations. These patterns do not appear anywhere but only as the entire leg of a triangle or a part of a leg of a triangle. If an elongated flat is part of a leg of a triangle, then it is part of a triple combination. Therefore, the mere presence of an elongated flat is enough to suggest the possibility that the market forms a triple combination.
Finally, perhaps the most important reason why a triple combination is important for the Elliott trader is the implications for the next price action. Namely, the triple combination cannot be fully retraced by a wave of the same degree.
Hence, if the triple combination is the leg of a triangle, it cannot be retraced by the subsequent waves. This limits where the market can and cannot go next, helping the Elliott trader in its efforts to build a proper money management system.
These are just a few of examples telling us why triple combinations are important to be discovered as soon as possible. But they must respect one key concept – the waterfall concept.
A Visual Perspective of a Triple Combination
The image below shows what a triple combination looks like. This is a triple combination that starts with a flat and also has a flat as the second correction. Naturally, it ends with a contracting triangle, and by the time the price breaks above the triangle’s b-d trendline, the triple combination ends.
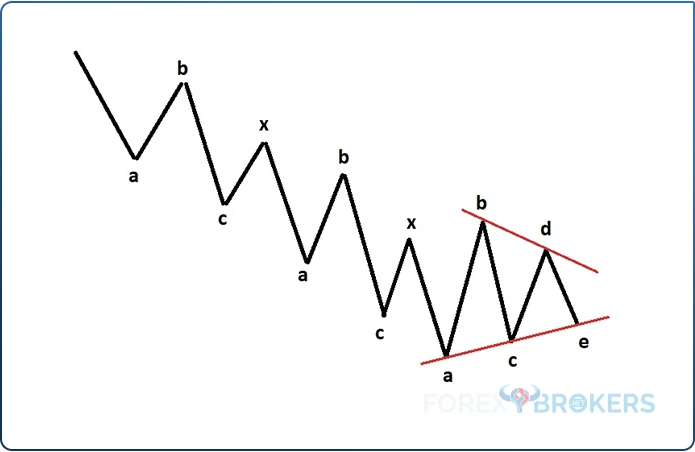
But, such a triple combination is incorrect because it does not respect the waterfall concept. Without these conditions satisfied, there is a strong likelihood that the count for the triple combination is incorrect.
The Waterfall Concept with a Triple Combination
Just like in the case of a double zigzag, the waterfall concept means that as it moves, the market should respect the same ratios – 61.8% and 38.2%. Because a triple combination has three segments (excluding the x-waves), the 38.2% ratio refers to the third one.
As such, in a triple combination, the second correction’s length should be 61.8% of the first correction. Also, the third correction’s length should be 38.2% of the second correction.
The Waterfall Concept in Impulsive Waves
Interestingly enough, the waterfall concept is not limited to corrective waves only. Instead, one can find the idea working in impulsive waves, too.
More precisely, in double-extended impulsive waves.
A double-extended impulsive wave is a unique pattern that has two extended waves. Not only that the third wave is longer than 161.8% of the first wave, but the fifth wave is also longer than 161.8% of the third wave.
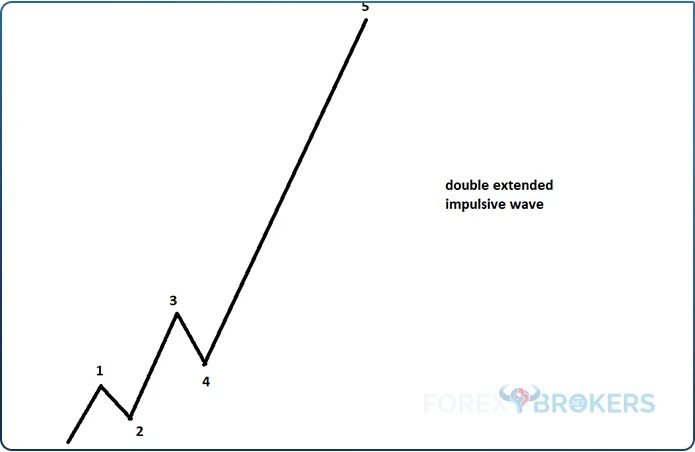
Other than that, the pattern respects all the rules of an impulsive wave. However, the waterfall concept allows the trader to guess where the fifth wave should end.
The first step in applying the waterfall concept in impulsive waves is to measure the distance from the start of the impulsive pattern to the end of the third wave. Then, project it to the upside (in a bullish pattern) to find the minimum distance that the fifth wave should travel.
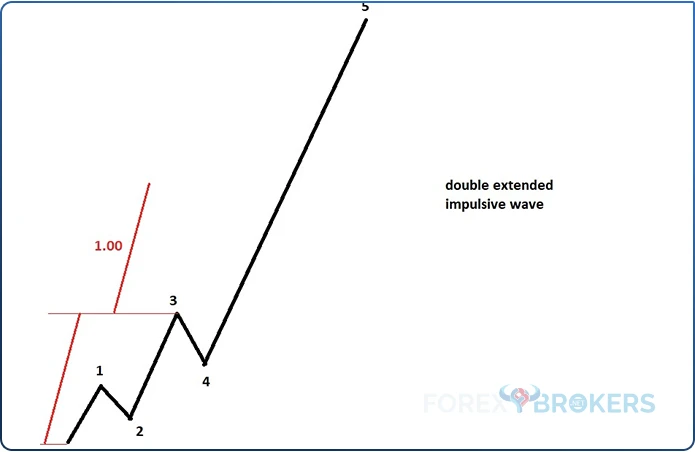
The second step is to calculate 161.8% of the entire 0-3 movement. That is the most logical place where the fifth wave might end.
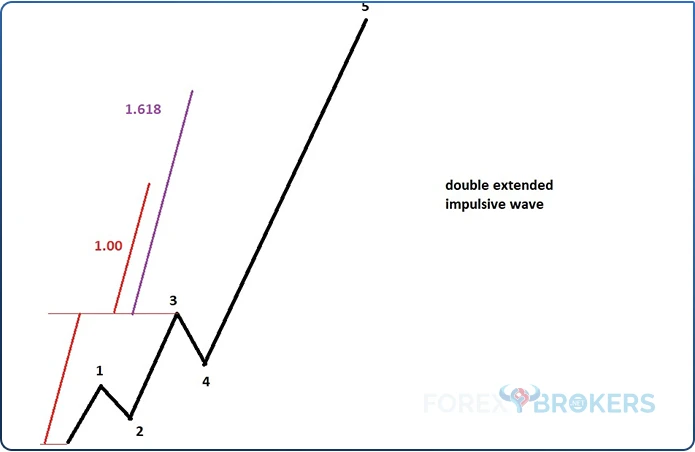
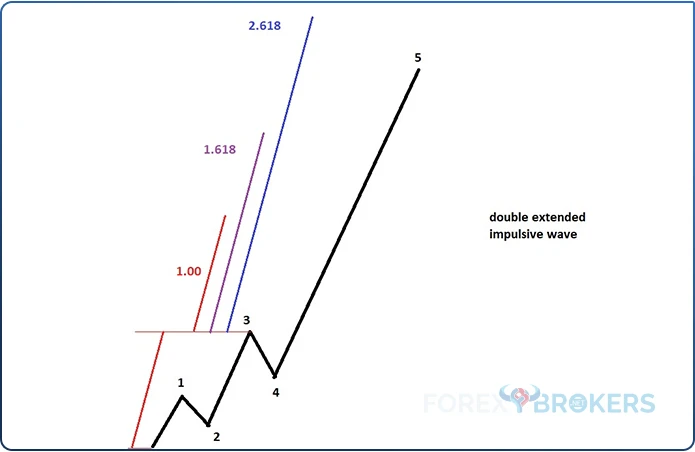
Finally, the last step is for the impulsive wave to end at 2.618 when compared to the 0-3 distance. However, This is the least likely place where the 5th wave might end.
Therefore, if one is to find out the place to sell the market after a double extended impulsive wave, it would be between 161.8% and 261.8% of the 0-3 move, projected from the end of the third wave.
The Waterfall Concept in Markets – USD/JPY
So far, we have covered the theoretical part. It is, therefore, time to look at one example in the FX market.
Because the waterfall concept is more common in complex corrections, our example deals with a possible triple combination on the USD/JPY 4h chart. Why possible?
The answer comes from the fact that the wave of a bigger degree is not completed yet. Hence, there is always a possibility that the count from the past to be wrong. For this, the Elliott trader, like any other trader, must use money management tools to position the market properly.
Invalidation of a scenario leads to discarding a possibility in the multitude of Elliott Waves possibilities. At the time of writing this article, the USD/JPY price action did not invalidate the triple combination scenario. Therefore, it remains valid, and the more time passes, the more likely it is that the Elliott Wave count is correct.
USD/JPY Broke Higher in 2022
Before anything, one should remember that this is not a trade recommendation. Instead, it is merely an analysis of the USD/JPY most recent price action describing what happened through the lens of the Elliott Waves theory.
2022 has been one of the most difficult trading years in the FX market. The US dollar rallied against everything. For example, the EUR/USD exchange rate traded well below the parity level, diving below 0.96 before buyers emerged.
But the main story of the year was coming from the JPY pairs. In March, the JPY pairs broke higher right after Russia invaded Ukraine.
It was a surprise move for the JPY to weaken under such a context. Typically a safe-haven currency, it used to be bought in such times, but in 2022 it wasn’t.
Perhaps this is the reason why the JPY pairs rallied so hard. Or perhaps the fact that the Bank of Japan kept insisting on its yield curve control measures designed to ease the monetary policy, while other central banks, led by the Federal Reserve of the United States, embarked in the steepest tightening cycle ever.
The USD/JPY led the way higher. It consolidated for a long time below 116, and when it broke above, it did not look back anymore.
The 3rd Wave Ended With the Move Above 150
So violent was the bullish breakout that the USD/JPY pair rallied to 120 in a blink of an eye. 130 was next, as traders scrambled to keep pace with the violent movement.
The volatility quickly spread to other JPY crosses, such as the EUR/JPY or the GBP/JPY. But make no mistake; the USD/JPY was in the driving seat.
As it turned out, 130 was just another milestone in what ended up being a 3rd wave extension impulsive move. The entire five-wave structure is incomplete, but the 3rd wave most likely ended when the market rallied above 150.
Here’s why.
First, the USD/JPY formed a running correction for the 2nd wave. Effectively, it means that the end of the second wave was above the end of the first wave.
Whenever it happens, the x-wave part of the 2nd wave is extremely violent. This is the wave that caused the market rally and ended only when the market traded well above 145.
Second, a running correction almost always ends with a triangle. It did so in this case, as reflected by the chart below.
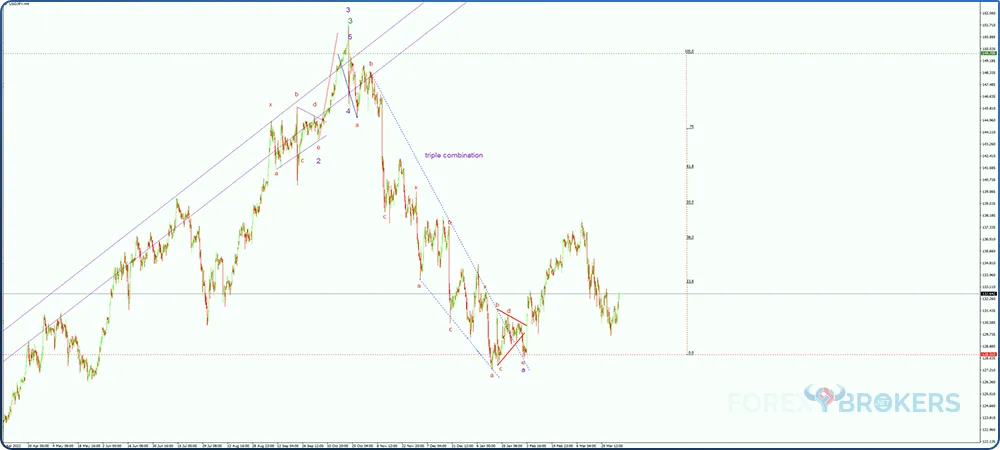
Third, the wave to follow the running correction is typically 261.8% when compared to the 1st wave’s length. As it turns out, the Fibonacci ratio was respected almost by the pip point.
Focus on the chart above and on the move higher to 145. At that point, the Bank of Japan intervened in the currency market for the first time in decades.
Effectively, it sold USD and bought JPY in a move that, naturally, sent the USD/JPY lower. The pair dropped from above 146 to 140, only to be bought again by speculators. By the time the triangle was completed, the third wave had started, and the exchange rate had climbed above the level where the Bank of Japan intervened.
5th Wave Failure Marks a Marginal Top
As is often the case, the central bank’s interventions do not work from the first time. It did not work this time either, so the Bank of Japan was forced to intervene again as the exchange rate climbed above 150.
The market tried to push against the Bank of Japan again, but this time failed. In doing so, the USD/JPY has put a marginal top in place, which is not the actual top you see on the chart but the subsequent move (lower) that followed.
This is called a 5th wave failure; the subject was treated in a different article part of this trading academy. What is important here is that a 5th wave failure usually marks an important top. It did here, too, as the USD/JPY declined from above 150 to below 126 in a very aggressive move.
But on the way down, it formed an important pattern – a triple combination. It is perhaps more important to remember now where triple combinations form.
As mentioned earlier in this article, a triple combination commonly forms the longest segment of a triangle. Therefore, if the move down from 150 to 126 is a triple combination, and the previous move that ended was the end of a 3rd wave (in green), it means that the triple combination is part of the 4th wave of the same degree (green).
Can we say the 4th wave ended where the triple combination ended? No, we cannot because the triple combination is usually the longest wave of a triangle.
Moving forward with the logic, if the triple combination is the longest wave of a triangle, it means that the 4th wave (in green) must be a triangle. But Elliott was very clear that triangles can only form as 4th waves if they are limited in nature.
Therefore, one should expect a limiting triangle as the 4th wave of the impulsive structure and the first segment, wave a, to be a triple combination.
A Triple Combination Cannot Be Retraced by a Wave of the Same Degree
One of the critical things about triple combinations is that a wave of the same degree cannot fully retrace them. Therefore, if wave a of the upcoming limiting triangle is a triple combination, one should expect that no parts of the future price action belonging to the rest of the triangle’s segments (i.e., waves b, c, d, and e) should decline below the triple combination’s ending point.
This statement has been put to the test with the most recent price action. Following the triple combination’s end, the market rallied.
It climbed more than one thousand pips points, but the rally ended abruptly when a banking crisis started in the United States in March 2023. Several banks failed, triggering a sharp selloff in risk assets, such as the US stock market.
This time, the JPY did act as a safe haven, as the JPY pairs dropped like a rock on the news. In a matter of a couple of weeks, the USD/JPY was trading back to the 130 level.
For the triple combination scenarios and the limiting triangle scenario to remain valid, the decline caused by the US banking crisis should not have gone beyond the end of the e-wave (in red) that marks the triple combination’s end. It did not, and thus, one can say that we have further proof that the drop from 150 to 127 is a triple combination.
And now, it is time to use the waterfall concept to see if the market respected it on the way down. If yes, we are closer to the limiting triangle scenario and we do know how the price action will unfold next.
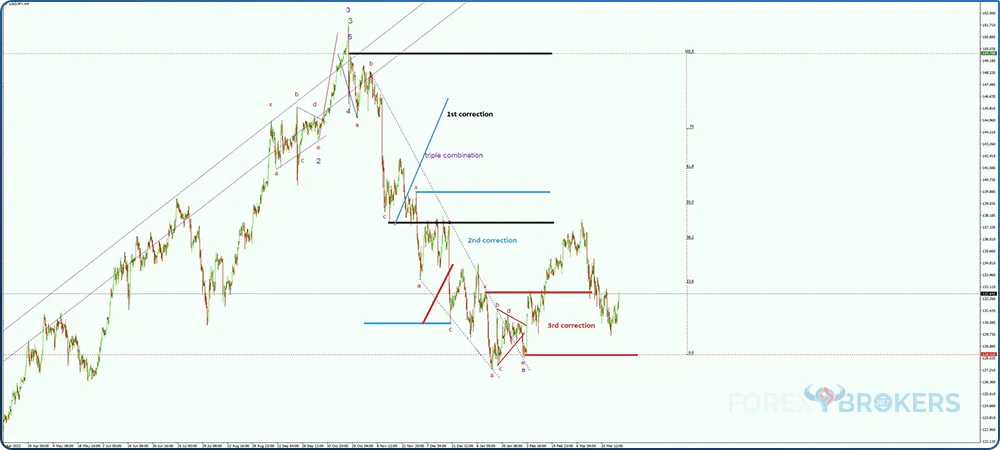
Checking for the Waterfall Concept Rules on a Triple Combination
Like the name suggests, the corrections part of the triple combination must be smaller than the first one. Also, they should respect the Fibonacci ratios mentioned earlier in the theoretical part of this article.
So, the first step in checking if the triple combination respected the waterfall concept is to measure the distance the market traveled during the first correction. More precisely, check the distance of the first a-b-c (in red) and mark it on the chart. In our example, the distance is marked with two horizontal black lines.
Next, do the same with the second correction (the second a-b-c in red). The second correction, seen in blue on the chart above, is about 61.8% of the first correction.
Finally, measure the third correction, which is a triangle (a-b-c-d-e in red). It should be about 38.2% of the second correction.
Therefore, one can say that the triple combination does respect the waterfall concept. This is yet another proof that the market formed a triple combination as the first segment (i.e., wave a) of a limiting triangle.
So what should happen next?
The Elliott trader should draw the 0-2 trendline of the original impulsive move and project it further on the right side of the screen. The 4th wave in green (i.e., the limiting triangle) should end beyond that trendline, meaning that the USD/JPY should consolidate until well in the second half of 2023.
What would invalidate the scenario? Any move below or above the lowest or highest point of the triple combination should invalidate the scenario, and the Elliott trader should review the count.
At the time of writing this article (i.e., the second week of May 2023), the USD/JPY exchange rate is at 135 after rallying over 137 from below 130. It appears that wave B of the triangle is unfolding, and one should be patient for the market to trade well above 140 again, but it will take time as triangular consolidations take a lot of time when compared to other patterns.
Conclusion
Most likely, many readers have had a difficult time understanding the waterfall concept. This is especially the case of putting all together when explaining the triple combination scenario.
But in the end, the Elliott Waves theory is nothing but a combination of various scenarios tested until one works. By keeping it under a proper money management system, the trader maps the road ahead and eliminates the false scenarios until the right one remains.
The waterfall concept should boost the trader’s confidence that the right count is in place. The triple combination scenario would have been shaken without the market respecting it.
All in all, this is more of a fine-tuning of the Elliott Waves theory. But sometimes, the smallest details are the ones that matter, and Elliott was a master at putting everything together to find the right path to success.
