

302
Throughout this trading academy, we have covered many aspects of the Elliott Waves Theory. It has become clear by now that this trading theory is not as simple as it looks at 1st glance.
Ralph Elliott developed a trading theory designed to explain past market movements. Based on the interpretation of different cycles from the past, Elliott traders aim to forecast the future.
To do so, they interpret simple and complex market corrections and impulsive waves – classic and terminal. By putting together the different market “waves,” Elliotticians end up with trading scenarios that often offer good risk–reward ratios. Therefore, the Elliott Waves Theory enables money management by providing a target and an invalidation level for each trade.
Let’s consider a classic impulsive wave structure. It is a 5-wave structure labeled with numbers, and the 2nd wave corrects into the 1st wave’s territory.
Most of the time, the 2nd wave’s retracement exceeds either 38.2% of the 1st wave’s length, 50% of its length, or even 61.8% or more. However, according to the rules established by Ralph Elliott, the 2nd wave should not fully retrace the 1st one. In other words, when trading a classic impulsive wave, the trader should place the invalidation level, or the stop-loss order, at the start of the 1st wave.
The Elliott trader obtains the target for the trade by searching for the extended wave. According to the Elliott Waves Theory, at least 1 wave should extend. Furthermore, the wave’s length must exceed 161.8% of the next-longest wave in the impulsive structure.
All these have been covered in past articles dedicated to the Elliott Wave Theory. But everything presented so far requires the 2nd wave to end in the 1st wave’s territory.
What if it does not? In this case, we are talking about a running correction.
What Is a Running Correction?
A running correction ends above its starting point (in a bullish trend) or below its starting point (in a bearish trend). Let’s use an example to illustrate the concept better.
An impulsive wave has 2 corrective structures – the 2nd and the 4th waves. The Elliott Waves rules state that the 2nd wave cannot retrace beyond the start of the 1st wave. Also, the 4th wave cannot retrace beyond the beginning of the 3rd wave.
However the theory does not mention anything about any limitations in the opposite direction. In other words, the 2nd wave can, and in fact often does, move beyond the 1st wave’s territory in the opposite direction. Similarly, the 4th wave often does the same, moving beyond the 3rd wave’s territory.
Before moving forward, we should point out that running corrections form mainly as the 2nd wave of an impulsive move. Rarely, a running correction may also appear as the b-wave of a zigzag.
How to Count a Running Correction
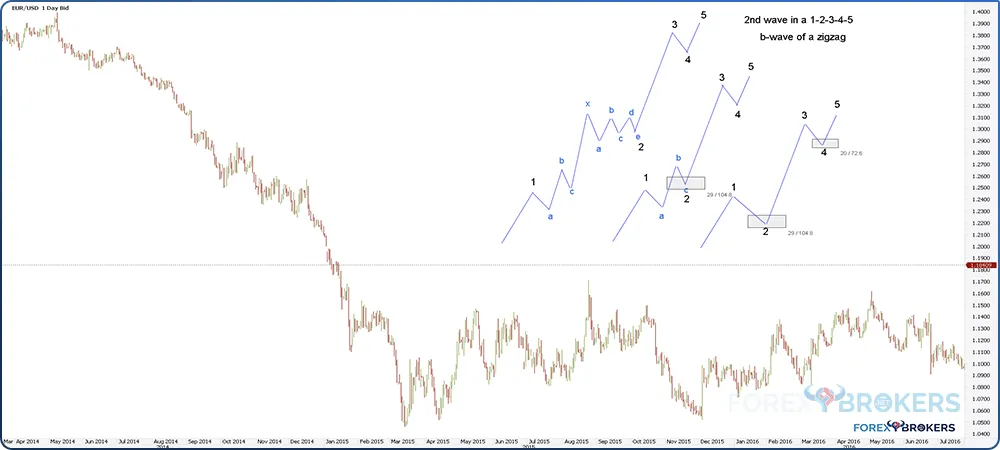
Below is a EURUSD daily chart showing a decline from the 1.40 area to below 1.10. The move downward came in the context of the European Central Bank reacting to the sovereign debt crisis and cutting the deposit facility rate below 0.
On its way down, the EUR/USD pair formed an impulsive wave. But how do we count the 5-wave structure? Can we do it using the classic structure of an impulsive wave, as shown on the right side of the picture below? Unfortunately, we cannot because the Elliott Waves rules regarding the extended wave would not be respected.
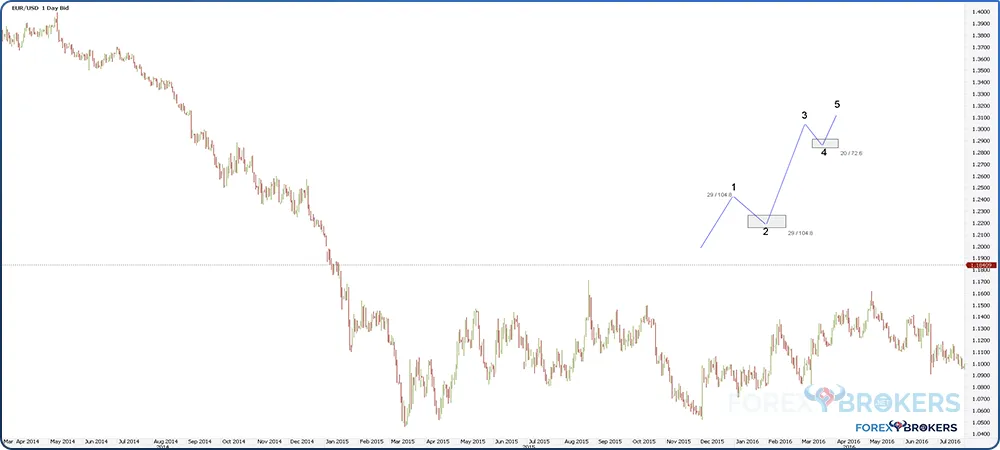
The chart above shows the typical classic impulsive move, with both the 2nd and the 4th waves ending in the territory of the 1st and 3rd waves, respectively. As mentioned earlier, in such a structure, only the 2nd wave may form a running correction.
Simple Running Corrections
This is 1 possibility, and please focus on the 2nd wave in black. It is a flat pattern, an a-b-c, but the c-wave ends above where the 1st wave ends. In other words, this is running correction because the end of the c-wave coincides with the 2nd wave’s end.
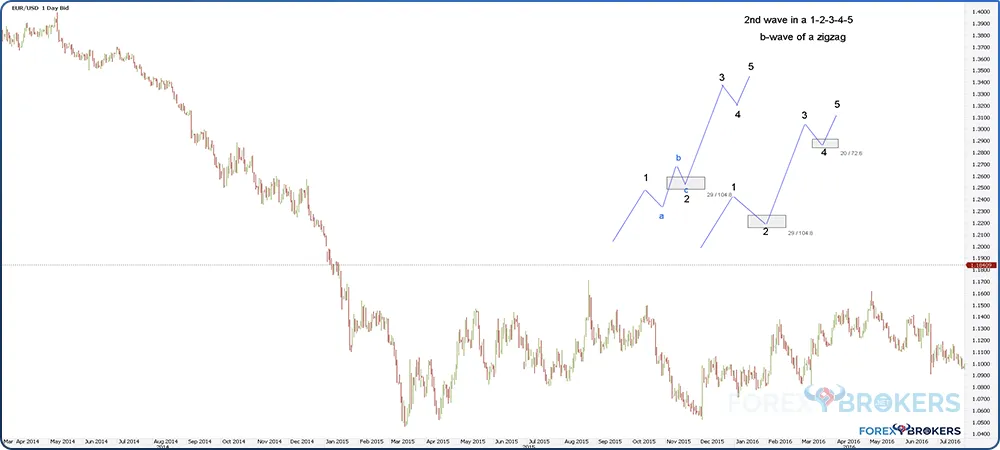
The a-b-c in the 2nd wave is a running flat. We have covered the different types of flats in previous articles here in this trading academy, but a running flat pattern is a particular type of flat.
To review, there are 3 categories of flat patterns, each containing 3 types of flats:
- Flats with a weak b-wave:
- Flat with a b-failure:
- The b-wave retraces between 61.8% and 80% of the a-wave
- The c-wave fully retraces the b-wave but not more than 123.6% of its length
- Flat with a double failure:
- The b-wave retraces between 61.8% and 80% of the a-wave
- The c-wave fails to fully retrace the b-wave
- Elongated flat:
- The b-wave retraces between 61.8% and 80% of the a-wave
- The c-wave retraces more than 161.8% of the b-wave
- Flat with a b-failure:
- Flats with a normal b-wave:
- Flat with a c-failure:
- The b-wave retraces between 80% and 100% of the a-wave
- The c-wave fails to fully retrace the b-wave
- Common flat:
- The b-wave retraces between 80% and 100% of the a-wave
- The c-wave fully retraces the b-wave but not more than 123.6% of its length
- Elongated flat:
- The b-wave retraces between 80% and 100% of the a-wave
- The c-wave retraces more than 161.8% of the b-wave
- Flat with a c-failure:
- Flat with a strong b-wave:
- Irregular failure:
- The b-wave retraces more than 100% of the a-wave
- The c-wave fails to fully retrace the b-wave
- Irregular flat:
- The b-wave retraces more than 100% of the a-wave
- The c-wave fully retraces the b-wave but not more than 123.6% of its length
- Elongated flat:
- The b-wave retraces more than 100% of the a-wave
- The c-wave retraces more than 161.8% of the b-wave
- Irregular failure:
All flats have 2 corrective waves (the a-wave and the b-wave) and 1 impulsive structure (wave c). What about a running flat?
What Is a Running Flat Pattern?
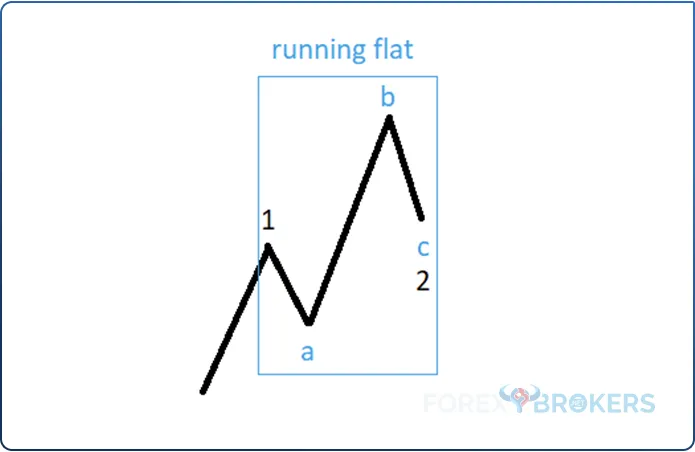
The previous image depicts a running flat as the 2nd wave of a classic impulsive move. We can see from the beginning that the b-wave is strong because it retraces more than 100% of the a-wave.
We also notice that the c-wave fails to retrace the b-wave fully despite being impulsive on its own. Moreover, it does not end in the territory of the a-wave. Finally, it ends above the end of the 1st wave.
Are There Any Other Simple Running Corrections?
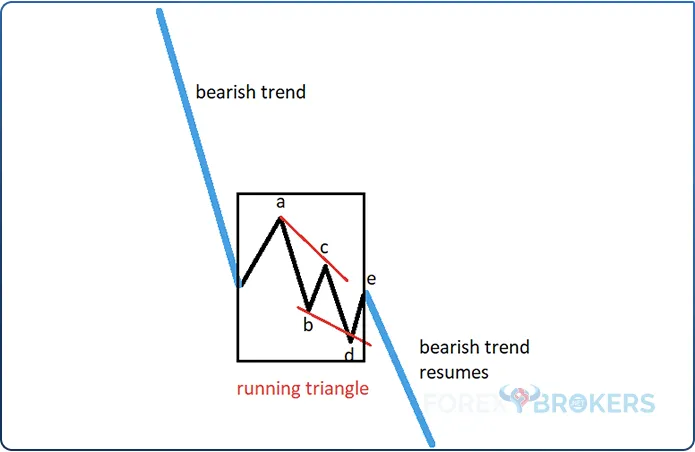
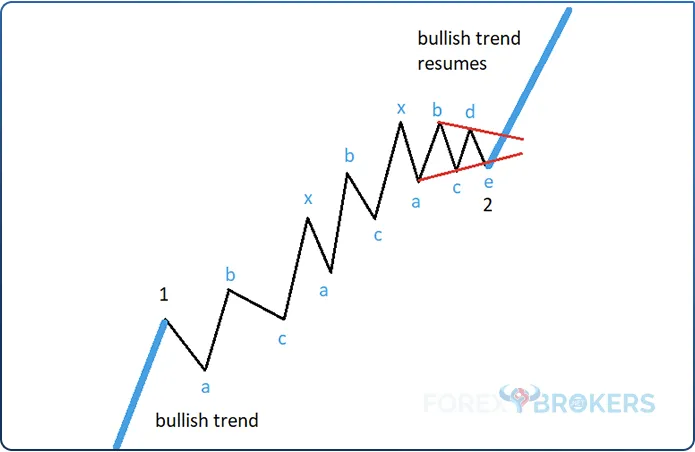
Yes – a running triangle. Contrary to expectations, triangles may end higher or lower than their starting points. In fact, a running triangle is much more common than a running flat pattern but not as common as a simple correction.
A running triangle typically forms at the end of a complex running correction, such as a double or a triple three running pattern. Here is how a running triangle looks:
Complex Running Corrections
A complex running correction has at least 1 and a maximum of 2 intervening waves. These waves, which connect 2 or 3 simple corrections, may also be running, meaning that they may be a running flat or a running triangle on their own.
The image above shows a complex running correction as the 2nd wave of an impulsive move. This is called a double three running pattern because:
- It has 1 large x-wave
- It has 2 simple corrections – a running flat and a contracting triangle
- It ends higher than where the 1st wave ends
What Makes a Double Three Combination?
A double three-running pattern has 2 corrective waves connected by 1 intervening wave – the x-wave. 1 thing we should mention here is that a double three-running pattern never starts with a triangle. However, in almost all instances, it ends with a triangle.
This means that the only 2 possibilities left are for the market to form a flat or a zigzag as the 1st corrective segment of the pattern. Expect a flat pattern to appear more often at the start of a double three-running pattern than a zigzag.
To summarize, a double three-running pattern will likely start with a flat, have 1 single x-wave, and end with a triangle. Therefore, we should label it as a-b-c–x–a-b-c-d-e.
Suppose you check out other articles dedicated to the Elliott Waves theory in this trading academy. In that case, you will notice that the labeling of a double three-running pattern is identical to that of a double combination. The only difference is the x-wave’s length – in the case of a double combination, the x-wave is small, meaning it does not retrace more than 61.8% of the previous a-b-c correction. In contrast, in the case of a double three-running pattern, the x-wave exceeds 61.8% of the 1st a-b-c.
Applying a Double Three Running Pattern on the EUR/USD Chart
Coming back to the EUR/USD chart, we notice a 3-wave correction after the 1st decline – this is the flat pattern at the start of the double three running pattern.
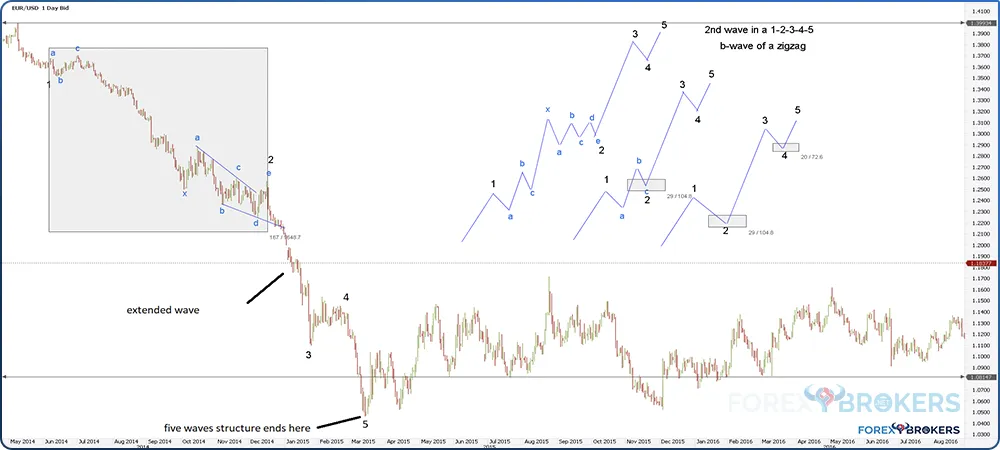
Next, the intervening wave, or the x-wave, follows. As the chart reveals, the x-wave is the longest segment of the running correction, which is common in such patterns.
The triangular pattern that follows is not running because the e-wave ends above the start of the a-wave. Hence, it is just a regular triangle that marks the end of the double three-running pattern. Here, the extended 3rd wave begins and must exceed the 1st wave by 161.8%.
Finally, the 5-wave structure ends at the next lower low. Elliott traders should double-check the principle of alternation here, as the 2nd and the 4th waves in a classic impulsive structure should differ. In this case, as the 2nd wave is a complex correction, the 4th should be simple. Also, because the 2nd wave took a lot of time to complete, the 4th should take less time.
Triple Three Running
A triple three-running pattern goes a step further, as it has 3 corrections connected by 2 intervening x-waves. Here are some things to consider when interpreting a triple three-running pattern.
First, like in a double three-running pattern, a triple three starts with a flat or a zigzag. A flat is more common.
Second, a double three always ends with a triangle. Moreover, the triangle is likely to be a contracting one.
Also, the 2 intervening x-waves should not be a triangle. If a triangle forms where an x-wave should be, that means that the running correction ended. Remember that in the case of running corrections, triangles signal the end of the pattern.
After the triple three running pattern, the 3rd wave extension begins. Because of the length of the running pattern and the length of the extended wave, the market move that follows the triple three running pattern is exceptionally aggressive, with little or no pullback. In other words, a trader positioned on the wrong side of the market has no option but to take the loss.
The labeling of the triple three-running pattern is similar to the labeling of a triple combination. The difference, just like in the case of a double three running pattern, is that the 2 x-waves retrace more than 61.8% of the 1st a-b-c. As such, the proper labeling is a-b-c–x–a-b-c–x–a-b-c-d-e. Basically, the 2 x-waves connect the 3 simple corrections.
Double Running Flat
A single-running flat forms less often as a simple correction than a double or even a triple-running flat. Therefore, whenever the Elliott trader sees a running flat, the immediate assumption is that an x-wave must follow.
A double-running flat pattern has 2 running flats connected by an x-wave. The price action during a double-running flat is aggressive due to the short c-waves.
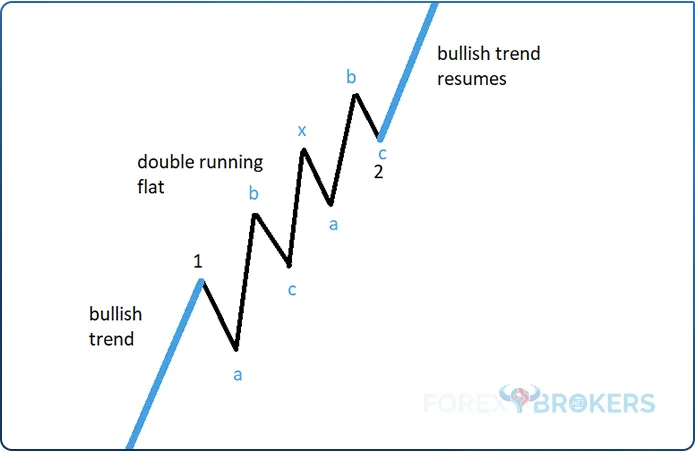
Labeling a double-running flat pattern is similar to a double combination that does not end with a triangle: a-b-c–x–a-b-c. The 2 a-b-c- structures correspond to the 2 running flats.
Triple Running Flat
A triple running flat is the most powerful running correction of them all. No less than 3 running flats make up this pattern, with 2 intervening x-waves moving in the same direction as the general trend.
The 2 intervening waves are often longer than the running flats, making the entire pattern even more powerful. The price action that follows a triple three-running flat pattern is almost vertical, and the 3rd wave’s extension goes well beyond the minimum 161.8% of the 1st wave’s length.
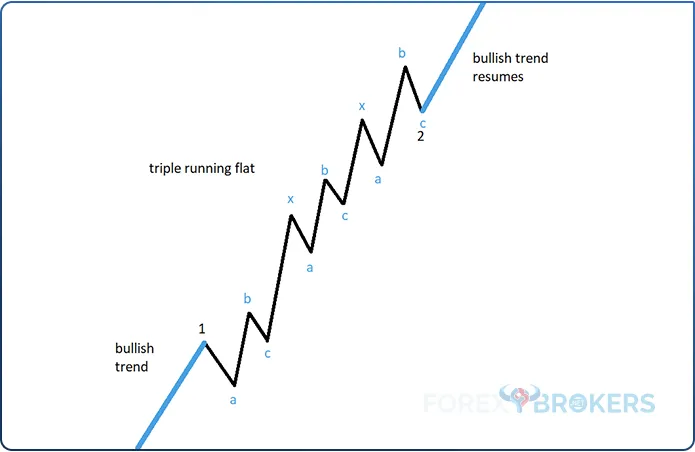
The labeling of a triple running flat pattern is similar to the labeling of a triple flat pattern. Basically, we have 3 flat patterns connected by 2 intervening waves: a-b-c–x–a-b-c–x–a-b-c.
What Can We Expect from the Intervening X-wave?
The intervening or connecting wave, the x-wave, is a corrective wave of its own. Elliott stated that the x-wave can be either a simple or a complex correction. Some limitations, however, do exist.
One of the limitations is that the x-wave and the corrective wave that follows should differ. For example, let’s assume that the running correction starts with a flat pattern. Next, the x-wave forms a triangle. Because the x-wave is a triangle, the final part of the running correction cannot be a triangle – it must be something else. In general terms, 2 consecutive triangular patterns are unlikely to form in any Elliott pattern.
Another thing to consider when interpreting the x-wave is its size. It should not differ much from the size of the other corrective parts of the pattern.
The x-wave in a running correction is often more aggressive than any other segment. Because of that, it is often a zigzag or a zigzag family pattern.
Zigzags are often mistakenly interpreted by traders as impulsive waves. Instead, they are corrective patterns – an a-b-c where both the a-wave and the c-wave are impulsive. As such, the price action during a zigzag formation is even more aggressive because it has 2 impulsive waves.
Furthermore, the x-wave in a running correction is often a zigzag family pattern – a double or a triple zigzag. In this case, the market’s advance or decline is exceptionally violent because it forms consecutive impulsive waves with shallow pullbacks.
Why Is the Concept of a Running Correction Controversial?
The biggest issue with running corrections is not that they are difficult to understand. Rather, the message they send to the Elliott Wave trader is compelling.
Remember that an impulsive wave must have at least 1 extended wave. This extension applies to the next-longest wave out of the 3 impulsive waves of a lower degree. More precisely, only the 1st, 3rd, and 5th waves can extend in a 5-wave structure labeled 1-2-3-4-5.
The extended wave must have at least 161.8% of the next-longest wave. Also, most of the time, the 3rd wave in an impulsive wave is the one that extends.
In the case of running corrections, the extended wave always forms after a running correction ends. This is valuable information for the Elliott trader because the presence of a running correction tells us that the market is forming a classic impulsive wave with a 3rd-wave extension.
The controversy stems from the fact that the extension applies from the end of the 2nd wave – the running correction. As a result, the rally following a running correction always appears to be more aggressive than other market moves.
Things to Know about Running Corrections
Right off the bat, a running correction indicates strong trending conditions. As an Elliott Wave trader, whenever you suspect a running correction is forming, that means that the trend will continue well beyond the end of the pattern.
Most running corrections are complex rather than simple. A running triangle is the least likely simple running correction to form, and most complex corrections begin with a flat pattern.
The x-wave is often the most aggressive segment of a running correction. Because of that, it is usually either a zigzag or a zigzag family pattern. If it is a zigzag family pattern, think of double and triple zigzags – patterns with a strong channeling component.
A running correction often ends with a triangle. Also, a triangle rarely forms as the x-wave of a running correction.
Where Do Running Corrections Appear?
Running corrections are part of an impulsive wave or a zigzag. In the 1st case, they appear as the 2nd wave of an impulsive move. In the 2nd case, they form as the b-wave of a zigzag.
When running corrections form as the 2nd wave of an impulsive move, the 3rd wave is the one that extends. In this case, the 3rd wave’s length is approximately 161.8% of the 1st wave’s length, and the running correction is often even bigger than the extended 3rd wave.
In the rare cases when a running correction appears as the b-wave of a zigzag, traders should not focus on the running correction but on the element of time that defines the zigzag. This is because the 2 impulsive waves (i.e., the a-wave and the b-wave) must take a similar amount of time to form in a zigzag.
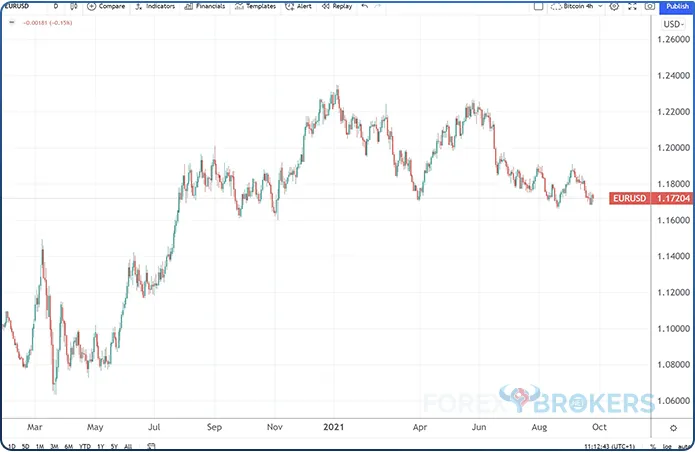
More Examples of Running Corrections
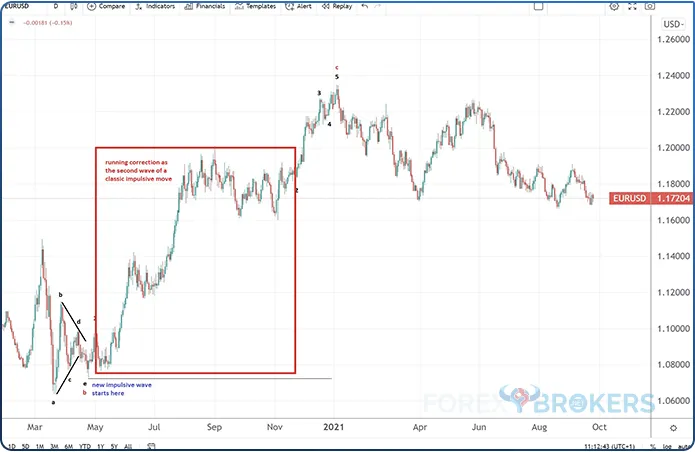
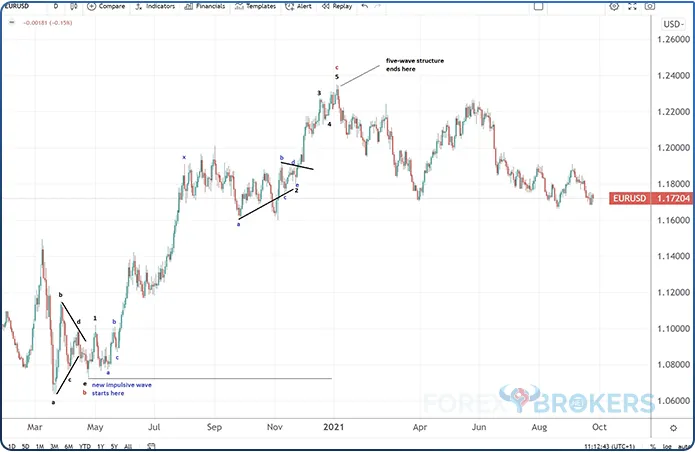
The last part of this article is dedicated to building a complete Elliott Waves analysis to demonstrate how to incorporate a running correction in an impulsive move. Our example comes from the same currency pair as earlier, the EUR/USD, as the price action following the COVID-19 pandemic formed an impulsive wave with a running correction.
Where It All Started
In May 2020, the world’s financial markets were tumbling. The COVID-19 pandemic triggered a sharp move downward in the global stock markets. Moreover, the price of oil dropped below 0 for the 1st time ever.
How was this even possible? First, the clearinghouse allowed oil futures contracts to settle below 0, and the next thing we knew, oil was trading close to -$40/barrel.
Naturally, the developments in the stock market and the oil market led to a risk-off environment. In such an environment, investors look for safe-haven currencies, such as the Japanese yen or the Swiss franc, but also for the safety of the world’s reserve currency.
So, the U.S. dollar was in strong demand, but then the Fed intervened. First, it lowered the federal funds rate close to 0. Next, it opened U.S. dollar swap lines with other major central banks in the world. Literally, it flooded the system with dollars.
The effect was notable. After some more consolidation below 1.10, the EUR/USD exchange rate broke higher. The rally held for the rest of the trading year, and the pair closed 2020 at a high.
Know Where the Previous Wave Ends
The key to any Elliott Wave count is a top/down analysis. We have already covered this concept in a different article in this trading academy. In short, a top/down analysis starts with larger timeframes and continues on to lower timeframes from where the previous timeframe ended.
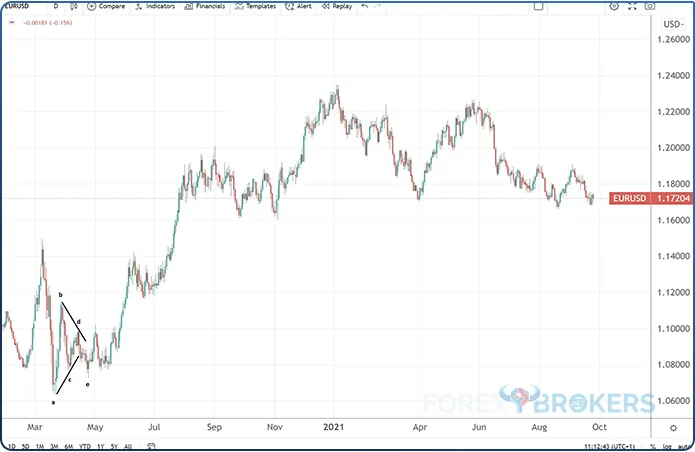
In the case of the EUR/USD pair, the market formed a triangular pattern right before the pandemic started. It ended with the Fed’s intervention, and when the b-d trendline was broken, the triangle ended.
Now, it is time to put the triangle into context. According to a top/down analysis of larger timeframes, the triangle is the 2nd part of a double combination. In other words, when the triangle ended, the double combination ended, too.
Trading the C-wave of a Flat Pattern
In a flat pattern, the a-wave and the b-wave are corrective, while the c-wave is impulsive. The c-wave can be either a classic impulsive wave or a terminal one. A classic impulsive wave is more common, so the Elliott trader already has a bias.

But where does the impulsive wave start? In the upper chart it starts at the end of the triangle, which marks the end of the previous wave – the b-wave – shown on the chart above in red. As such, the Elliott count for the red c-wave starts from where the triangle ends.
Labeling the Classic Impulsive Wave
Now that we’ve established where the c-wave of the flat pattern starts let’s look at possible labeling. The 1st swing higher is the 1st wave, but then it would not be possible to label the 2nd wave as the next push lower.
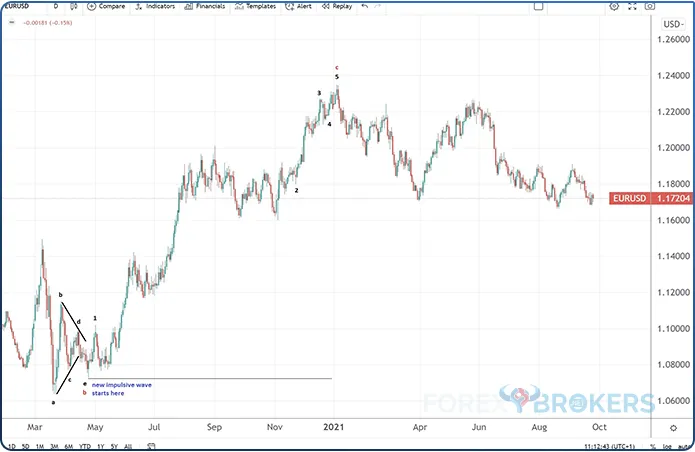
We cannot do that because the 1st pullback after the end of the 1st wave is so strong that it retraces almost the entire swing higher. Whenever that is the case, the pullback is only part of the 2nd wave.
It is also impossible to label the end of the 2nd wave on every other higher low because that would invalidate the rules of an impulsive wave. Therefore, the proposed labeling is seen above in black, completing the c-wave of a flat pattern.
Note that the end of the 2nd wave is much higher than the end of the 1st wave, meaning that the 2nd wave is a running correction. That is where the 3rd wave starts and where the extension begins.
Earlier in the article, it was mentioned that the 3rd wave following a running correction rarely exceeds much more than 161.8% of the 1st wave’s length. Therefore, when trying to label an impulsive wave with a running correction, think of this rule, as it can help you correctly identify the 3rd wave.
Labeling a Double Three Running Pattern
Here is how to label the running correction that the EUR/USD pair made as the 2nd wave of a classic impulsive move. First, we start from the end of the 1st wave and label the 1st a-b-c of a lower degree.
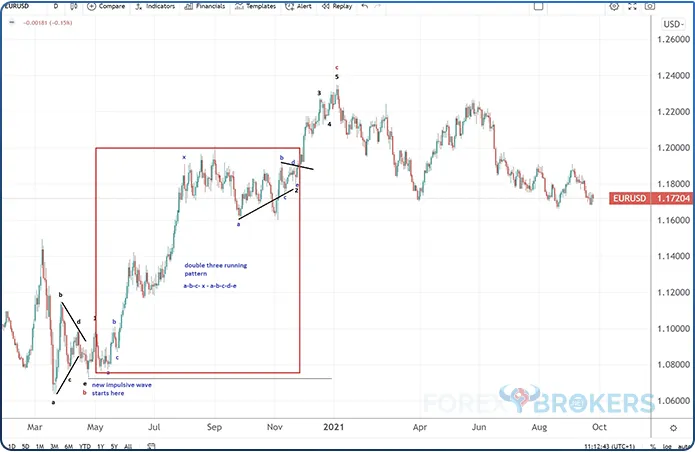
After the market ends the 1st a-b-c, it sharply advances higher, almost vertically, with no pullbacks. This is the x-wave, or at least the 1st part of the x-wave. Remember that the x-wave, or the intervening wave, is also corrective. The move higher is followed by a retracement smaller than 61.8%, which implies that the x-wave is a zigzag. In a zigzag, the c-wave’s time length must equal the time it took the a-wave to form. As such, the end of the x-wave is not at the end of the 1st swing higher but at the end of the next higher high, as labeled above.
A running correction, just like a double or triple combination pattern, usually ends with a triangle. This is the 1st pattern to look for at the end of a running correction and only if it is unlikely to find one should a trader look for other possibilities. The end of the triangle marks the end of the running correction – a double three-running pattern labeled as a-b-c-x-a-b-c-d-e.
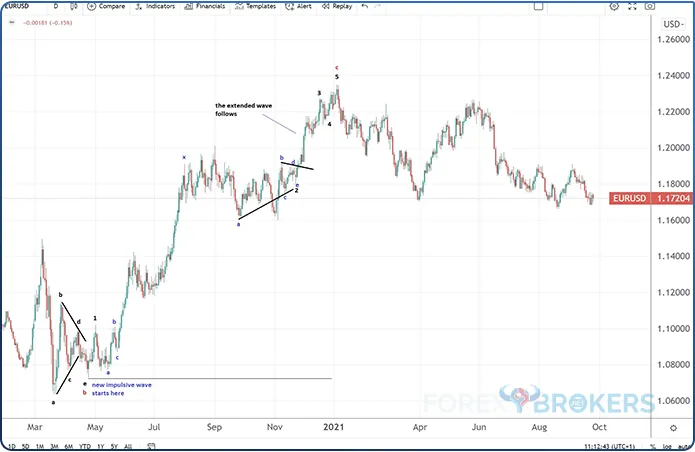
Checking the Rules of an Impulsive Wave
The next thing to do is to check that all the rules of an impulsive wave are respected. First, we need to check the extended wave. To do so, we measure the length of the 1st wave and calculate 161.8% of it.
Next, we project the outcome from the end of the running correction; the 3rd wave should be approximately 161.8% of the 1st wave’s length.
Second, we should draw 2 trendlines that help prove that this is an impulsive wave. 1 trendline is the so-called “0–2 trendline.” This trendline connects the beginning of the 5-wave structure with the end of the running correction (i.e., the end of the 2nd wave). The Elliott rule states that no part of the 1st wave should pierce this trendline.

We see that the 0–2 trendline is pierced only by the 2nd wave. Hence, the rule is respected. Furthermore, another Elliot rule regarding impulsive waves states that no part of the 3rd wave should pierce the same trendline – once again, respected.
How about the 2–4 Trendline?
Another trendline to consider is the 2–4 trendline. This one connects the end of the 2nd wave with the end of the 4th wave, and the rule says that no part of the 3rd wave should pierce it.
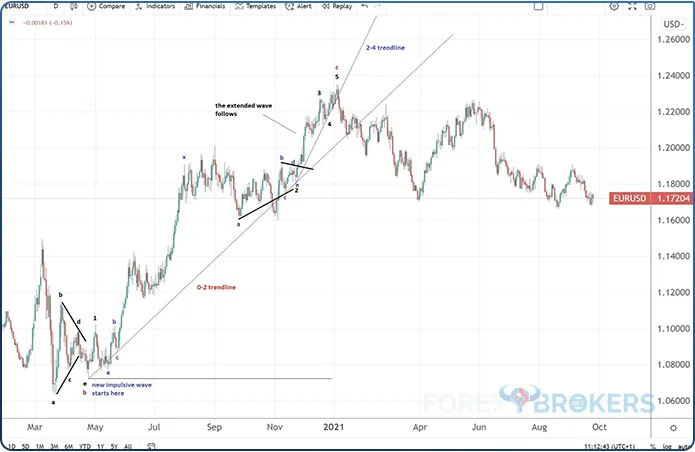
The chart above shows that the 3rd wave does not pierce the 2–4 trendline, so the classic impulsive wave respects this rule. It should be clear now that the Elliott Waves theory while appearing simple and easy to use, becomes pretty complex the deeper one gets into the details. For proof, please refer to the EUR/USD chart at the start of this example and compare that blank chart with the one you see here.
An Impulsive Wave Ends with a Terminal Structure
We are not entirely done with the classic impulsive wave analysis. There is still 1 rule to check: the equality rule states that the 5th wave’s length should be 61.8% or 161.8% of the 1st wave’s length. Because the 1st wave is longer than the 5th wave, we should check the 61.8% rule. It does appear that the 5th wave is around 61.8% of the length of the 1st wave, but the rule should not apply here.
During the 5th wave’s formation, the price action tells us that we should not check the equality rule. If the price action pierces the 2–4 trendline during the formation of the 5th wave, the market is forming a terminal impulsive wave as the 5th wave of the classic impulsive move. The chart above clearly shows that the price action during the 5th wave’s formation pierces the 2–4 trendline, meaning that the impulsive wave ends with a terminal structure.
At this point, the reader may want to check all articles in this trading academy that cover the Elliott Waves theory, particularly the terminal impulsive wave pattern. A clear understanding of this pattern will lead to the correct interpretation of the move after the 5-wave structure has ended.
Conclusion
Running corrections are not easy patterns to understand and interpret. In fact, most of today’s Elliott traders ignore them completely because they are not familiar with such interpretations or market behavior.
But running corrections are common in the currency market. They end above (in a bullish trend) or below (in a bearish trend) the end of the previous Elliott Wave.
Moreover, the price action that follows a running correction is almost always the longest segment in the pattern. If the pattern is impulsive, as is often the case, the extended wave follows the running correction.
There are not many places where a running correction may appear, so the bias is that they will usually form as the 2nd wave in an impulsive structure. However, the b-wave in a zigzag may also run.
All in all, running corrections are complex structures that form ahead of an extended market segment. They tend to be the most time-consuming structures in a pattern and often end with a triangle.
Out of all the running patterns mentioned in this article, the double three running pattern is the most common. It must end with a triangle. The rest of the patterns rarely appear, but when they do, the price action is even more aggressive than in the case of a double three-running pattern.
Related Lessons


See more from this category