
531
Financial markets are made of different assets, such as equities, bonds, commodities, currencies, etc. They all react to various fundamental or technical inputs, and many have a direct or indirect correlation.
But in times of turbulence or euphoria, mainstream media tends to focus on the equity markets rather than the bond market. One would often hear that the main stock market indexes in the United States dropped a few percentages or reached all-time highs, but seldom info about other markets.
That is because the equity markets perform a particular function within societies. They contribute to the so-called wealth effect.
Whenever the assets a person holds increase in value, the household increases consumption. Therefore, a rising stock market creates a wealth effect that, in turn, is beneficial to economic growth.
Another function of the stock market is that it tends to anticipate the business cycle. In other words, it acts as a leading indicator, rising and falling well before a new business cycle phase starts.
Also, the stock market is the place where individual investors may build wealth by compounding their income. Investing in dividend growth stocks is a well-known strategy that led many people to financial independence.
Is the equity market risky? Of course, any investment has a risk, and equities are considered risky assets – more than bonds. Nevertheless, they have a distinct role in financial markets and attract people from all walks of life.
These are only some of the functions performed by the equity markets, and this article will cover them in more detail. But above all, this article focuses on the most important equity indexes in the world, their particularities and, in some cases, their componence.
Roles of Equity Markets
Before looking in detail at stock market indexes, it is worth mentioning once again the two main roles they serve: they contribute to the wealth effect and help investors identify the peaks and troughs of economic growth.
Besides the two, the stock market is the place to go for companies to raise the capital needed for growth. Also, it is the place where investors turn to when in search of additional income. Many investors throughout the time have reached financial independence by investing in dividend-paying stocks.
Stock Market Contributes to the Wealth Effect
Imagine you are the owner of a diversified stock market portfolio. Moreover, regularly, you buy more stocks for your portfolio.
A long-term investment strategy in a tax-efficient account leads to wealth accumulation. Investors may use the dividends and reinvest them to buy new shares or add new capital to do the same.
Add to the scenario a rising stock market. Historically, the S&P 500 index delivered a little over 10% in average annual returns since 1957 until 2021. By applying the above strategy, the power of compounding leads to increased wealth.
You might ask that it doesn't matter if the gains are not withdrawn from the account. But from an economic perspective, it matters because of the wealth effect.
As stocks gain and the portfolio's value increases, so does your wealth. It brings a sentiment of safety, so you'll start spending more money – and more easily. This, in turn, helps the economic sentiment and contributes to the overall economic growth because all investors feel and act the same.
Stock Market Helps Identify the Turns in the Business Cycle
Equity markets serve a variety of roles. As mentioned earlier, one of the main roles is that it acts as a leading indicator of the business cycle.
The business cycle is made of periods of expansion and contraction. The economy has different phases, and certain conditions characterize each phase.
For instance, during an economic recession or contraction, investors would want to know when the business cycle will reach the trough or the lowest point in the recession before starting to grow again. The stock market offers an indication of when this is happening.
The COVID-19 pandemic is the best example. While panic dominated, stocks stabilized and soon enough started to advance. They even made multiple new all-time highs.
Shortly after, the economy began to grow too. Thus, those using the stock market as a leading indicator knew in advance what to expect.
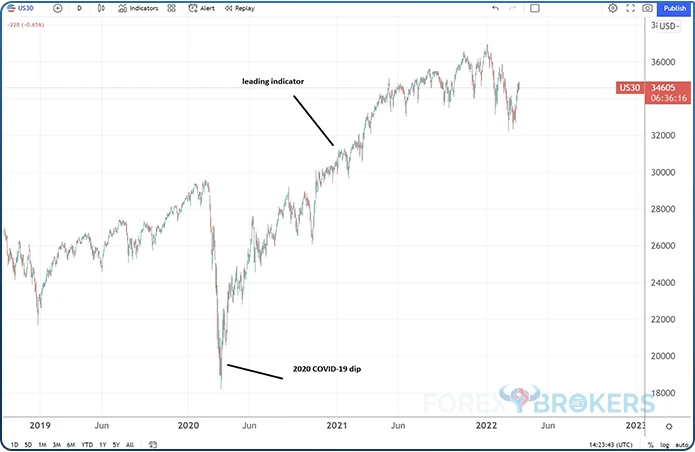
Focus on the chart above. In April 2020, the stock market indexes worldwide declined abruptly. The pandemic triggered such a shock that the WTI crude oil futures contracts settled in negative territory for the first time ever.
Yet, after the initial shock, the stock market stabilized. Moreover, in a quick reaction to the unprecedented monetary and fiscal stimulus measures announced, it bounced from the lows.
The Dow Jones index briefly traded below 20,000 points and bounced and rallied to new all-time highs. The bounce and the rally came well before the economy rebounded, so the stock market acted as a leading indicator of the business cycle.
Stock Market Rewards Long-Term Shareholders
The stock market has rewarded long-term shareholders. It is time to make a distinction between different stock markets.
Economies worldwide are ranked based on various criteria. As such, we can differentiate between advanced, emerging, developing, and frontier economies.
Stock markets in economies other than the advanced or developed ones are subject to other forces than the free market. As such, we must distinguish between long-term shareholders in advanced economies and everyone else.
Life is made from ups and downs – and so is the stock market's performance. However, just as life goes on eventually, the same happens with stocks – there may be periods when the stock market underperforms, but overall, long-term shareholders are rewarded.
First, by receiving and reinvesting dividends. Second, by not selling their participation and, thus, taking advantage of the tax breaks.
How about inflation?
If the annual inflation exceeds the portfolio's performance, we may talk about a decline in real terms. For instance, the annual inflation in the United States in February 2022 was 7.9%. If the stock market does not deliver returns bigger than 7.9% over the same period, we may say that the shareholders lost in real terms (i.e., adjusted for inflation).
But often, the stock market acts as a hedge against inflation, as odd as it may sound. Inflation refers to one currency depreciating and thus, the prices of goods and services "inflate". But so does the prices of stocks, thus, the equity market serves as a hedge against inflation.
Stock Market Indexes
When asked about the stock market, every investor immediately thinks of the US equity market. And for a good reason.
The US market is the most developed one, attracting capital from all over the world. Every successful company planning to access American capital knows the best way to do so is to list its shares on the American stock exchanges.
As such, names such as the S&P 500 or the Dow Jones index come to mind naturally. However, these are only national indexes, a small category of the overall equity market.
Therefore, we can talk about global, regional, and national indexes.
Global Indexes
Global indexes are made of stocks from all over the world. What are they useful for?
Imagine you are a fan of passive investing (i.e., buy an index and do not interfere) and you like to have exposure to all the equities in the developed economies. In this case, you may want to own the MSCI World Index.
Other global indexes are the Dow Jones Global Titans 50, the S&P Global 100 Index, the S&P Global 1200 Index, and the FTSE All-World Index.
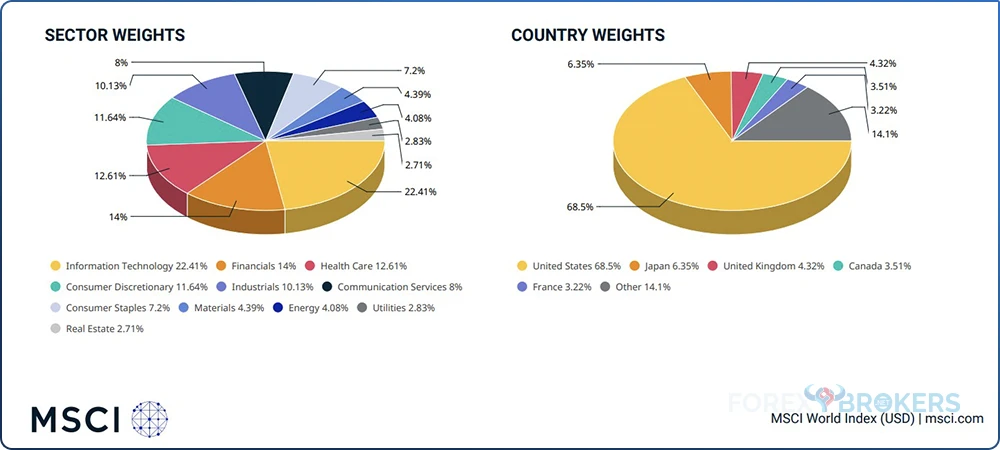
MSCI World Index
The MSCI World Index has 1539 constituents spread over 23 developed markets. The constituents are large and mid-cap companies and the index covers some 85% of each country's free float-adjusted market capitalization.
Top 10 constituents of the MSCI World Index:
- Apple
- Microsoft
- Amazon
- Alphabet – class A shares
- Alphabet – class C shares
- Tesla
- NVIDIA
- Meta Platforms – class A shares
- UnitedHealth Group
- Johnson & Johnson
Unsurprisingly, the United States is the dominant country in the index, followed by Japan and the United Kingdom. The first three most representative sectors are IT, financials, and health care.
Dow Jones Global Titans 50
This index tracks blue-chip stocks traded on major exchanges in the world. Launched in 1999, it is rebalanced annually in September and undergoes quarterly reviews.
Dow Jones Global Titans is made out of 53 constituents and the weight of its top 10 constituents exceeds 47%.
Top 10 constituents of the Dow Jones Global Titans 50 Index:
- Apple
- Microsoft
- Amazon
- Alphabet – class A shares
- Tesla
- Alphabet – class C shares
- NVIDIA
- Meta Platforms
- Johnson & Johnson
- JP Morgan Chase
Judging by the top 10 constituents, the index tracks the technology sector (43.6%), followed by the consumer goods (14.2%) and health care (13.6%).
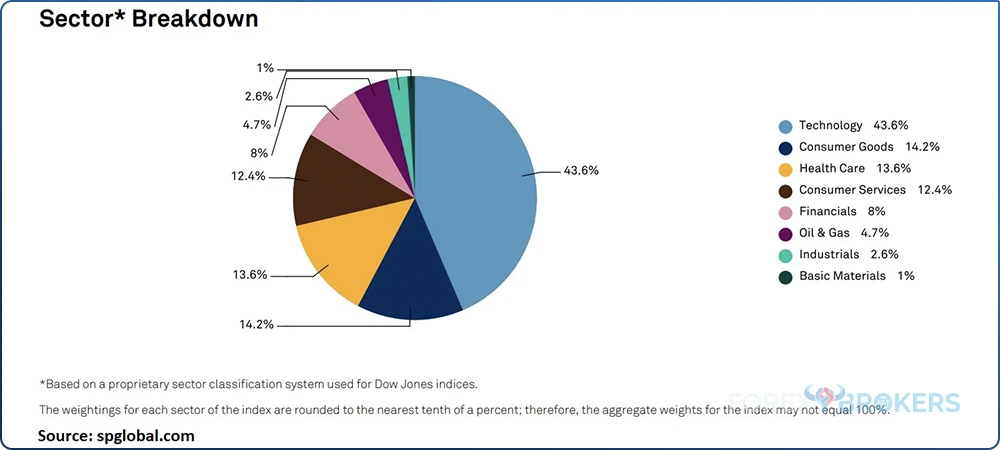
Most of the companies are listed in the United States.
S&P Global 100 Index
The S&P Global 100 Index was launched in February 2000 and is rebalanced quarterly in March, June, September, and December. It comprises 100 large-cap stocks with a market capitalization bigger than $5 billion.
Top 10 constituents of the S&P Global 100 Index:
- Apple
- Microsoft
- Amazon
- Alphabet – class A shares
- Alphabet – class C shares
- Johnson & Johnson
- JP Morgan Chase
- Procter & Gamble
- Nestle
- Exxon Mobil
Country/region breakdown for the S&P Global 100 Index:
- United States
- United Kingdom
- Switzerland
- France
- Japan
- Germany
- South Korea
- Australia
- Spain
- Netherlands
Most of the constituents are from the United States (72.6%), followed by the United Kingdom (7.3%) and Switzerland (5.6%).
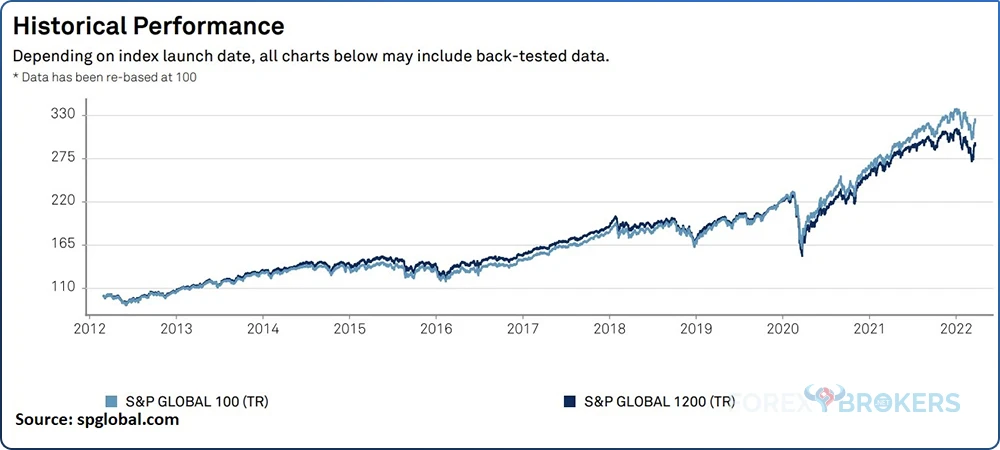
S&P Global 1200 Index
The S&P Global 1200 index captures around 70% of the global market capitalization. More precisely, its constituents are picked from a universe of stocks representing 95% of a country's market capitalization.
The index was launched in 2014 and the ten-year total return was 12.33% at the time this article was written. The top 10 constituents are:
- Apple
- Microsoft
- Amazon
- Tesla
- Alphabet – class A shares
- Alphabet – class C shares
- Nvidia
- Berkshire Hathaway – class B shares
- Meta Platforms – class A shares
- UnitedHealth Group
Most of the companies in this index are from the United States (65.5%), followed by Japan (5.9%), the United Kingdom (4.3%), Canada (3.5%), France (2.9%) and other countries with a smaller representativity.
FTSE All-World Index
FTSE All-World Index is a market-capitalization-weighted index covering more than 95% of the investable market capitalization. The top 10 constituents are:
- Apple
- Microsoft
- Amazon
- Alphabet – class A shares
- Alphabet – class C shares
- Tesla
- Nvidia
- Taiwan Semiconductor Manufacturing
- Meta Platforms
- UnitedHealth Group
Regional Indexes
For exposure to a certain region, one may use regional indexes. What would be a valid reason to use regional indexes?
Geopolitical uncertainty is one. When Russia invaded Ukraine in the first quarter of 2022, investors were shocked by the move. European bourses declined as capital outflows affected the stock market performance.
Investors willing to move money elsewhere but to avoid exposure to Europe, may look for a regional index. For instance, indices in Australia and New Zealand, in Asia or in Latin America.
Here are some of the most popular regional indexes from Europe, Latin America, and Asia: FTSE Euro 100 Index, Euro Stoxx 50 Index, S&P Asia 50 Index, FTSE ASEAN 40 Index and S&P Latin America 40 Index.
FTSE Euro 100 Index
This is one of the indexes that offer exposure to Europe's most highly capitalized blue chip companies. Here are some of the companies part of this index:
- Allianz – Ticker: ALV – Country: Germany – Exchange: Frankfurt Stock Exchange – Sector: Life Insurance
- Barclays – Ticker: BARC – Country: United Kingdom – Exchange: London Stock Exchange – Sector: Financial
- Bayerische – Ticker: BMW – Country: Germany – Exchange: Xetra – Sector: Automobiles & Parts
- B.H.P. Group – Ticker: BHP – Country: United Kingdom – Exchange: London Stock Exchange – Sector: Mining
- Credit Suisse Group – Ticker: CSGN – Country: Switzerland – Exchange: SIX Swiss Exchange – Sector: Financial
- Compagnie de Saint-Gobain – Ticker: SGO – Country: France – Exchange: Euronext Paris – Sector: Construction & Materials
- Danone – Ticker: BN – Country: France – Exchange: Euronext Paris – Sector: Food Producer
- ENI – Ticker: ENI – Country: Italy – Exchange: Italian Stock Exchange – Sector: Oil & Gas Producers
- L'Oreal – Ticker: OR – Country: France – Exchange: Euronext Paris – Sector: Personal Goods
- Iberdrola – Ticker: IBE – Country: Spain – Exchange: Madrid Stock Exchange – Sector: Utility
- Mercedes-Benz Group – Ticker: MBG – Country: Germany – Exchange: Frankfurt Stock Exchange – Sector: Automobiles & Parts
- Nestle – Ticker: NESN – Country: Switzerland – Exchange: SIX Swiss Exchange – Sector: Food Producers
- Tesco – Ticker: TSCO – Country: United Kingdom – Exchange: London Stock Exchange – Sector: Food and Drug Retailers
Euro Stoxx 50 Index
Euro Stoxx 50 is a blue-chip index from the Eurozone. It tracks the performance of 50 companies from 8 countries:
- Spain
- Belgium
- France
- Germany
- Ireland
- Italy
- Netherlands
- Finland
Here are some of the companies part of this index:
- Schneider Electric – Country: France; Sector: Industrial Goods and Services
- L'Oreal – Country: France; Sector: Consumer Products and Services
- Siemens – Country: Germany; Sector: Industrial Goods and Services
- Allianz – Country: Germany; Sector: Insurance
- ASML HLDG – Country: the Netherlands; Sector: Technology
- Linde – Country: Germany; Sector – Chemicals
- Banco Bilbao Vizcaya Argentaria – Country: Spain; Sector: Financials
- Adidas – Country: Germany; Sector: Consumer Products and Services
- Safran – Country: France; Sector: Industrial Goods and Services
S&P Asia 50 Index
The S&P Asia 50 index measures the performance of 50 leading blue-chip companies from four major Asian markets – Taiwan, Singapore, Korea and Hong Kong.
The index was launched in 2017 and the top 10 constituents by index weight are:
- Taiwan Semiconductor Manufacturing
- Samsung Electronics
- Tencent Holdings
- Alibaba Group
- AIA Group
- Meituan Dianping
- China Construction Bank Corp
- JD.com
- Hong Kong Exchanges and Clearing
- SK Hynix
The IT and the financial sectors comprise over half of the index's weight.
FTSE Asean 40 Index
This is an index of large and mid-cap stocks in Indonesia, Malaysia, Thailand, Philippines and Singapore. The top 10 constituents are:
- D.B.S. Group Holdings
- Oversea-Chinese Banking
- United Overseas Bank
- Bank Central Asia
- Bank Rakyat Indonesia
- PTT
- Public Bank B.H.D.
- Malayan Banking
- Telekomunikasi Indonesia
- Singapore Telecommunications
An interesting feature of the FTSE Asean 40 index is that 7 out of 10 constituents are banks.
S&P Latin America 40 Index
The S&P Latin America 40 index tracks the blue-chip companies in countries such as Brazil, Chile, Colombia, Mexico and Peru. It was launched in 1999 and most of the companies part of the index are from the materials sector.
The top 10 constituents are:
- Vale
- Petrobras – preferred ADR
- Itau Unibanco Holding
- Petrobras – ADR
- America Movil
- Banco Bradesco
- Walmart de Mexico
- B3
- Grup Mexico
- Grupo Financiero Banorte
Other representative sectors in the FTSE Asean 40 index are financials, energy, consumer staples, communication services, industrials, consumer discretionary, health care, information technology, utilities and real estate. About 87% of the index's constituents are from two countries alone – Brazil and Mexico.
National Indexes
Regional and world indexes are interesting, but retail traders rarely take positions in such markets. Instead, the retail trading community has a strong opinion about national indexes. This is why national indexes are more popular than regional and global ones.
For example, everyone heard of the Dax index in Germany or the Dow Jones in the United States. However, few retail investors are aware of the S&P Asia 50 index.
These are some of the most popular national indexes:
- Dax – Country: Germany
- Cac40 – Country: France
- FTSE 100 – Country: United Kingdom
- IBEX – Country: Spain
- FTSE MIB – Country: Italy
- S&P TSX 60 – Country: Canada
- Nikkei 225 – Country: Japan
- S&P 500 – Country: United States
- Dow Jones – Country: United States
- Nasdaq – Country: United States
- Russel – Country United States
Germany – Dax Index
Germany is the largest economy in Europe, running a large trade surplus, and is the key driver of European economic growth. It is said that when the German economy is coughing, the entire Europe catches a cold, so everyone should understand Germany's critical role in Europe.
In fact, the European Union was built under two pillars: France and Germany. Therefore, it is no wonder that the German stock market is the most important one on the old continent.
Many indexes exist in Germany, but the most representative one is the Dax index. The acronym stands for Deutscher Aktienindex, which, in a rough translation, means the German stock market index.
It used to have only 30 constituents until recently. The Dax index became modernized as new companies were added, so the number of constituents reached 40. The idea behind Dax's enlargement from 30 to 40 constituents was to make it more attractive to investors by adding companies from modern industries.
Here are the 40 Dax index's constituents at the time of writing this article:
- adidas AG
- Airbus SE
- Allianz SE
- BASF SE
- Bayer AG
- Beiersdorf Aktiengesellschaft
- BMW AG St
- Brenntag SE
- Continental AG
- Covestro AG
- Daimler AG
- Delivery Hero SE
- Deutsche Bank AG
- Deutsche Börse AG
- Deutsche Post AG
- Deutsche Telekom AG
- E.ON SE
- Fresenius Medical Care AG & Co. KGaA St
- Fresenius SE & Co. KGaA
- HeidelbergCement AG
- HelloFresh SE
- Henkel AG & Co. KGaA Vz
- Infineon Technologies AG
- Linde plc
- Merck KGaA
- MTU Aero Engines AG
- Münchener Rück AG
- Porsche Automobil Holding SE
- PUMA SE
- Qiagen N.V.
- RWE AG St
- SAP SE
- Sartorius AG Vz
- Siemens AG
- Siemens Energy AG
- Siemens Healthineers AG
- Symrise AG
- Volkswagen AG Vz
- Vonovia SE
- Zalando SE
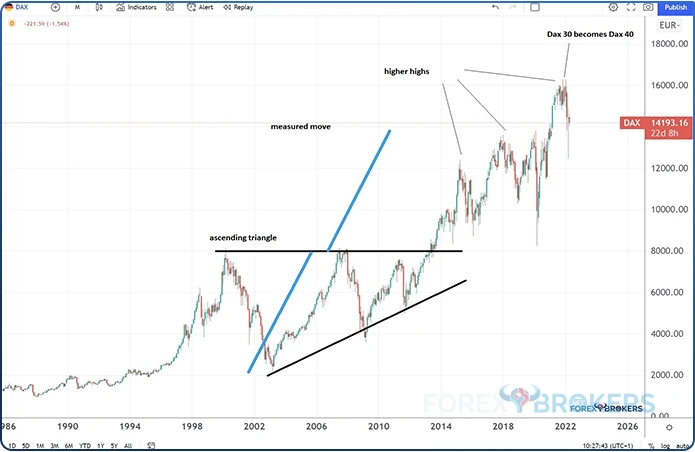
Dax Index Long-Term Technical Analysis Picture – April 2022
The Dax index's historical technical analysis picture looks bullish. When writing this article (April 2022), the Dax index's series of higher highs remains intact.
A series of higher highs is common during bullish trends. Therefore, bears should only look for the downside if the Dax index drops below 8,000 points.
Starting with 2020, the Dax and other stock market indexes had a hard time. This is because COVID-19 triggered some unprecedented measures from governments and central banks globally, which affected the stock market. Also, the Russia-Ukraine war in 2022 triggered unprecedented measures from Western nations against Russia.
Looking at past price action, one can notice a classical technical analysis pattern, discussed in other articles, part of this trading academy – an ascending triangle. This triangle took more than a decade to form, frustrating investors as it started in 2000 and ended in 2014.
But when it broke higher, it did not look back until it reached the measured move. As seen in blue on the chart below, the measured move equals the longest leg of the contracting triangle, projected higher from the horizontal base.
The chart also shows how the market built energy against the horizontal resistance before breaking higher. The long-term resistance turned into support, which held the market on the move lower during the COVID-19 pandemic.
France – CAC 40
CAC40 is the main French stock market index. As the name suggests, it tracks the most significant 40 companies out of the 100 biggest market capitalization stocks listed on the Euronext Paris stock exchange.
Here is the list of the CAC40 constituents:
- AIR LIQUIDE
- AIRBUS
- ALSTOM
- ARCELORMITTAL SA
- AXA
- BNP PARIBAS ACT.A
- BOUYGUES
- CAPGEMINI
- CARREFOUR
- CREDIT AGRICOLE
- DANONE
- DASSAULT SYSTEMES
- ENGIE
- ESSILORLUXOTTICA
- EUROFINS SCIENT.
- HERMES INTL
- KERING
- L'OREAL
- LEGRAND
- LVMH
- MICHELIN
- ORANGE
- PERNOD RICARD
- PUBLICIS GROUPE SA
- RENAULT
- SAFRAN
- SAINT GOBAIN
- SANOFI
- SCHNEIDER ELECTRIC
- SOCIETE GENERALE
- STELLANTIS NV
- STMICROELECTRONICS
- TELEPERFORMANCE
- THALES
- TOTALENERGIES
- UNIBAIL-RODAMCO-WE
- VEOLIA ENVIRON.
- VINCI
- VIVENDI SE
- WORLDLINE
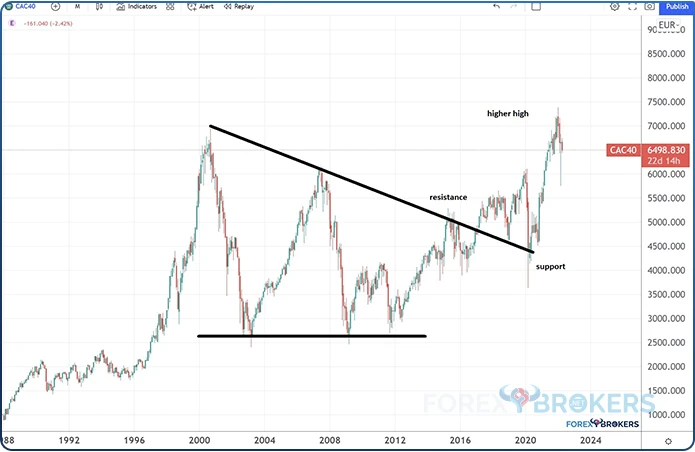
CAC40 Long-Term Technical Analysis Picture – April 2022
A contracting triangle is visible on the CAC40 index, too. It also took about 15 years to form and by the time it broke higher, the previous dynamic resistance became support.
During the COVID-19 pandemic, the market declined sharply. Fears of a global recession sent the stock market tumbling in what turned out to be the fastest decline from a bull to a bear market.
However, vaccines brought back much-needed hope. Coupled with the fiscal and monetary stimulus from the central banks both in Europe and the United States, the market bounced from dynamic support given by the upper edge of the contracting triangle.
The move higher was so strong that it pushed the CAC40 index above the previous high established in 2000. As such, a new series of higher highs is in place.
The war in Eastern Europe between Russia and Ukraine has triggered renewed fears of a recession in Europe. Stock market indices in continental Europe have reacted quickly and dropped from their highs.
Nevertheless, the CAC40 technical analysis picture looks constructive, and only a drop below 4,000 would invalidate the bullish bias.
United Kingdom – FTSE 100
FTSE 100 stands for the Financial Times Stock Exchange 100 index, and it is comprised of the largest 100 stocks listed on the London Stock Exchange. This is the benchmark index for the UK market, followed by investors worldwide interested in how the UK stock market performs.
Spain – IBEX
The leading Spanish index is the Iberian Index, or, simply, the IBEX. It is tracking the performance of the largest 35 stocks listed on the Madrid Stock Exchange. Here is the list of its constituents:
- ACCIONA
- ACERINOX
- ACS
- AENA
- ALMIRALL
- AMADEUS
- ARCELORMIT.
- B.SANTANDER
- BA.SABADELL
- BANKINTER
- BBVA
- CAIXABANK
- CELLNEX
- CIE AUTOMOT.
- ENAGAS
- ENDESA
- FERROVIAL
- FLUIDRA
- GRIFOLS CL.A
- IAG
- IBERDROLA
- INDITEX
- INDRA A
- INM.COLONIAL
- MAPFRE
- MELIA HOTELS
- MERLIN
- NATURGY
- PHARMA MAR
- REC.
- REPSOL
- ROVI
- SIEMENS GAME
- SOLARIA
- TELEFONICA
IBEX Long-Term Technical Analysis Picture – April 2022
IBEX made an all-time high before the 2008-2009 Great Financial Crisis. The index halved from above 16,000 points, trading close to the pivotal 6,000 level, which provided support during the years that followed.
Spain was one of the countries hit the hardest during the housing crisis in 2008-2009. While the crisis originated in the United States, it affected the global markets, especially in those regions where investors bet heavily on the housing market, such as Spain.
Moreover, a few years later, the Greece sovereign crisis affected all European countries, especially those in the South, such as Spain and Italy. As such, the index had a hard time gaining ground, but the bias looks constructive.
Despite the ongoing weakness in the past two decades, IBEX consolidates against dynamic resistance given by the upper edge of a contracting triangle. It is not the first time it has tried at resistance, but as long as the horizontal support at the 6,000 area holds, the bias is that the resistance will eventually give way.
As such, the long-term bias for the IBEX index remains bullish as long as the price action holds above 6,000 points. On the flip side, a decline below 6,000 puts bears in control.
Italy – FTSE MIB
FTSE MIB or Milano Indice di Borsa, is the representative stock market index in Italy. It is made of 40 stocks listed on the Italian stocks exchange, and the list can be found below:
- A2A
- AMPLIFON
- ATLANTIA
- AZIMUT
- BANCA GENERALI
- BANCA MEDIOLANUM
- BANCO BPM
- BPER BANCA
- BUZZI UNICEM
- CAMPARI
- CNH INDUSTRIAL
- DIASORIN
- ENEL
- ENI
- EXOR
- FERRARI
- FINECOBANK
- GENERALI ASS
- HERA
- INTERPUMP GROUP
- INTESA SANPAOLO
- INWIT
- ITALGAS
- IVECO GROUP
- LEONARDO
- MEDIOBANCA
- MONCLER
- NEXI
- PIRELLI & C
- POSTE ITALIANE
- PRYSMIAN
- RECORDATI ORD
- SAIPEM
- SNAM
- STELLANTIS
- STMICROELECTRONICS
- TELECOM ITALIA
- TENARIS
- TERNA
- UNICREDIT
- UNIPOL
Canada – S&P TSX 60
Launched in June 2013, the S&P TSX 60 is a large-cap index tracking companies listed on the Canadian equity market. The index is rebalanced quarterly in March, June, September, and December.
The top 10 constituents list:
- Royal Bank of Canada
- Toronto-Dominion Bank
- Enbridge
- Bank of Nova Scotia Halifax
- Brookfield Asset Management
- Canadian National Railways
- Bank of Montreal
- Shopify
- Canadian Pacific Railway
- Canadian Natural Resources
Financials make up 36.7% of the index, followed by the energy (16.3%) and materials sector (11.4%).
Japan – Nikkei 225
Nikkei 225 is the benchmark index for Japanese stocks. It was first calculated more than 70 years ago and comprised 225 stocks listed on the Prime Market of the Tokyo Stock Exchange.
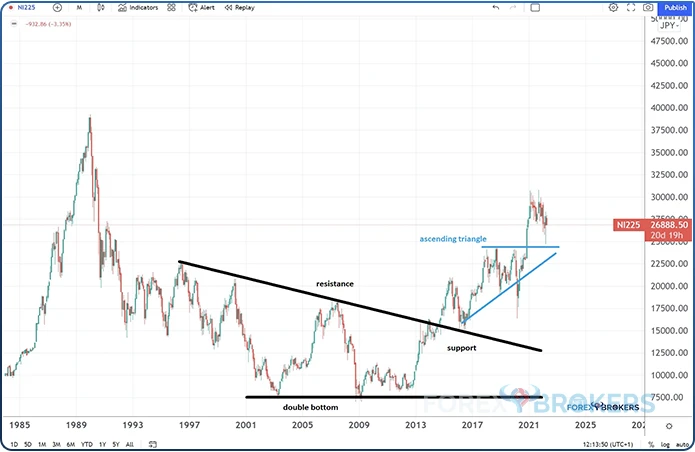
Nikkei 225 Long-Term Technical Analysis Picture – April 2022
The long-term technical analysis picture looks bullish on the Nikkei 225. From left to right, the chart below shows the market forming a triangle as a reversal pattern. The triangle broke higher in 2014-2015 and since then, the market has formed a series of higher highs and higher lows.
Such a series is a typical formation during bullish markets. Moreover, the Nikkei 225 index found strong support in an area that previously acted as resistance. It was rejected in 2016 and made a new higher high.
In the last years, the market formed an ascending triangle. The last segment of the triangle was the move lower triggered by the COVID-19 pandemic. However, it was quickly bought, and the market has reached yet another higher high.
However, the Nikkei 225 all-time high remains close to 40,000 points – much higher than the current levels. Despite the Bank of Japan buying ETFs and providing unlimited support, investors are reluctant to buy Japanese equities.
Nevertheless, the technical picture looks bullish. Unless the Nikkei 225 drops below 15,000 points, the bulls still have a case for higher levels to come.
United States – S&P 500, Dow Jones, Nasdaq, Russel
As mentioned earlier in this article, the largest equity market in the world is the United States. Therefore, all companies with local success and expansion plans want to have access to American investors. To do so, listing on the American exchanges is the next logical step.
We won't discuss the US stock market indices here because they were discussed in detail in a previous article part of this trading academy. We will only mention that the S&P 500, Dow Jones, Nasdaq or Russel are the world's most important equity market indices.
If the US markets rally, the other indices in developed economies follow. On the contrary, a bearish US equity market will trigger similar reactions in other advanced economies. Hence, if there is an equity market to track and closely watch, it is the American one.
Conclusion
The stock markets serve an important role in society. Private capital has always had a vital contribution to economic growth and developments in the stock market affect an entire economy.
Stock market indexes are ideal for passive investing. Instead of searching and picking a particular company, many investors prefer to buy and hold an ETF that tracks a stock market index. This way, the investor gets exposure to an entire market and ETFs offer a great way to invest by paying just a small fee.
No matter what market an investor is exposed to (e.g., currencies, commodities, bonds), the stock market affects all of them. Therefore, all traders and investors must watch what is happening with the global stock market in order to be ready to react and adjust their portfolios if needed.
Related Lessons


See more from this category