Investors always look for the highest possible yield for their capital. They seek a reward for the risk they are willing to take by deploying their money in various parts of the local or global economy.
The rise of online trading led to retail investors being able to participate in the international financial markets. While it is a competitive environment, many retail traders succeeded where only professionals did before.
Trading differs from investing in many ways. One of the ways is that investors have a longer-term horizon or perspective for their positions. Traders usually close trades faster—mostly speculating.
But the two concepts are interchangeable. Investors are speculators, too; they only speculate using mostly fundamental analysis based on economic and political events happening in the world. Also, investors do trade. Traders invest too. The simple funding of a trading account is an investment for all retail traders. The struggle comes from growing the trading account or the original investment.
Therefore, both investors and traders have similar interests—to increase the size of their capital. For that, it is mandatory to clearly understand what is going on in financial markets, what triggers sharp market moves, and how to interpret a financial asset in the context of a portfolio.
This article explains correlations, their types, and the dangers of trading correlated markets. Also, it will discuss the benefits of diversifying a trading account to such a point to protect it while leaving room for further growth.
Finally, it will discuss the most significant correlations to consider in financial markets. Think of correlations you might be familiar with, such as the one between the price of oil and the risk-on environment, but also correlations less known, such as the one between the price of gold and the U.S. 10-year yield.
What Is a Correlation?
When two or more financial assets move together, they are correlated. Correlations may be direct and inverse and may have different degrees—some tighter than others.
Correlations have a role in modeling portfolios. The term may sound fancy, but it applies to retail investors as well as to professionals.
A portfolio consists of multiple assets or positions in the market. It may be that a trader prefers to trade only the currency market—in this case, the portfolio is made of multiple trades or positions in the FX market.
Or, a trader may prefer to trade only stocks. In this case, a portfolio is composed of multiple stocks. Furthermore, a trader may choose to have exposure to various sectors, diversify the portfolio, and protect against the downside. In this case, as well as in the previous ones, knowing the correlation degree between assets is crucial in protecting the investment.
Let’s start with the FX market. Within the currency market, various correlations do exist. For instance, one of the most powerful inverse correlations we will discuss later in this article is between the EUR/USD and the USD/CHF pairs. Being aware of it helps avoid overtrading.
When trading the stock market, an investor should be aware that stocks from the same sector will most likely behave similarly amid various market events. For instance, in periods of monetary tightening, financial stocks tend to outperform as yields are on the rise. As such, the entire sector, not only a particular stock, is in demand. Naturally, one may use valuation metrics to distinguish between various stocks in the financial sector and pick the most attractive one. Still, the idea is that the sector is bullish, not just one stock. As such, when looking for diversification, it is best found by adding other stocks from uncorrelated sectors.
Types of Correlations
Correlations are of two types—direct and inverse. Put simply, when two or more financial assets move in the same direction or react to an economic event similarly, they have a direct correlation. The opposite is true—when two or more financial assets move in opposite directions or react differently to an economic event or news, they have an inverse or indirect correlation.
The degree of correlation is also important. For example, let’s suppose that U.S. dollar economic news, such as the nonfarm payrolls (NFP) report, was released, and the outcome is less than the market expected. In other words, the U.S. economy did not create as many new jobs for the month as the market participants expected. As a result, the U.S. dollar will normally weaken across the board, losing against its peers, such as the British pound or the euro.
Therefore, the GBP/USD and the EUR/USD pairs may move higher in a directly correlated move, but the gains may differ. For example, the GBP/USD may gain 1% on the news, while the EUR/USD only 0.5%. While the correlation is direct, the degree is less than 100%. What would make it 100%? The answer comes from the EUR/GBP cross. If the EUR/GBP would remain flat on the news, then the GBP/USD and the EUR/USD pair would be directly correlated with a 100% correlation degree.
Direct Correlations
While the paragraphs above explained the types of correlations one may expect to find in financial markets, it is time to have some examples. Before anything, though, it is important to remember that all correlations, direct or inverse, may either last forever or end in a blink of an eye.
In other words, a correlation exists until it doesn’t anymore. When the factors that hold the correlation change or the inputs, then the correlation ceases to exist. This is one of the most dangerous situations to trade because a strong correlation may lead to overconfidence in traders. When the correlation stops, it usually triggers heavy stop losses.
Safe-Haven Currencies
A safe-haven currency is one that is bought during uncertainty. Think of an economic recession that suddenly expands worldwide, such as the one triggered by the housing crisis 2008 or the COVID-19 pandemic. Currency traders will look for the safety of specific currencies perceived as safe havens, such as the Swiss franc (CHF), the Japanese yen (JPY), or even the U.S. dollar, the world’s reserve currency.
Here’s why. Let’s use the JPY to exemplify the concept of a safe-haven currency.
According to some estimates, Japanese investors have invested about $80 billion or more abroad. This means that they buy foreign bonds and assets, such as equities, but to pay for them in other currencies, they need to sell their local currency—the JPY. They are confident they will get a better return, thus feeling optimistic about the global economy.
When an economic recession starts or some event threatens economic growth, Japanese investors sell their assets, perceived as riskier, and repatriate their money. In doing so, the JPY strengthens, gaining against other currencies.
The same is valid with other safe-haven currencies, such as the CHF and the USD. They all move in a directly correlated manner, so if you end up trading a safe-haven currency during an economic recession, it makes no sense to add similar trades based on different safe-haven currencies to the portfolio because there would be no diversification benefit.
Risk-On/Risk-Off Markets
The risk-on risk-off concept is explained in other articles that are part of this trading academy. The terms refer to correlated markets triggered by some events that spark similar moves in various financial assets.
Despite the general belief among retail traders, investing in the stock market is considered risky or riskier than other assets, say, U.S. treasuries. Therefore, a risk-on sentiment involves a bullish stock market.
A bullish stock market typically comes at the expense of a weaker U.S. dollar. Hence, a risk-on sentiment or environment is characterized by rising U.S. stocks and a declining U.S. dollar. Therefore, the EUR/USD and the AUD/USD, GBP/USD, and NZD/USD pairs advance. Meanwhile, the USD/CAD pair declines.
The key thing to remember here is that safe-haven currencies play along, meaning that the USD/JPY advances, and so does the USD/CHF. If not, they will likely trade in tight ranges as long as the risk-off environment holds.
This is an important consideration from a correlation point of view because all these markets should be treated, interpreted and traded as one. Because of this, traders must pay special attention to all these details to avoid overtrading.
How about a risk-off sentiment?
In a risk-off environment, the opposite happens. Investors flee riskier assets, such as stocks, and buy safe-haven assets, such as the U.S. dollar, the Swiss franc, bonds, or the Japanese yen.
Inverse Correlations
As the name suggests, an inverse correlation is the opposite of a direct one. Inverse correlations play a role in portfolio management because they allow traders to implement various hedging strategies—more about that later in the article.
Just like direct correlations, inverse ones have various correlation degrees. For example, a 100% correlation degree means that two financial assets move in locked steps in opposite directions.
A perfect example of an inverse correlation is the one between the EUR/USD and the USD/CHF when the Swiss National Bank (SNB) defended the 1.20 level on the EUR/CHF cross.
EUR/USD and USD/CHF
In September 2011, the SNB decided that the Swiss franc was extremely overvalued. Consequently, on September 6, it announced that it imposed a 1.20 minimum exchange rate for the EUR/CHF pair.
The argument was that the higher CHF carried a risk of deflationary development, so the central bank decided it would not tolerate such a thing anymore. Hence, the 1.20 floor became effective immediately, and the news created a bounce on the EUR/CHF pair.
The 1.20 became the de-facto level for the 100% inverse correlation between the EUR/USD and the USD/CHF for traders watching correlations. Because the EUR/USD pair is the most popular one among retail traders, and not only suddenly, traders had something to work with; the closer the EUR/CHF cross came to the 1.20 level, the closer the inverse correlation came to 100%.
In other words, trading the EUR/USD or the USD/CHF pairs was similar. Shorting one and buying the other should have yielded similar results if the EUR/CHF cross sat close to 1.20.
It all worked well for several years—4 years, more precisely. At the start of 2015, the SNB realized it was no longer viable to fight the trend and announced that it would drop the 1.20 peg on the EUR/CHF pair.
What followed was for the history books because the FX market took a hit, and so did other correlated assets.
The EUR/CHF exchange rate effectively disappeared from brokers’ quotations. There was no rate to be seen for several minutes. By the time the first quotes appeared, the EUR/CHF was below 0.9, as huge stops were triggered along the way.
This was an important lesson to remember: correlations hold until they don’t anymore.
Illustrating an Inverse Correlation
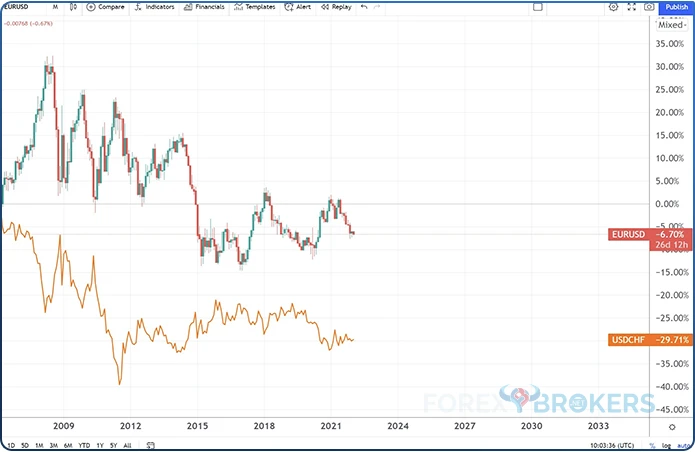
The easiest way to understand an inverse correlation is to look at one. Below, you have the EUR/USD and the USD/CHF monthly chart showing the two exchange rates since the 2008 Great Financial Crisis.
While the correlation is obvious, we notice how the correlation degree changed in 2015 after the SNB dropped the EUR/CHF peg. In other words, the correlation weakened after that, and it was close to 100% during the peg.
The chart also helps explain how easy it is to overtrade if the trader does not understand correlations. Because of the tight inverse correlation, trading the two currency pairs was straightforward—initiating a short position on the USD/CHF was the equivalent of initiating a long position on the EUR/USD. The opposite was also true—a long USD/CHF position was the equivalent of a short EUR/USD.
Therefore, despite the technical or fundamental setup, going long EUR/USD and long USD/CHF would not make sense. Because algorithmic trading mainly influences financial markets, the two currency pairs would be traded only on their correlation degree.
After 2015, the correlation changed. We see that the two currency pairs even moved in similar directions for a while as the EUR/CHF cross recovered all the lost ground and some more. Also, the rise in the EUR/USD pair following Emmanuel Macron’s election in 2017 was not followed by a similar decline in the USD/CHF pair because the degree of correlation changed.
Hedging with Correlations
Hedging is a controversial trading strategy. Perceived as risky, it is forbidden in some jurisdictions, such as the United States.
It refers to taking two opposite trades. Full hedging takes place when selling and buying the same asset using a similar volume. For example, a trader may decide to buy 0.1 lots EUR/USD and sell 0.1 lots EUR/USD at the same time. Why would anyone be interested in such a strategy?
For example, the trader executes different strategies on different time frames and has a different time horizon for the trades. To illustrate, imagine the EUR/USD short trade is from an analysis of a larger time frame, while the long trade is from an analysis of a smaller time frame. Therefore, the trader has both bullish and bearish opinions; only the time horizon for the trades differs.
But hedging comes at some costs. The brokerage house charges a commission for the open positions kept overnight in the form of a swap. Swaps may be positive or negative, but they are mostly negative. Therefore, even with a fully hedged position, the trading account incurs some costs over time.
Hedging may also be direct or indirect. The example above illustrates a direct hedging strategy, but an indirect one may be applied when using correlations.
Indirect hedging may make sense if the swaps are attractive and the time horizon is long enough to justify it. Being long USD/CHF and short EUR/USD would be an indirect hedge—the correlation is not 100%, but they still do move in opposite directions. However, traders should choose the latter between shorting the EUR/USD or being long USD/CHF because the swap costs are smaller at most brokers.
Interest Rates and Other Monetary Policy Decisions Affect Correlations
Correlations are temporary because of changes in monetary policy. Central banks react to different economic cycles by easing or tightening their monetary policy.
For example, the response to the COVID-19 pandemic was to lower the interest rates to 0 or even below 0 and engage in unconventional monetary policy measures, such as quantitative easing. Quantitative easing is the process of central banks buying government bonds, leading to higher stock market prices. The inverse relationship between the price of a bond and its yield means that the bond-buying program made bonds unattractive because it depressed the yields.
As such, investors looking for higher yields redirect their capital into riskier assets, such as the stock market. A rising stock market typically triggers a risk-on move when the Japanese yen declines and investors sell the U.S. dollar.
We may say that interest rates and monetary policy decisions affect correlations because changes in monetary policy generate changes in how financial assets perform.
Correlations in the International Arena
Financial markets are full of correlations between different assets. So far, we have mostly discussed correlations in the FX market between various currency pairs. However, other correlations exist between markets that have little in common.
The following section of this article covers the most important ones, such as:
- correlations in the equity markets
- gold and the U.S. 10-year yield
- the direct correlation between oil and risk-on environments
- oil and inflation and why they are directly correlated
- gold and inflation
- U.S. interest rates and emerging-market currencies and equities
Equities
The global equity market is expanding continuously. Economies are categorized as developed, emerging, developing, and frontier based on their economic development. As such, equity market indices reflect the state of the local economies, but they are also correlated in the international arena.
Consider the United States equity market. The United States has the largest equity market in the world, as companies from around the world list their shares in America to access American capital.
Because of this, most of the time, the U.S. equity market indices such as the S&P 500 or the Dow Jones lead other stock markets in similar economies (i.e., developed). As such, if the stock market in the United States ends the day in positive territory, the European stock market will open in green the next day. Rarely will European stocks diverge from what U.S. stocks are doing. Therefore, a good lesson to know is that equity market indices within the same markets are correlated.
More precisely, stock market indices in developed markets are correlated, the ones in emerging markets are correlated as well, and so on. But correlations extend to sectors and subsectors, too.
For example, if a company in the cannabis industry reports outstanding financial performance over a quarter and the stock price advances, the move triggers similar reactions in other similar stocks. Because investors expect a solid financial performance from other companies, too, they will buy the stocks of the company’s peers.
Gold and the U.S. 10-Year Real Rates
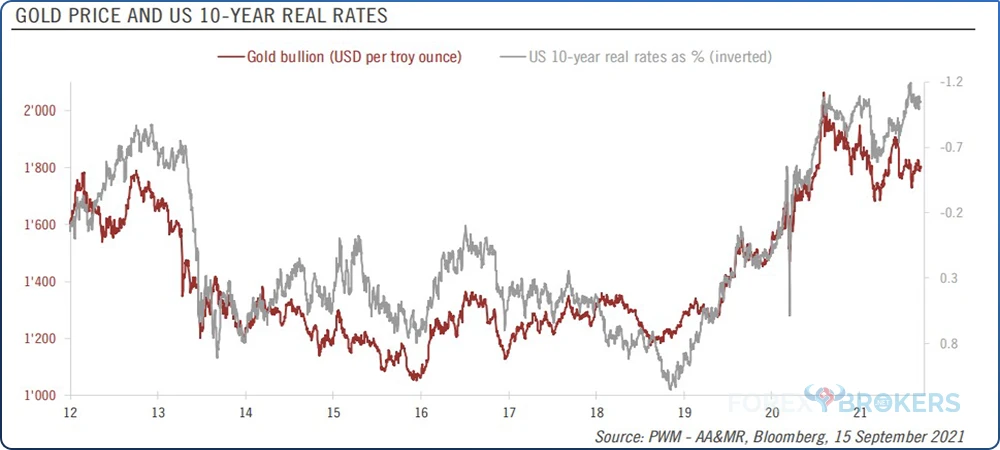
The price of gold and the U.S. 10-year real rates have an inverse correlation. In other words, a move higher in the price of gold triggers a move lower in the real rates. Or, more likely, a decline in real rates triggers a move higher in the price of gold.
But first, what are real rates? Real rates refer to yields less than the inflation rate. For example, if the 10-year yield is 2% and the inflation rate is 4%, the real rate is ˗2%. More precisely, it reflects the return of a bond adjusted for inflation.
At the start of the COVID-19 pandemic, the Federal Reserve of the United States initiated a massive monetary easing program. As part of it, it opened U.S. dollar–denominated swap lines with other central banks in the world, triggering a sharp move lower in the greenback.
As such, the price of gold, denominated in U.S. dollars, reached a new all-time high. It traded for the first time above $2,000 as inflation fears gripped investors. After all, the Federal Reserve has printed more dollars than ever during the pandemic.
Another thing that the Fed did was to engage in quantitative easing again. It started buying bonds, triggering a sharp decline in yields. As yields fell, the price of gold advanced, as the inverse correlation once again held.
This is one of the strongest correlations in financial markets, and it is often viewed as the reason why the price of gold remains depressed. For example, even if inflation rose to a 4-decade high in the United States during the COVID-19 pandemic, the gold price fell from its record-high levels.
Oil and Risk-On/Risk-Off Environments
Market participants often view oil as the key to the market’s volatility. This is because a sharp move in oil price is enough to trigger a risk-on or risk-off movement in financial markets.
While the world has increased its efforts to transition to greener energy, oil is still the key element of the energy complex. Humankind consumes more energy year after year, and the solution is not to consume less but to produce more. Unfortunately, using oil for our energy needs leads to increased CO2 emissions.
It is predicted that new technologies will ultimately make the transition possible, such as improvements in the electric vehicles market, solar energy production, and others. However, until oil is phased out of the energy complex, many decades lie ahead as regards the shift toward green energy.
As such, the price of oil plays a critical role in financial markets because it says much about the global economy. For instance, think of the COVID-19 pandemic that started in 2020.
By the time it became obvious that an economic recession lay ahead, the price of oil had already dropped. Because there was no demand for stored oil, the law of supply and demand led to the price of oil crashing closer and closer to 0.
Oil is a commodity mainly traded via futures contracts in the derivatives market. Such contracts settle daily. For the first time ever, the clearinghouse allowed the oil price to settle in negative territory. Once below 0, oil closed the day close to ˗$40, one of the most incredible market moves ever.
It has become obvious that a recession is just around the corner by now. When there is no demand for oil, goods aren’t moving, and the global economy is halted. Moreover, recessions trigger a risk-off environment in financial markets, characterized by the world’s reserve currency gaining against its peers and declining equity markets in the developed world.
The opposite happens when the price of oil trends higher—a risk-on environment is born this way, characterized by higher equity prices and a declining U.S. dollar.
Interpreting the WTI Crude Oil Chart
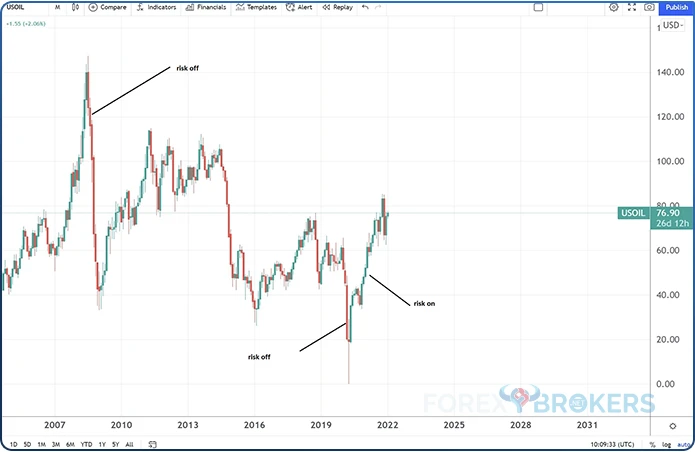
The chart below shows the WTI crude oil on a monthly time frame. Each candlestick represents 1 month, and before the 2008–2009 Great Financial Crisis, the price of oil traded well above $140.
It is well known that this was a period of economic expansion, of economic boom, as the world economies recovered sharply after the tech bust in early 2000. However, a new economic recession was triggered by the housing crisis in the United States, so the price of oil confirmed it. A risk-off environment followed, and only the Federal Reserve’s interventions led to the financial system healing.
Other risk-off/risk-on moves are visible on the chart, illustrating the strong correlation between the price of oil and financial markets.
Oil and Inflation
Another interesting correlation is the one between the price of oil and inflation. This is interesting because one is a commodity, and the other one is an economic indicator.
Oil prices depend on consumption; thus, supply and demand imbalances trigger sharp movements. Meanwhile, inflation shows changes in the prices of goods and services over a certain period—months or years.
Higher oil prices almost always accompanied periods of rising inflation or vice versa—rising oil prices have always led to higher inflation. This is an important correlation for financial markets because central banks have price stability as the pillar of their mandate.
Price stability refers to inflation rising in a controlled way. Inflation levels close to 0 are dangerous because of the threat of deflation gripping the economy. Economists agreed that 2% is close enough to the definition of price stability and are determined to act should inflation deviate from the target.
Because of this tight correlation, financial market participants try to anticipate the central banks’ decisions and act in advance. For example, sharply higher oil prices are expected to trigger higher inflation and therefore a hawkish response from the central banks.
Indeed, this is precisely what happened during the COVID-19 pandemic.
As mentioned earlier in the article, oil prices declined and settled into negative territory. But oil bounced strongly from the lows, triggering a risk-on environment and higher inflation.
Many central banks viewed inflation as transitory, but even though they are proven right in the end, it is difficult to explain to households why the prices of goods and services have increased at the fastest pace in 4 decades. As a result, some traders decided to take the other side of the trade and bet on the Federal Reserve, raising rates and tightening the monetary policy sooner. Therefore, the U.S. dollar gained against its peers.
Gold and Inflation
Inflation is a concept difficult to understand by the advanced economies’ population because it has been missing for decades. For instance, Japan has had trouble creating inflation for several decades. Also, the European Central Bank has had problems bringing inflation to its 2% target despite holding the deposit facility rate in negative territory for years before the COVID-19 pandemic.
As such, inflation is often misunderstood in advanced economies. This is not the case with emerging, developing, and frontier markets. Here, inflation often exceeds double-digit levels, so households and investors alike look for refuge in financial assets viewed as hedges against inflation.
Gold is one of them.
Because people living in economies other than advanced ones feared inflation, they turned to traditional stores of value, such as gold. In the Middle East and India, gold plays a key role in society. In Eastern Europe, after the fall of communism, inflation ravaged economies, and people lost trust in fiat currency. As a result, they often turned to gold to protect their savings.
Therefore, the price of gold and inflation should move hand in hand. But this is not 100% true, as it depends on expectations.
To exemplify, gold may have failed the U.S. investor during the COVID-19 pandemic—its price peaked above $2,000 and then fell below $1,700 while inflation kept increasing. But gold, even with this correction, kept its value, while in other parts of the world, such as Turkey or Argentina, local currencies declined more than 30% YoY.
U.S. Interest Rates and Emerging-Market Currencies and Equities
As we come close to the end of the article, there is one more correlation to consider—the one between U.S. interest rates and emerging-market currencies and equities. There is an inverse relationship between the two—when interest rates in the U.S. are rising, emerging-market currencies decline; when interest rates in the U.S. decline, emerging-market currencies are in demand.
The explanation comes from the trade deficit in emerging economies. When an economy imports more than it exports, it runs a trade deficit and needs to finance it by borrowing from financial markets. The problem is that most of the international financing is in U.S. dollars.
Because any loan is an economic burden that needs to be paid eventually, rising interest rates in the U.S. trigger a sharply higher U.S. dollar against emerging-market currencies. Emerging economies need to pay back the loans in dollars, not in local currency; thus, there is less demand for the local currency.
Conclusion
The better and broader the trader’s understanding of financial markets, the higher their success in investing. Correlations reflect how various financial market assets move together in the complexity of the financial system.
Correlations are not black and white and are seldom straightforward; they work until they adapt to new market conditions, monetary policy decisions, and so on. One thing is certain, though—correlations cannot be ignored.
In this article, we covered most of the ones deserving attention. Some others exist, and many will appear in the years ahead. Financial trading correlated markets are on a constant move because they change.
Financial markets are interconnected, and what happens in one part of the world or with one financial asset may affect other parts of the world and other markets. As such, understanding correlations is vital for success in financial markets.


