
302
Andrews' Pitchfork is a technical analysis tool used mostly by trend-following traders. The tool uses three parallel lines, called pivots, to project support and resistance levels. Also, the line in the middle, the so-called ML or Median Line, attracts the price.
The standard way of trading with Andrew's Pitchfork was already presented in this trading academy in a previous article. This article, however, goes one step further and combines Andrews' Pitchfork with the Elliott Waves Theory Therefore, reviewing the basics of Andrews' Pitchfork is useful before moving forward with the concepts presented in this article.
The Elliott Waves Theory was the subject of numerous articles in this trading academy. And, for a good reason, it is one complex trading theory despite being developed long ago.
In this article, we will combine everything discussed so far on Andrews' Pitchfork and the Elliott Waves Theory in such a way as to use them both in the same analysis.
We will start with a short review of Andrews' Pitchfork and the Elliott Waves Theory, followed by a separate example of how to use them individually. Next, the article moves forward by presenting a step-by-step integration system of the two and the purpose of doing so.
At the end of the article, the reader will know how to make the most of the combined system and project future market movements. In doing so, we will use as many visual examples as possible to make it easier for the trader to grasp the concepts presented fully.
The Basics of Andrews' Pitchfork – A Review
Andrews' Pitchfork is a technical analysis tool found in all trading platforms. Nowadays, it is easy to use chart tools because computers make it easier to do advanced technical analysis studies.
At the tool's core are three pivots: P0, P1, and P2. Each pivot is the starting point of a line and the three lines are parallel.
The line in the middle called the Median Line, or simply ML, is the most important one because it is said that it "attracts" price. The other two lines are the Upper Median Line, or UML, and the Lower Median Line or LML. Naturally, the names come from the fact that they are projected above or below the ML.
Drawing the tool on a chart is fairly easy. All you need to do as a technical analyst is to find Andrew's Pitchfork tool in the trading platform and click on the chart three times. Each click represents the pivot point, starting with P0. After the three pivots are deployed, the three parallel lines make the Pitchfork appear on the chart.
The big controversy with Andrews' Pitchfork comes from the pivot points. Where to place the pivots?
Only by changing one pivot does the trading tool show a different picture. Therefore, finding the proper place for the tool to make sense is challenging.
This is where the Elliott Waves theory comes in and fixes the issue. Elliott Waves is based on a set of rules that leave little room for error.
More precisely, it gives each market wave's exact end and beginning. Therefore, by integrating the Elliott Waves analysis with Andrews' Pitchfork, one can form an educated guess regarding the future market direction. Also, the Elliott Waves theory answers the question of where to place the three pivot points.
A Short Review of the Elliott Waves Theory
Ralph N. Elliott developed the Elliott Waves theory in the 1930s. He studied the stock market and devised different patterns to predict future market behavior.
Elliott noticed that the market advances or declines, forming impulsive or corrective structures. The latter also appears when the market consolidates.
According to the theory, an impulsive wave always has five segments, out of which at least one is extended, meaning that it is longer than 161.8% of the next longest wave. Sometimes, an impulsive wave may be double extended, meaning that the market quickly advances or declines.
Impulsive waves, therefore, appear in bullish and bearish trends. But so do corrective waves.
Elliott found way more corrective waves than impulsive ones. For this reason, there are many types of corrective waves, although they all fit into just two categories – simple or complex. The complex corrective waves further subdivide into ones with small x-waves and large x-waves. The x-wave is always an intervening segment that connects parts of a correction.
Only corrections with a small x-wave do trend. The other ones, with a large x-wave, form horizontal consolidations.
Another thing that would help later in the article is labelling various waves. Elliott used numbers to label impulsive waves and letters for corrective waves.
Impulsive waves go up to the number 5, and corrective waves up to the letter E. But, of course, the X is special, as it belongs to the connecting x-wave.
It means that if you end up seeing an Elliott Waves analysis using more numbers than it should or different letters, it is not based on the original work of Ralph N. Elliott.
How to Use Andrews' Pitchfork – Example
We have already treated the subject in a separate article part of this trading academy. However, for the sake of reviewing the basics and preparing for the integration of the two theories, it is worth discussing one example.
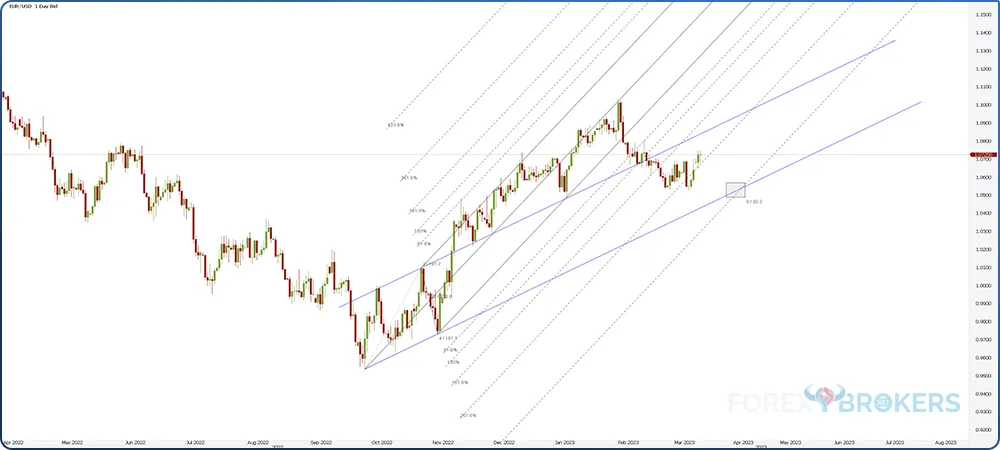
Below, you can find the recent EUR/USD daily timeframe. It shows how the market bounced from the lows in October 2022 and rallied over one thousand pips.

The three continuous lines represent Pitchfork's elements – the UML, the ML, and the LML. The other lines are derived from the Pitchfork, representing dynamic support or resistance at Fibonacci levels projected above or below the Pitchfork.
The idea behind trading with Andrews' Pitchfork is to find future support and resistance levels. Also, the technical tool helps in spotting the end of trending conditions.
Key to Andrew's Pitchfork is the choice of the three pivots. The best way to choose the pivots is to use the series of lower lows and lower highs (in a bearish trend) or higher highs and higher lows (in a bullish trend).
Using Trending Conditions to Draw the Pitchfork
Based on the above, the right way to draw the Pitchfork is to focus on the price action at the bottom of the bearish trend. We see that the market bounced, broke above the last lower high, but then failed to make a new lower low. Instead, it formed two higher highs and two higher lows. Therefore, reversal conditions are in place.
P0 should be at the bottom of the bearish trend, P1 at the first higher high, and P2 at the second higher low. This way, the projected UML, ML, and LML will offer dynamic support and resistance in the future. Also, the ML attracts the price action.
Dynamic support and resistance levels are far more difficult to break than horizontal ones. As it can be observed from the chart above, the market breaks below dynamic support given by the ML, but then meets dynamic resistance at the same line while making a new higher high.
Using the Schiff Line to Spot Trend Reversals
Another way to use Andrew's Pitchfork is to find trend reversals with the Schiff line. This is a line drawn from P0 to P2 and projected on the right side of the chart – shown above in blue.

This line's role is to outline the trend. In this case, the bias for the EUR/USD remains bullish as long as the price action stays above the Schiff line. A break below invalidates the bullish case, and a new Pitchfork needs to be drawn – this time, a bearish one.
Some traders also use the Schiff line to find out when a trend is losing momentum. The thing to do is to project the Schiff line on top of the P1. If the bullish momentum weakens, then the first thing that the market will do is to drop below the projected Schiff line. For conservative traders, this is the time to exit the long trade.
Under this approach, long traders could have gained 600 pips (the distance from 1.01 to 1.07). The entry on the long trade is around 1.01 when the market exceeds the previous higher high, and the exit is when the market breaks below the projected Schiff line, or 1.07.
Elliott Waves Theory – Example
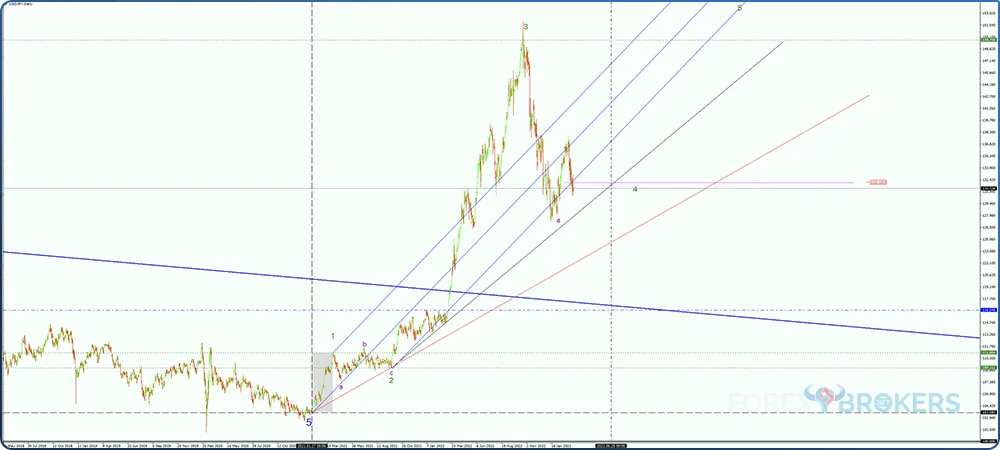
Our Elliott Waves example is the USD/JPY price action since the start of 2021. It has been one of the most powerful trends in the currency market that changed how the Japanese yen acted before.
Financial markets often move based on how risk is perceived. Risk-on means that the sentiment is bullish for stocks but also for the euro, the Australian dollar, or the New Zealand dollar. On the contrary, risk-off means that uncertainty reigns. This is because investors are afraid to take risks, sell their stocks, and buy something else perceived as offering safety.
These are currencies such as the Japanese yen, the Swiss franc, or the US dollar in the currency market. If anyone paid attention, the US dollar is the currency that appreciated the most against its peers in times of a major crisis.
Returning to the USD/JPY, it started trending higher at the start of 2021. Slowly but surely, the market moved several hundred pips, climbing from 103 to 111 in what seems to be a five-wave structure.
The move is labeled with wave 1 in green on the chart below. Also, it is marked with a grey shape to consider the time element needed when trading the 5th wave later.

The impulsive wave took 52 days. Next, from the top of wave 1, a correction started. The market dropped more than 300 pips in a move that might have been perceived as the 2nd wave in green. By the way, using colors when labeling the waves helps keep track of the various cycles considered. In this case, wave A in purple is the first corrective phase of the 2nd wave in green.
Interpreting the Second Wave
The second wave is made of an a-b-c in purple. Because the number 2 in green is placed at the end of the a-b-c structure, the entire correction for the second wave is simple.
In order for a correction to be simple and not complex, the price action following should respect two rules:
- It should fully retrace the c-wave in less or the same time it took the market to form the c-wave
- It should also break a trendline connecting the start of the a-b-c with the b-wave. This is called the 0-b trendline, and it should be broken by the price action that follows the simple correction in less than the time it took the market to form the c-wave.
Only if these two conditions are met the second wave is a simple correction. In our example, they are met, which is why the second wave is placed where it is.
Another thing to consider when interpreting the second wave is the time element. In an impulsive wave where the third wave extends, like it is the case here, the second wave takes about the same time it took the first wave to form, or twice as that. In our example, the second wave took twice the time to form than the first wave.
One more thing to mention here. A close look at the c-wave in the a-b-c structure reveals that there is no five-wave pattern visible. However, the c-wave of a flat pattern must be impulsive as the second wave is flat. But because there is no visible five-wave structure, the c-wave is not a classic impulsive wave but a terminal one.
A terminal impulsive wave must be fully retraced by the price action that followed in less than 25% or 50% of the time it took it to form. This condition is also respected by the price action.
Finally, the a-b-c structure that makes up the second wave is a flat pattern. What type is it? Because the b-wave retraces more than wave A's length, this is flat with a strong b-wave, called an irregular failure.
Failures signal countertrend strength. Hence, the failure signalled a strong upside move as the flat was a bearish, corrective pattern. Therefore, judging by all of these arguments, it is fair to assume that the second wave ended where it is marked on the chart and that is the place where the third wave started from.
Interpreting the Third Wave
In an impulsive wave with a 3d wave extension, the 3rd wave must be the longest in the structure. The minimum distance for the wave to travel is 161.8% of the next longest wave between the 1st and the 5th.
Because at the time of the Elliott Wave count, the 5th wave is unknown, the minimum distance applies to the 1st wave. However, there is a catch. The minimum distance does not mean that the end of it means the end of the 3rd wave. This is just to confirm that the 3rd wave extends.
In reality, the 3rd wave is much longer. It often exceeds three times the length of the 1st wave and sometimes is even longer.
Right after the end of the 2nd wave, the market rallied and found horizontal resistance below the 116 area. It took the market 120 days to consolidate, and by the end of the consolidation, the year 2022 arrived.
We all know by now what happened in February 2022 – Russia invaded Ukraine. The war in Eastern Europe should have triggered a risk-off move, as described earlier in the article.
It did; only the Japanese yen decoupled from it. In fact, it was around this time when the USD/JPY exchange rate surpassed the 116 resistance. It did not look back ever since.
The rally was so powerful that the exchange rate climbed all the way to 145 before the Bank of Japan intervened in the FX market. It was not content with the fast depreciation of the local currency when the central bank was the main driver of the move.
The explanation comes from what happened in the rest of the world with interest rates. After the COVID-19 pandemic, inflation started to rise globally. It had reached advanced economies, so central banks from the United States to the European Central Bank began a tightening cycle.
They raised the rates several times, making their currencies attractive to investors. But the Bank of Japan chose to do just the opposite – it eased the policy further, adopting a yield curve control approach.
As such, the interest rate differential favored other currencies against the JPY. Therefore, the higher USD/JPY exchange rate can be fundamentally explained.
What Did the Bank of Japan Do to Stop the Rally?
The Bank of Japan intervened directly in the FX market for the first time in more than two decades. It did so when the USD/JPY exchange rate traded in the 145 area, and it directly sold US dollars to buy Japanese yen.
The trick worked, as the exchange rate dropped several hundred pips immediately. But history tells us that interventions rarely work. They are costly for central banks, but they rarely work.
As such, the exchange rate climbed again, exceeding the 145 area as a short squeeze began. However, the new rally did not end until above 150, when the Bank of Japan intervened again, this time with more determination.
It was enough to scare bulls, and the exchange rate corrected. We can call the entire move from the end of the 2nd wave until the 150 area as the 3rd wave, the extended one, of the overall 1-2-3-4-5 structure.
So what to expect for the 4th wave?
What to Expect for the Fourth Wave?
The Elliott Wave trader should first use a Fibonacci retracement tool and measure the length of the previous 3rd wave. Next, find the 23.6% and the 38.2% levels, as those are the levels where the 4th wave might end.
According to the principle of alternation, the 4th and the 2nd waves must differ. For example, they should have different lengths or be different in the time it took them to form or to have a different structure. If any one of these features is present, it is enough to validate the principle of alternation.
The 4th wave should not enter the 2nd wave's territory, as overlapping is not allowed in a classic impulsive wave. By overlapping, it means that the 4th wave price action should not enter the 2nd wave territory.
The 4th wave is either a simple or a complex correction, and in both cases, wave a can be either an impulsive wave part of a zigzag or a corrective wave part of a flat or a triangle. In our example, the price action from the end of the 3rd wave until the end of wave green does not look impulsive. Hence, it can only be wave a of a corrective pattern – simple or complex.
Most likely, the 4th wave will end up being a contracting triangle. Different types of contracting triangles exist, such as horizontal, irregular, or running. Judging by wave A's structure, the chances favor a horizontal contracting triangle for the 4th wave, with the longest wave being wave A and all the subsequent segments being shorter than the previous one.
Drawing Trendlines to Help Future Labeling
Trendlines are important tools when counting waves. In particular, two trendlines should be used: the 0-2 and the 2-4 trendlines.
Effectively, the trader should draw one trendline from the start of the impulsive wave through the end of the 2nd wave and project it further on the right side of the screen. On the chart above, the 0-2 trendline is shown in red.
The 2-4 trendline connects the end of the 2nd wave with the end of the 4th wave. Both lines are equally important in deciding whether the market move is impulsive.
The rule says that no parts of the 1st or the 3rd waves should pierce the 0-2 trendline. Also, no parts of the 3rd wave can pierce the 2-4 trendline. The potential impulsive move on the USD/JPY daily chart respects both rules.
Why are these trendlines important? Focus on the 2-4 trendline and the way it is drawn on the chart. Because the 4th wave is incomplete, we do not know the end of it; thus, we cannot correctly draw the 2-4 trendline. However, we can use the rules of the trendline in an impulsive wave to calculate the minimum amount of time it will take the 4th wave to form.
Because no part of the 3rd wave can pierce the 2-4 trendline, the 4th wave will not complete until the price action takes long enough to exceed the potential 2-4 trendline as drawn above.
What to Expect for the Fifth Wave?
Depending on the 3rd wave's length, we already have an estimated guess about how the 5th wave would look once the 4th wave ends. It should be about 61.8% of the entire distance that the market traveled from the start of the impulsive wave until the end of the 3rd wave. Also, it should relate to the 1st wave in time, as either 61.8%, 100%, or 161.8% of it.
As always, the 5th wave can be classic or terminal. If it is terminal, the price action during the 5th wave will pierce the 2-4 trendline. If not, it means that the 5th wave is a classic impulsive wave.
What Would Invalidate the Impulsive Wave Scenario?
Everything written so far on the Elliott Waves scenario is just that – a scenario. No one really knows what will happen next.
However, this scenario respects, at least so far, all the rules of a classic impulsive move. But what would invalidate it?
Several things come to mind. For example, if the market rallies and makes a new high before the price reaches the 2-4 trendline, it means that the impulsive wave is invalidated or incomplete.
Or if the USD/JPY retracement continues well below 50% or more of the 3rd wave, as this is not usually happening in a classic impulsive wave. When counting the market using the Elliott Waves Theory, look for all the details to be respected. The more you spend time with the charts, the more likely it is to put everything together for a complete analysis and to gain confidence in your next forecast.
Integrating Andrews' Pitchfork with the Elliott Waves Theory
This part of the article deals with integrating the two concepts –Andrews' Pitchfork and the Elliott Waves Theory. Without a clear description of the Elliott Waves scenario, it would have been impossible to understand how the two work together.
If we refer back to Andrews' Pitchfork, we know that placing the pivots is the most challenging part. The Elliott Waves Theory offers a simple solution, yet an effective one, to this issue.
The secret is to use the start of a new wave and the upcoming labeling for placing the three pivots. As such, in an impulsive wave, the three pivots should be placed at the start of the impulsive move, at the end of the 1st wave, and at the end of the 2nd wave.
Or, in a corrective pattern, the three pivots should be placed at the start of wave A, at the end of wave B, and at the end of wave C. Every corrective pattern, simple or complex, starts with an a-b-c structure. The first a-b-c structure is the one to use and not any other in a potential complex correction.
The interpretation is the same in both cases, so we will use only an impulsive wave to illustrate the role of the Andrews' Pitchfork. The same principles apply to a corrective wave, too.
Integrating Andrews' Pitchfork with an Impulsive Wave
The chart below shows the USD/JPY Elliott Waves scenario explained earlier. On top of that, there are three parallel lines shown in blue.
These lines are Andrews' Pitchfork's lines – the UML, the ML, and the LML. The UML starts from the end of the 1st wave, the ML from the start of the impulsive wave, and the LML from the end of the 2nd wave.
Remember that the three lines should offer dynamic support or resistance during the waves' formation. Naturally, we can interpret Andrews' Pitchfork only after the 2nd wave completes.
Looking at the price action following the 2nd wave, we notice that the LML offers strong dynamic support during the consolidation below the 116 area, which was the breakout zone in 2022.
Next, the UML offers dynamic resistance for the first time when the price action trades above 130. Then resistance turns into support as a wave of selling sent the market from 140 to 130, only to be rejected by dynamic support at the UML.
After the two Bank of England's interventions, the UML support gave wave, and the line acted as resistance. The ML fulfilled its role of attracting the price action. It acted as support and resistance as we see that the current market move, the decline from about 137 to the recent lows, started on dynamic resistance at UML and is currently struggling to break dynamic support at LML.
How about the Schiff line? In this case, the 0-2 trendline from the Elliott Waves Theory is the same as the Schiff line. Therefore, it fulfills the same role of invalidating the persisting bullish bias.
So what should happen next?
If the impulsive wave is correct, then the 4th wave should still consolidate for a few months until the price action exceeds the current positioning of the 2-4 trendline. That should happen while the price action remains below the LML.
Next, the focus shifts to the 5th wave. On its way up, the price action should find strong resistance at the LML but most likely will not even touch it. In other words, all of the price action should remain below Andrews' Pitchfork once the 5th wave starts.
Finally, by the time the impulsive wave ends, the focus shifts to the Schiff line, as it tells if it was the end of a flat pattern or it is just the beginning of a new structure.
Conclusion
The Elliott Waves theory looks at markets from a special perspective. By dividing the market moves into impulsive or corrective, Elliott has developed one of the most complex trading theories ever created.
Despite being born many decades ago and used on the stock market, the theory is widely used in all financial markets today. Traders appreciate the sound set of rules that leave little or no room for error should the behavioural biases are overcome.
This is why the Elliott Waves theory serves as a foundation for trading with Andrews' Pitchfork. By using the start of a new wave as the place for the pivots, it solves one of the greatest controversies Andrews' Pitchfork had.
When used independently, placing the pivots was always subject to interpretation. But the Elliott Waves brings clarity and shows the potential future path for the price action as the median line attracts it.
This article should be viewed as complementing all the Elliott Waves articles part of this trading academy and the one introducing Andrews' Pitchfork. By using the two concepts together, the idea is to bring more clarity to financial markets and to offer a way to solve for the correct places of the three pivots belonging to the Andrews' Pitchfork.
The Elliott Waves theory helps identify the end of a market move and the start of a new one. By integrating the two concepts, traders find the three points to place the pivots for the corresponding Andrews' Pitchfork. From that moment on, the focus shifts to the median line and its ability to attract price. Also, trading the Andrews' Pitchfork using the Elliott Waves concept offers a more rigorous approach than the original version.
Related Lessons


See more from this category