
302
This trading academy has covered the most important theories and concepts, both old and new ones. It would be incomplete without mentioning the work of W.D. Gann.
His work in technical analysis is often viewed as difficult to understand. But his performance when trading financial markets leaves no doubt that his methods of trading and interpreting markets are worthwhile reading.
He was, above all, a speculator. Gann dedicated years of his life trying to prove that there is a difference between gambling and speculation. He strongly believed that successful speculation is possible and has nothing to do with gambling.
One should put into context the time when Gan was an actual trader (early 1900s). Financial markets evolved since then, and some of the concepts introduced by Gann do not work the same in different markets.
The reader may not have heard of Gann's name, but some of the trading tools integrated into various trading platforms bear his name. For example, MetaTrader, the most popular trading platform for retail traders, offers a distinct set of Gann tools: Gann Fan, Gann Line, and Gann Grid.
Gann left a vast legacy in technical analysis, such as the Gann wheel, the Gann emblem, and how to interpret time by degree. Also, he was a big fan of astrology and how planetary movements influence human behavior. Thus, he considered it useful in finding turning points in financial markets.
This article presents the trader W.D. Gann, his work, and some trading tools he developed that can be used today. For a deeper understanding of Gann's complex work, the reader should refer to the books he wrote and to the vast collection of literature that followed from people trying to unlock Gann's way of trading.
Who Was W.D. Gann?
W.D. Gann was born in Texas, the United States, in 1878. He started trading in the early 1900 and used various approaches, new at the time, such as ancient mathematics, geometry and astrology.
He traded both the stock and commodity markets and became famous for predicting market prices well before the market reached them. As such, others tried to find the secret of Gann's work to apply his knowledge in financial markets.
At the time, technical analysis was quasi-non-existent. For example, Gann began trading way before the Elliott Waves Theory was presented by Ralph Elliott.
Besides being a trader, Gann was a writer. He wrote mostly about financial markets but also about religion.
The problem with Gann's writing is that he used an indirect style of writing, thus making it difficult for readers to understand what he wanted to say. Also, it is believed that he used different names and pseudonyms to publish some books. Moreover, it is also believed that some of the books he published, unrelated to trading and the financial world, contain some messages or keys to his technical analysis work.
None of these has ever been confirmed. Gann also sold trading courses which he developed.
Why Is Gann Famous?
Gann is famous for his trading methodology. However, everything he did remained a mystery as he had a confusing way of presenting things.
The few tools that are used today are part of the technical analysis platforms of our century. Most of them are already integrated into the most popular trading platforms of our day, such as the MetaTrader or the JForex: Gann Line, Gann Fan, and Gann Grid.
Some other ones are more enigmatic and difficult to use, but nevertheless, they do exist, such as the Gann Wheel, based on the square of 9. Also, Gann angles are used by traders to find dynamic support and resistance.
His words are often difficult to understand despite trying hard to leave his work to future generations of traders and investors. Moreover, he wrote numerous books, but not all of them about trading and investing.
In fact, some are science fiction books, but even in those books, some say that there is some sound advice for speculators. In any case, the following part of this article presents the three most important books he wrote about investing and speculating, together with the Amazon links where one can find them.
He used an indirect way of writing, which made his books difficult to follow. However, as mentioned earlier, some people suggest that he did it on purpose to conceal his methods.
Books Written
According to Wikipedia, the following books were written by Gann:
- Speculation A Profitable Profession (1910)
- Truth of The Stock Tape (1923)
- Tunnel Thru The Air (1927)
- Wall Street Stock Selector (1930)
- New Stock Trend Detector (1936)
- Face Facts America (1940)
- How to Make Profits in Commodities (1941)
- How to Make Profits Trading In Put And Call (1941)
- 45 Years in Wall Street (1949)
- The Magic Word (1950)
- WD Gann Economic Forecaster (1954)
- The Ancient Science of Numbers (1908) by Luo Clement
- Astrology and Stock Market Forecasting (1937) by Louise McWhirter
The last two books are believed to be written by Gann under a pseudonym and this is why they are listed above. In any case, his controversial work led to many trying to discover his true methods. As such, here is a list of books where Gann's work can be found:
- The Law of Vibration: The Revelation of William D. Gann – 2013, Plummer, Tony
- Forecasting Profits Using Price & Time – 1998, Gately, Edward
- Gann Simplified – 2001, Droke, Clif
- W.D. Gann: Divination by Mathematics – 2013, Awodele
- Stock and Commodity Traders' Handbook of Trend Determination – 1940, Bayer, George
- Planetary Harmonics of Speculative Markets – 1996, Pesavento, Larry
- Analytical Methods for Successful Speculation – 1986, Schilgen, James E.
- Pattern, Price and Time: Using Gann Theory in Technical Analysis – 2009, Hyerczyk, James A.
- Predicting Market Trends with Periodic Number Cycles – 1982, Futia, Carl A.
- Trading Systems and Methods – 2013, Kaufman, Perry J.
- Mysteries of Gann Analysis Unveiled – 2001, Ferrera, Daniel T.
- Gann's Scientific Methods Unveiled – 2012, Mikula, Patrick
- The Definitive Guide to Forecasting Using W.D. Gann's Square of Nine – 2012, Mikula, Patrick
- W.D. Gann Treasure Discovered: Simple Trading Plans for Stocks & Commodities – 2005, Krausz, Robert
- The Trading Methodologies of W.D. Gann: A Guide to Building Your Technical Analysis Toolbox – 2012, Reddy, Hima
- The Gann Pyramid: Square of Nine Essentials – 2001, Ferrera, Daniel T.
- The Cosmic Clock: Timing the Financial Markets Using the Planets – 2016, Bucholts, Malcolm G.
- The Bull, The Bear and The Planets: Trading the Financial Markets Using Astrology – 2013, Bucholtz, Malcolm G.
- Wonders of Numbers: Adventures in Mathematics, Mind, and Meaning – 2003, Pickover, Clifford A.
One can see that there are many books written on the subject. However, in the following part, we will focus only on the ones written by Gann, presenting the reader with a link where they can be found on Amazon.
Speculation a Profitable Profession
Amazon link:
https://www.amazon.in/Speculation-Profitable-Profession-Instructions-Trading/dp/1479233447Truth of the Stock Tape
Amazon link:
https://www.amazon.co.uk/Truth-Stock-Tape-Commodity-Successful/dp/9650060006Tunnel thru the Air
Amazon link:
https://www.amazon.co.uk/Tunnel-Thru-Air-Looking-Back/dp/1789873894Wall Street Stock Selector
Amazon link:
https://www.amazon.co.uk/Wall-Street-Stock-Selector-Selecting-ebook/dp/B01KUGU5ASNew Stock Trend Detector
Amazon link:
https://www.amazon.co.uk/New-Stock-Trend-Detector-1929-1932-ebook/dp/B01JHP58SMFace Facts America
Amazon link:
https://www.amazon.co.uk/Face-Facts-America-Looking-Ahead-ebook/dp/B01JHP4H20How to Make Profits in Commodities
Amazon link:
https://www.amazon.co.uk/How-Make-Profits-Commodities-Gann/dp/9650060146How to Make Profits Trading in Puts and Calls
Amazon link:
https://www.amazon.co.uk/Make-Profits-Trading-Puts-Calls-ebook/dp/B088HH3SP645 Years in Wall Street
This is another famous book written by Gann, with the goal of helping others succeed in the world of speculation. At the time of writing this book, Gann was 72 years old and, according to his words, had no financial problems and a steady income stream. The only reason for writing this book was to pass knowledge to future generations of traders, hoping that investing will become a profession and speculation will no longer be associated with gambling.
Amazon link:
https://www.amazon.com/45-Years-Wall-Street-Gann/dp/9659124198The Magic Word
Amazon link:
https://www.amazon.com/Magic-Word-W-D-Gann-ebook/dp/B083D7XH8FThe Ancient Science of Numbers
Amazon link:
https://www.amazon.com/Ancient-Science-Numbers-Luo-Clement-ebook/dp/B014NE6VG0Astrology and Stock Market Forecasting
Amazon link:
https://www.amazon.com/Astrology-Market-Forecasting-Louise-McWhirter/dp/0882310348Gann and Astronomy
Gann was, perhaps, one of the first traders to use the planetary cycles to make predictions in different markets. He used concepts such as the declination of the moon at extreme or dates when two or more planets enter a new sign in two consecutive days.
Also, his analyses included eclipses and the date when a direct planet turned retrograde. However, his confusing style when describing his methods leaves much of this part difficult to put together. We do know that Gann wrote a letter to a student explaining how he made predictions about the coffee market using planetary cycles.
W.D. Gann Applications in MetaTrader
The MetaTrader is the most popular trading platform among retail traders. It includes technical tools based on Gann's work, such as the Gann Fan, Gann Line or Gann Grid.
Out of the three, the Gann Fan tool is the most useful for finding future support and resistance levels. Later in the article, we will present some examples of how to use it in combination with the Elliott Waves Theory.
In any case, Gann's tools are based on his famous 45 degree angle. Also called the 1:1 angle, it is a straightforward concept saying that a market that moves above this angle is bullish, while one that moves below is in a bearish trend.
Gann Wheel
One of the most famous Gann tools is the Gann Wheel. Like any Gann method of predicting prices, it has different ways to use it. Also, it is not available on a regular trading platform, so one must build it.
Sure enough, some websites do offer it, but it looks different because the interpretation differs depending on the security traded. For this reason, this part of the article deals first with building a Gann Wheel from scratch and then interpreting it.
One thing any Gann Wheel has, though, is the 45-degree angle. Therefore, several steps are needed to build a Gann Wheel.
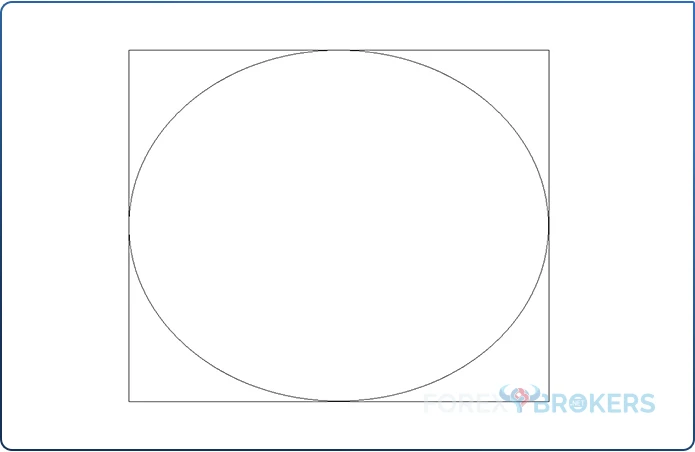
First, draw a square. Just open a picture editor and open a new file. In this case, I used Paint offered by Windows. Make sure the square is big enough because, in the end, the wheel needs to incorporate future prices and you'll need space to write them.

Second, draw a circle inside of the square. Make sure it is tangential to the edges of the square.
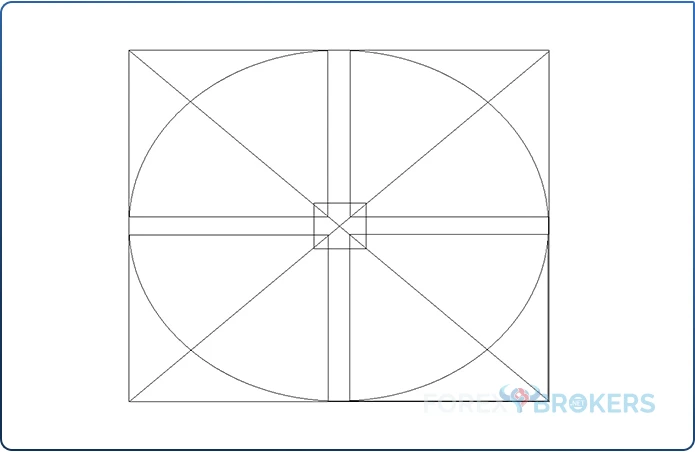
Third, draw four smaller squares, but pay attention to leaving some space in the middle. The easiest way to do so is to draw one square and then copy/paste it three times more. At this point, the Gann Wheel has one big square, one circle tangential to the big square, and four smaller squares on each corner, positioned in such a way that there is some space in the middle of the wheel.
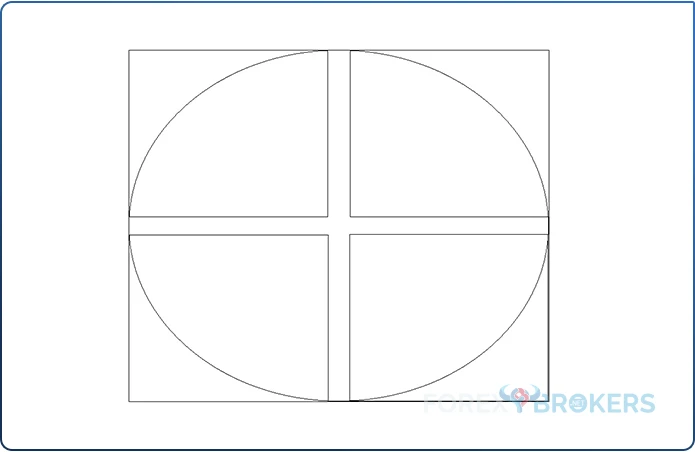
The next step involves two things. One is to draw a smaller square right in the middle of the wheel in such a way as to connect the previous four squares while leaving smaller squares available. Another is to draw the 45-degree-angle lines.
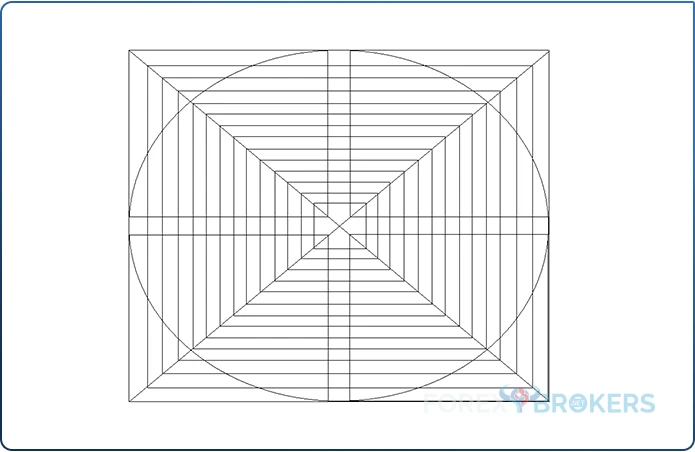
Moving forward, starting from the square in the middle, draw gradually bigger squares at equal distances until you reach the edges of the initial, big square.
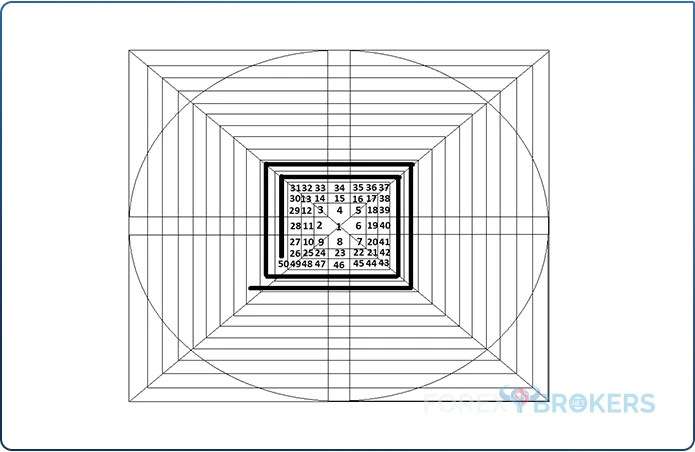
Now, it is time to fill the wheel with numbers. Start with 1, right from the middle of the wheel, and move left. Then, continue with the following numbers clockwise until you reach number 9. This is Gann's famous Square of 9, and it is the basis of the Gann Wheel.
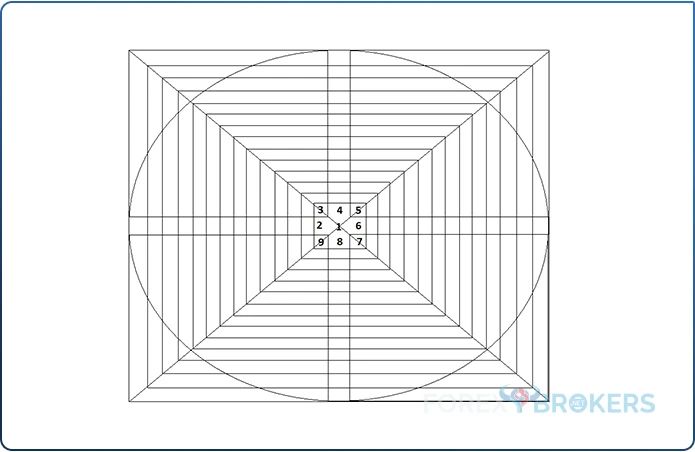
Then continue with the next numbers from the left of number 9, and so on, just as it is shown in the picture below.
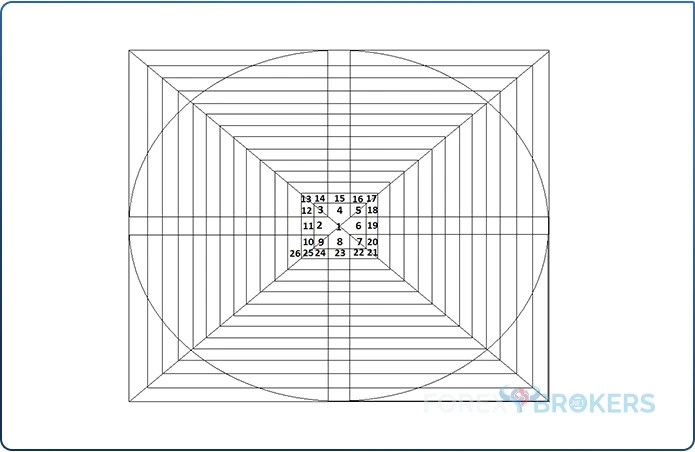
Moving forward, repeat the process until you fill the Gann Wheel entirely. Some wheels need to be bigger, depending on the stock price that the market trades. For instance, in the stock market, some stocks trade at thousands, so make sure you build the wheel properly, or simply use the higher stock prices, divide them by a common factor, and then apply the wheel with smaller numbers.
The thick black lines below show the direction to fill the wheel with the rest of the numbers, similarly explained above.
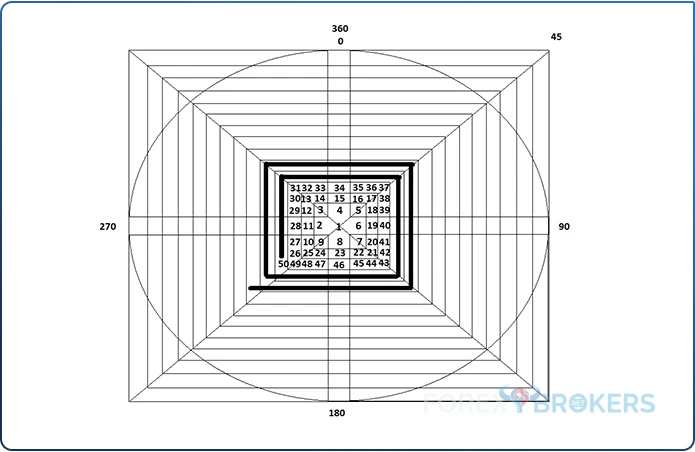
Finally, add the degrees, starting with 0 at the top of the square, and move clockwise using 45-degree increments. You'll have 45, 90, 180, 270, and 360. As you can see, some angles have been skipped because not all are useful with the Gann Wheel.
Gann Wheel's Interpretation
Before going into more detail, remember that the wheel should be filled completely. This article aims to show how to build it, and from here on, the trader should continue.
For the sake of simplicity, let's assume that we are interested in finding out the next price target for a stock that currently trades at $15. We want to find a price objective for buying the stock.
The first thing to do is to locate the number 15 on the Gann wheel. We see that 15 lies below 0 and the 360-degree angle.
Interpreting the Gann Wheel is all about interpreting the 45-degree angles. In this case, because 15 lies right below 0, the 45-degree angle projects $17 as the next obvious target for this stock.
Gann traders would use the following expression: "$17 is 45 degrees up from $15". One can keep obtaining price targets by using increments of 45 degrees. For instance, $28 is 270 degrees, up from $15.
Note that by "up" it means that the Gann trader moves clockwise on the wheel.
As you can note, interpreting the wheel is not so difficult. What is difficult to understand are the different variations of it that have been circulating after Gann's death.
For instance, some traders use the astronomical calendar and place dates believed to be important, such as when multiple planets in the solar system align. Or some traders believe that different markets need different angles to interpret.
As such, angles of interest for equities are believed to be: 45, 90, 180, 270, and 360. For bonds, some traders believe that the angles of interest are 90, 120, 180, 240, and 360. Finally, spot currencies are believed to react the most to 90, 120, 144, 216, 270, and 360-degree angles.
The price targets derived from the Gann Wheel using these angles are believed to offer major support and resistance in the future. But one cannot stop noting the different angles used in different markets. However, there is no logical explanation for it.
Integrating Gan Fan with the Elliott Waves Theory
Speaking of support and resistance levels, the Gann Fan is a great tool to integrate with the Elliott Waves theory. It shows future dynamic support and resistance levels or levels where the market might react.
The Elliott Waves theory is complex and was treated in numerous articles as part of this trading academy. Ralph Elliott had put the basis of a trading theory that counts the market movements.
Analysts interpret waves of various degrees, part of different market cycles, by counting impulsive and corrective waves. An impulsive wave is a five-wave structure labeled with numbers 1-2-3-4-5.
On the contrary, a corrective wave is a three-wave structure labeled with letters a-b-c. This is the basic way to divide the market moves using the Elliott Waves theory, but from here on, things get quite complicated.
For instance, impulsive waves are of different types, such as:
- 3rd wave extension
- 1st wave extension
- 5th wave extension
- Double-extended impulsive wave
- Terminal impulsive wave
Also, corrective waves are of different types, too:
- Simple
- Flat
- Zigzag
- Triangle
- Complex
- Small x-wave
- Double combination
- Double flat
- Double zigzag
- Triple combination
- Triple flat
- Triple zigzag
- Large x-wave
- Double three running
- Triple three running
- Running flat
- Double three combination
- Triple three combination
- Small x-wave
All these patterns have their own rules, and Elliott analysts use a top/down analysis to count the market waves, starting from the larger timeframes, such as yearly and monthly charts, and ending with the smaller ones, such as daily and 4h charts. On each timeframe, they count different cycles, and the analysis on each timeframe starts from where the previous one ended.
At the end of a top/down analysis based on the Elliott Waves theory, the trader is left with one scenario for the future price action. Moreover, the trader can integrate the scenario into a money management system because the Elliott Waves theory has both an invalidation level (i.e., a stop-loss level) and a target (i.e., a take-profit level).
So, how does Gann Fan fit into the Elliott Waves theory?
Using Gann Fan to Spot Future Dynamic Support and Resistance Levels
Gann Fan's integration with the Elliott Waves theory is similar to the integration of Andrew's Pitchfork. For this, the reader might find revisiting Andrew's Pitchfork articles part of this trading academy useful.
Let us use as an example the USD/JPY daily chart with the most recent price action. The USD/JPY is in a bullish trend that started at 102 in December 2020.
Fast forward to the time this article was written (May 2023), and the market has risen above 150, a staggering development in such a short period. We talk about a move bigger than five thousand pips points, so the first Elliott pattern to come to mind is an impulsive wave.
3rd wave extensions are the most common impulsive waves, so it is only logical to start looking for signs of how such an impulsive wave might develop. We see waves of various degrees, marked by the numbers with different colors on the chart below.
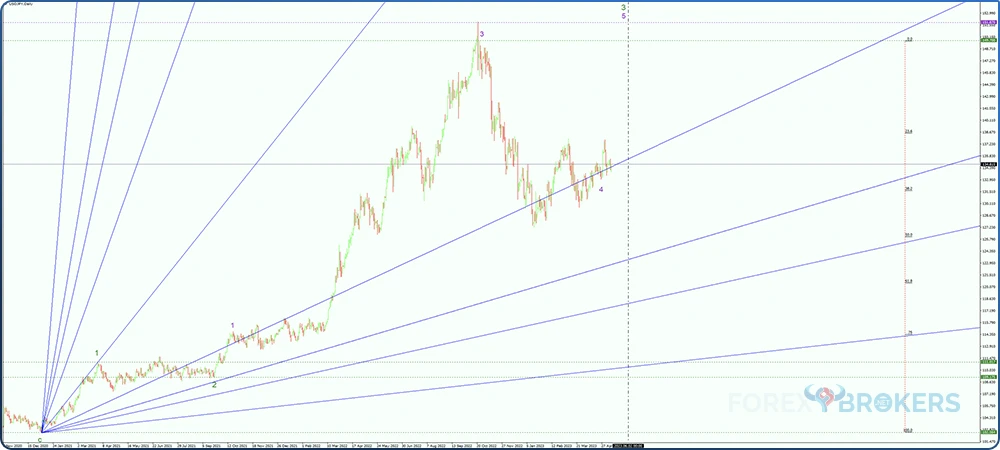
Therefore, the numbers are part of impulsive waves of different cycles, while the blue lines are part of the Gann Fan tool.
Use the 1st Wave to Find Future Support and Resistance Levels with Gann Fan
When used with the MetaTrader platform, the technical trader must use three points to drag the tool. The key is to place the first point at the start of the impulsive move and the third one at the end of the 1st wave.
The chart above shows that the market reacted several times at the dynamic Gann levels. Moreover, after the Bank of Japan intervened when the USD/JPY traded above 150, the market did not find support anymore all the way down the Gann Fan line. A 4th wave of a lower degree is in the makings, as support holds.
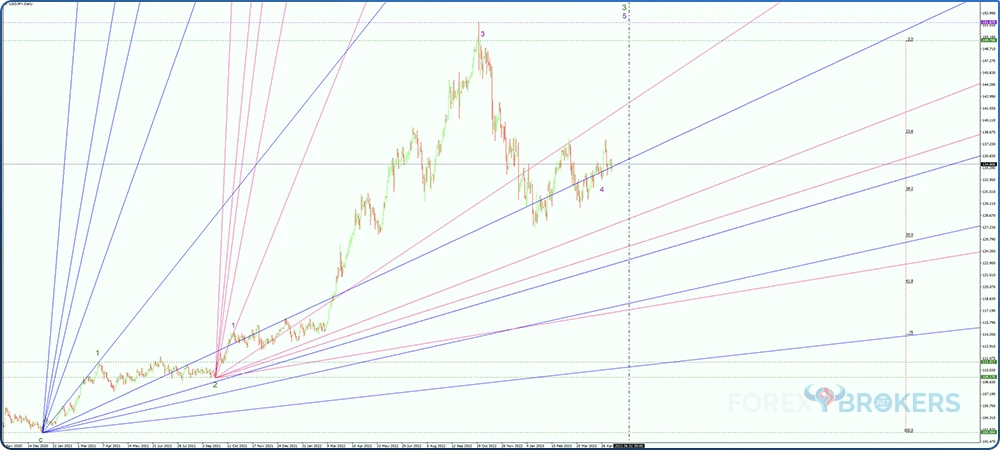
The same principle applies to any impulsive wave. For example, one can use the Gann Fan tool on the impulsive wave of a lower degree. The chart below shows how the lower cycle offers dynamic resistance, while the Gann Fan belonging to the bigger cycle offers support.
Trading with the Gann Trend Indicator
Some trading platforms have introduced indicators that follow the Gann principles, especially the Gann angles. One of these indicators is the Gann Trend indicator.
As the name suggests, this is a trend indicator. Therefore, it should tell us when to go long in a bullish trend and when to go short in a bearish one.
Despite being a trend indicator, it is placed at the bottom of a chart like an oscillator. It has positive and negative values and trading with it is quite simple.
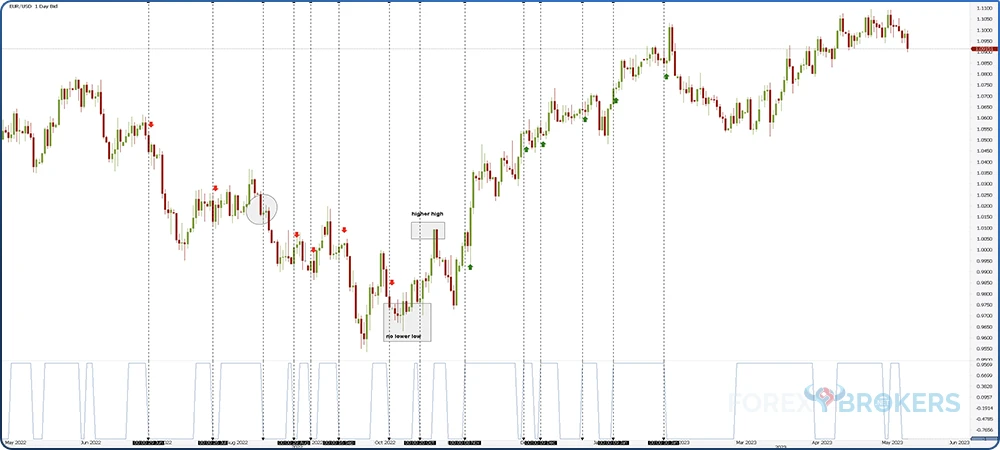
Below, you can see the EUR/USD daily chart. It shows the recent price action from the middle of 2022 to when this article was written.
Sell When the Gann Trend Indicator Turns Negative
From left to right, we see that the Gann Trend indicator turned negative. That is a signal to short the market.
However, one may only go short on such a signal if the market had previously made a lower low. If not, the trader should skip the signal because the danger is that the bearish market turns bullish.
The first two signals are valid shorts. But focus on the third one, marked with a circle.
Because the market did not make a new lower low since the previous signal, we should skip it. The danger is that the market will reverse and break the series of lower highs, thus entering a bearish market. It was not the case here.
Moving forward, the Gann Trend indicator keeps showing valid bearish signals until one point when the market does not make a new lower low, but a short signal appears. The trader should skip this signal.
Finally, the bulls take control, and the EUR/USD breaks the series of lower highs. That is a sign to exit all shorts and look for longs.
Naturally, the opposite happens in a bullish trend. But like with all trend indicators, the trader should consider a money management system, like using risk-reward ratios and trailing the stop. Because it is difficult to spot a top or a bottom using a trend indicator, strict money management rules help.
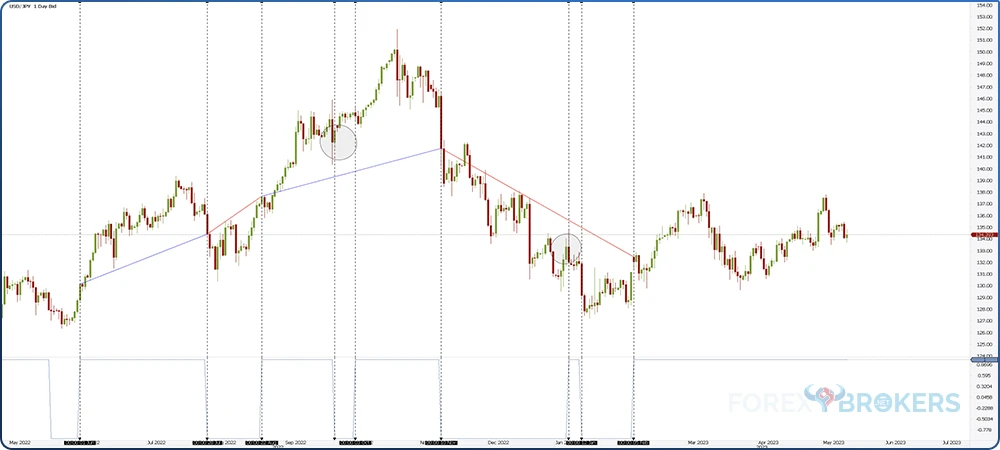
Trading With the Gann Swing Indicator
The Gann Swing indicator is similar to the previous one in that it deals with trends, too. However, there are fewer signals to enter or exit the market.
On the USD/JPY chart below, the vertical lines show the turning points in the Gann Swing indicator. More precisely, when the indicator switches from -1 to +1 or bearish to bullish.
The idea is simple and straightforward – buy when the Gann Swing indicator turns bullish and sell when it turns bearish. But yet again, there is a catch.
For a long signal, there must be a green daily candlestick. Conversely, there must be a red daily candlestick for a short signal.
The blue and red lines on the chart below show the distance traveled in bullish and bearish markets. The first line shows a profitable trade – long at approximately 130 and exit at 134. But the second trade shows a low, albeit a smaller one.
The other two trades are highly profitable. Also, the two circles on the chart show false signals, meaning that the bearish signal came at the end of a bullish candlestick or the bullish signal came at the end of a bearish candlestick. Thus, they should both be ignored.
Conclusion
Gann's methods of trading are not for everyone. Part of it is the fact that all his studies appear incomplete and still have a mystic aura.
Nevertheless, technical analysis in the 21st century has incorporated some of Gann's work. Nowadays, any trading platform offers the Gann Fan or other tools based on his work in the field of technical analysis.
Gann Wheel, presented extensively in this article, is based on the famous Square of 9. The wheel is not incorporated in modern trading platforms, but the trader should know how to build it in such a way as to make the most of it.
Most of Gann's work is based on different angles where the market should react. These angles should offer support and resistance levels, but they are different from market to market. For instance, some angles work better in the stock market than others, and so on.
However, some other concepts, such as using planetary movements to predict future market behavior, are difficult to use. There is no proof that they work, should someone truly understand what Gann meant in his studies.
Many speculators of our time have dedicated years to understanding Gann's work. As such, the reader will probably find plenty of books and works on the Internet claiming to have "unlocked" the Gann secrets.
But it is more likely that Gann's legacy remains the one already incorporated in the trading platforms we use every day. For example, Gan Tools like the Gann Fan, Gann Line, Gann Grid, or some indicators derived from his work can help analyze the price of different securities and forecast future support and resistance levels.
Gann remains famous for his 45-degree angle. A bullish market is believed to stay above the 45-degree angle, while a bearish market should unfold below it.
Together with the way planetary movements influence people's behavior, the two remain the most enigmatic fields of Gann's work.
This article tried to present Gann's work from an objective perspective. Anything else is just speculation about what Gann did or did not say, what he believed or did not believe.
All in all, one thing is sure. Technical analysis without W.D. Gann would be incomplete.
Related Lessons


See more from this category