

302
The Elliott Waves Theory is one of the most complex trading theories ever created. Ralph N. Elliott developed it in the 1930s based on the stock market analysis, and it quickly became one of the widely used concepts to interpret financial markets.
We have covered multiple topics from the Elliott Waves Theory in various articles of this trading academy. However, because the theory is so complex and vast, covering everything in one go is impossible. As such, splitting the concepts into various levels of difficulty and articles was the preferred way to go.
The reader should know by now that impulsive and corrective waves are the 2 pillars on which the theory was built. Ralph Elliott categorized market moves into impulsive and corrective, and he has built a set of rules for each.
Unsurprisingly, corrective waves are more common than impulsive ones. Also, there are more types of corrective waves than impulsive ones.
One way to distinguish between impulsive and corrective market activity is to label them differently. Elliott suggested the use of numbers when labeling impulsive waves and letters when labeling corrective ones.
But there is one exception—a terminal impulsive wave.
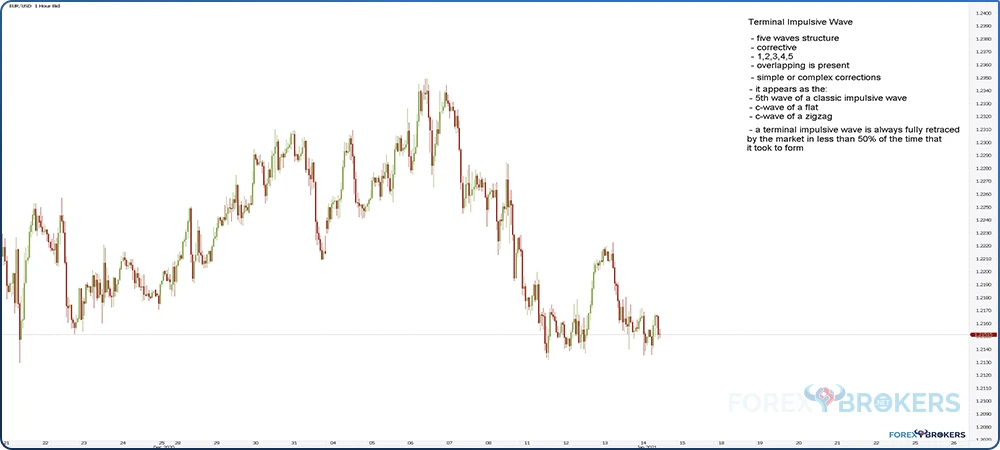
The term may be confusing, but for good reason—the pattern itself is confusing too. As the name suggests, this is an impulsive wave. As such, Elliott traders should use numbers when labeling it. But all the waves are corrective, from the 1st to the 5th. Hence, a terminal impulsive wave is one exception from the otherwise general rule of labeling impulsive waves with numbers and corrective waves with letters. This article covers terminal impulsive wave generalities, the types of impulsive waves, and the different rules to follow when trading them.
What Is a Terminal Impulsive Wave?
To start with, it is an impulsive wave. This means that we should expect it to form in places where a classic impulsive wave appears—for example, as part of a zigzag.
Because of that, we should use numbers to count the waves. As all impulsive waves have 5 segments, this one has too. Therefore, a terminal impulsive wave is labeled with numbers—1, 2, 3, 4, 5.
The big difference between terminal and classic impulsive waves is the nature of the 2 patterns’ segments. Let’s consider a classic impulsive wave labeled 1, 2, 3, 4, 5. We know by now that a classic impulsive wave has 2 corrective waves—the 2nd and the 4th wave.
But in a terminal impulsive wave, all segments are corrective. Hence, all the 1, 2, 3, 4, and 5 waves are corrective. In short, we can call a terminal impulsive wave an impulsive wave only with corrective segments.
What types of corrections can we find in a terminal impulsive wave? All types—simple or complex. Any rule you might know that defines a classic impulsive wave can be “bent” and applied to a terminal one.
Previous articles of this trading academy treated corrective patterns—either simple or complex. To be a simple correction, a corrective wave must be confirmed by the price action that follows. For example, for a flat to be a simple corrective wave, the price action following the flat pattern must fully retrace the c-wave in less than the time it took the c-wave to form. Moreover, if we draw the 0-b trendline, the price action must pierce this trendline in less than the time it took the c-wave to form as well.
However, in the case of a terminal impulsive wave, such a rule does not apply. Here, we can have simple corrections as the entire wave of a terminal impulsive structure without the need for future price action to confirm it.
The Time Element
Time plays a crucial role when trading and interpreting financial markets. Both timing and time matter, but the time element is more relevant in a trade.
Let’s say you have a target for your trade. Suppose you are short the EUR/USD pair, and it must reach a certain target according to your analysis. The question is — when will it reach it?
Not all setups can answer such a question. In fact, most of them can’t. However, some do, and one of them is a terminal impulsive wave.
One of the most important uses of a terminal impulsive wave is its prediction power. As a rule of thumb, the price action that follows a terminal impulsive wave pattern fully retraces the entire pattern.
Therefore, the larger the time frame, a terminal impulsive wave is a valuable pattern. Imagine a terminal impulsive wave forming on the daily time frame. By the time it ends, the Elliott trader knows for a fact that the price action would fully retrace the pattern. Effectively, it means that it will return to the start of the pattern.
But there is more to it. Not only does the price return to the start of the pattern, but it must also do so in a certain time, more precisely in less than half the time it took the pattern to form. Furthermore, it often does so in a quarter of that time.
If this rule is not respected, then everything about the terminal impulsive wave is not right. More precisely, the Elliott trader must go back and check the pattern again, as something is likely missing.
Conditions for a Terminal Impulsive Wave
Several conditions must be met for a pattern to qualify as a terminal impulsive wave. Here they are, grouped into 3 categories:
- Extension
- Overlapping
- Location
Extension
As mentioned so far in the article, a terminal impulsive wave is a 5-wave structure with corrective waves only. In a classic impulsive wave, at least 1 wave must extend. That is, at least 1 wave must exceed 161.8% of the next longest wave. For example, if the 3rd wave extends, it must exceed 161.8% of the longest wave between the 1st and the 5th.
But in a terminal impulsive wave, extension is relative. What does this mean?
An extended wave should exist here, too, but the notion of extension, in this case, refers to only the wave being longer. Therefore, if in a classic impulsive wave with a 3rd wave extension, the 3rd wave should exceed 161.8% of the next longest waves; in price, it only needs to be the longest wave in a terminal impulsive wave. If it is, the extension rule is satisfied.
Nevertheless, 1 wave needs to be longer than others. It may sometimes extend more than 161.8%, but it doesn’t need to do so. As the 2 examples presented in this article show, there is no extended wave, and one doesn’t need to exist.
Overlapping
Another difference between classic and terminal impulsive waves is overlapping. In a classic impulsive wave, overlapping between the 2 corrective waves, the 2nd and the 4th, must be avoided. In contrast, overlapping is a mandatory condition in a terminal impulsive wave. Without it, the terminal impulsive wave pattern is discounted.
To many traders, the notion of overlapping is confusing. Overlapping refers to the territories of the 2 corrective waves and not to their start and end. In other words, the 2 waves should not have any point in common.
Location
A terminal impulsive wave cannot appear anywhere. This is because of the constraints of the time element. Effectively, the price must fully retrace the pattern immediately after its completion.
Therefore, we cannot have a terminal impulsive wave as the a-wave of a zigzag. If it were so, the b-wave would retrace the entire a-wave, which would invalidate the pattern. As such, there are only a few places where we can find a terminal impulsive wave according to the Elliott Waves Theory.
Where Does It Form?
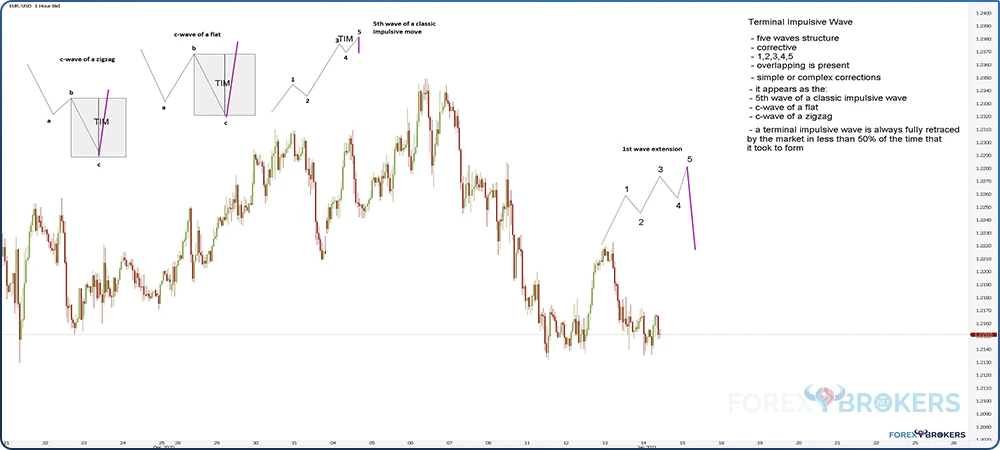
Even though some exceptions exist, a terminal impulsive wave almost always forms as:
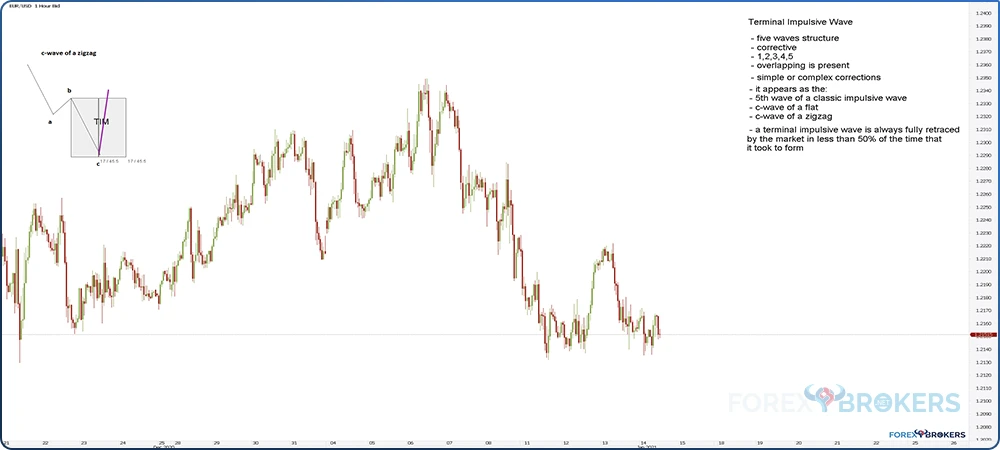
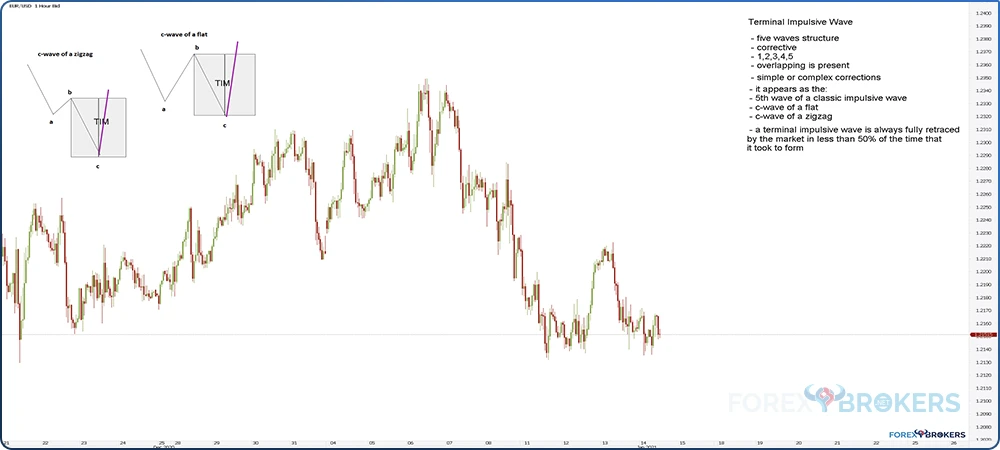
- the c-wave of a zigzag
- the c-wave of a flat
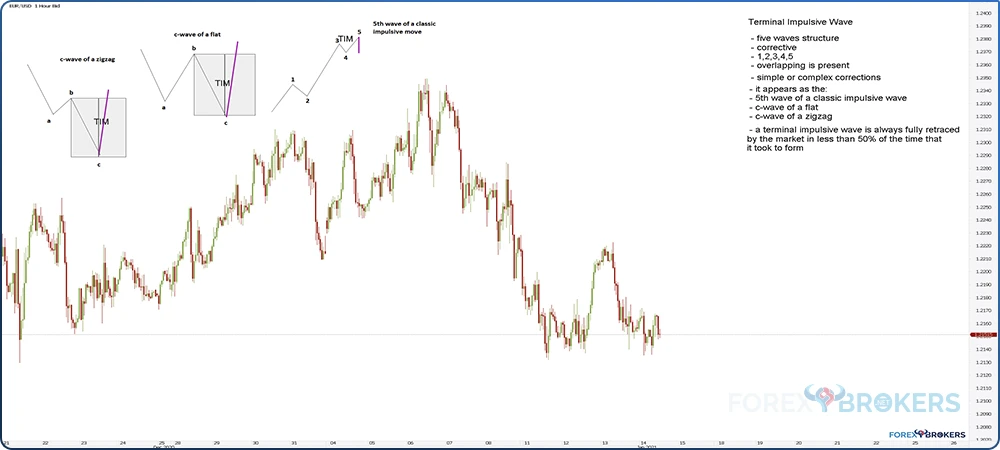
- the fifth wave of a classic impulsive move
Terminal Impulsive Move as the C-Wave of a Zigzag
A zigzag is a 3-wave structure—a corrective one. Labeled as a-b-c, it resembles a classic impulsive move because both waves A and C are impulsive.
Most of the time, these 2 waves are classic impulsive ones. However, sometimes, the c-wave can be a terminal pattern. If that is the case, the entire zigzag corrective wave will turn out to be a simple correction.
Because the price action following a terminal impulsive wave must retrace it in less than half of the time it took to form, it will confirm the zigzag as a simple correction. Any other interpretation would be wrong.
Even if a terminal impulsive wave does form as the c-wave of a zigzag, the time element rule needed in the case of a zigzag’s formation must be respected.
Terminal Impulsive Move as the C-wave of a Flat
Another possible location for a terminal impulsive wave is the c-wave of a flat. Between the two, a flat or a zigzag, there are more chances for the pattern to form as the c-wave of a flat.
Different types of flats exist, and only the c-wave is impulsive. In theory, any c-wave of a flat can be a terminal pattern. In practice, it usually appears as the c-wave of a flat with a c-failure. In such a pattern, the c-wave is the most time-consuming—a feature of a terminal impulsive wave.
When the c-wave of a flat is a terminal impulsive wave, it also means that the flat is a simple correction. This helps with the interpretation and Elliott Waves analysis of waves of larger degrees.
Terminal Impulsive Move as the 5th Wave of a Classic Impulsive Move
Finally, a terminal impulsive wave may form as the 5th wave of a classic impulsive move. This is also commonplace to find a terminal impulsive move.
In this case, besides the 2nd and the 4th waves being corrective, the 5th wave is too. The time and retracement rules for the terminal impulsive wave do not change.
There is one trick helping traders identify the possible terminal impulsive wave as the 5th wave of a classic impulsive move. Here are the steps:
- Find the end of the 2nd and the 4th waves.
- Draw a trendline connecting the 2 points.
- Project the trendline further on the right side of the chart.
- If the 5th wave is a classic impulsive wave, the price action that follows the 5th wave must break the 2-4 trendline in less than the time it took the 5th wave to form.
- If the 5th wave is a terminal impulsive wave, the price action that follows will pierce the 2-4 trendline several times and keep making marginal highs.
Types of Terminal Impulsive Waves
Three types of terminal impulsive waves exist. Similar to a classic impulsive wave, a terminal impulsive wave may have a:
- 3rd wave extension
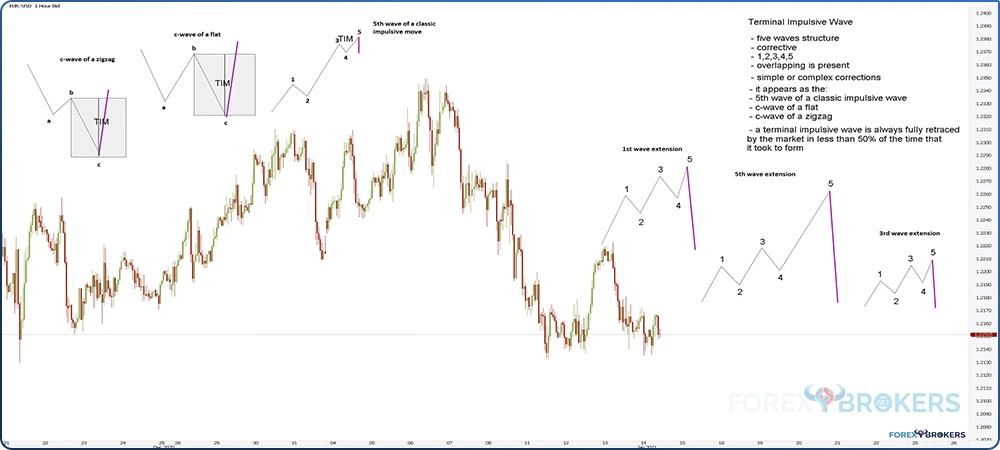
- 1st wave extension
- 5th wave extension
The 3rd wave extension classic impulsive wave, is the most common one. However, in the case of a terminal impulsive wave, the 3rd wave extension is extremely rare. Instead, the most common type of a terminal impulsive wave is the 1st wave extension, followed by the 5th wave extension. Later in the article, we will cover both types with examples from the currency market.
1st Wave Extension
The 1st wave extension terminal impulsive move is the second most common one. As the name suggests, the first wave is the longest but does not necessarily need to be longer than 161.8% of the 3rd wave. However, the 3rd wave should not be the shortest.
You may see a terminal impulsive wave with a 1st wave extension on the bottom right of the chart below. Note the overlapping between the 4th and the 2nd waves and the fact that the 1st wave is not that much longer than the 3rd wave. As explained earlier, extension is relative during a terminal impulsive wave’s formation.
5th Wave Extension
A 5th wave extension is the third most common terminal impulsive pattern. As illustrated in the bottom right corner of the chart below, the overlapping between the 2nd and 4th waves must exist. Moreover, the 5th wave is the longest, but the 3rd wave should not be the shortest.
This article presents two examples of a terminal impulsive wave in the second half of it. One of the two examples is a 5th wave extension terminal impulsive move. It shows how the 5th wave is the longest, but that extension remains relative.

3rd Wave Extension
This is the least common type of a terminal impulsive wave. A 3rd wave extension pattern has the 3rd wave as the longest segment but not by much and overlapping between the 2nd and the 4th waves is a must.
Valid for all three types of a terminal impulsive wave, the move following the pattern must fully retrace it in less than half of the time it took to form.
Examples of Terminal Impulsive Waves
So far, this article has presented the theory and rules to identify and trade terminal impulsive waves. The second part is dedicated to examples to understand the pattern better and see how real patterns look compared to theory.
The first example is the EUR/USD pair, which formed a terminal impulsive wave with a 1st wave extension in the last part of 2020, and the second is a terminal impulsive wave with a 5th wave extension. It formed in 2015 at the end of a limiting triangle. The USD/JPY terminal impulsive wave formed months in advance of what turned out to be the most decisive stock market move in 2015—the U.S. stock market crash from August 2015.
EUR/USD—1st Wave Extension Terminal Impulsive Move at the End of 2020
The EUR/USD pair ended 2020 at the highs. Both the European Central Bank and the Federal Reserve of the United States have eased the monetary policy, but the Fed did so more aggressively.
Moreover, the fiscal support in the United States was bigger than the one in Europe, weighing on the U.S. dollar. As such, the greenback declined across the board, losing ground against its peers.
The EUR/USD broke some important resistance levels on its way up. After the Fed announced the opening of U.S. dollar–denominated swap lines with other central banks, the EUR/USD jumped from 1.07 to over 1.20.
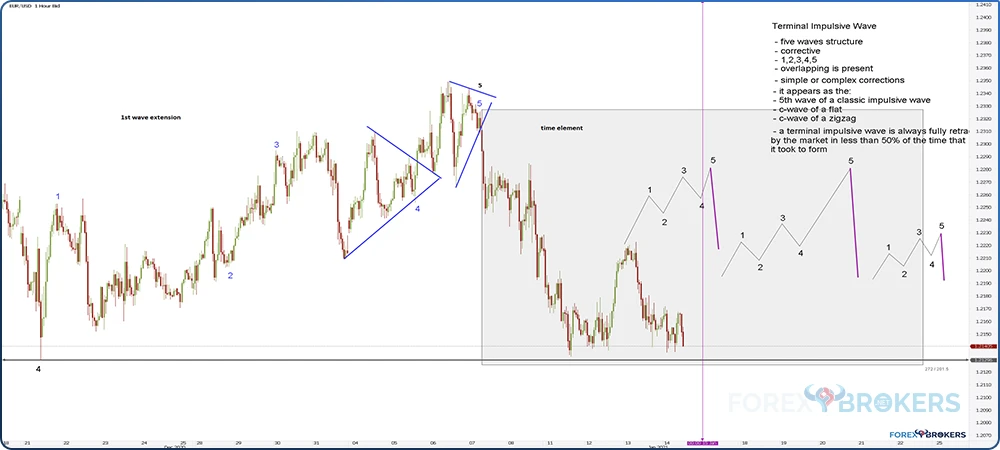
Toward the end of the year, though, the rally stalled. One can notice the marginal highs the market made and a 5-wave structure made of corrective waves. The terminal impulsive wave seen below has a 1st wave extension, and it ended right at the start of 2021. As it turned out, the terminal impulsive wave marked the top of that rally, as the EUR/USD did not reverse to those highs for the rest of the year.
Details of the EUR/USD Terminal Impulsive Wave
The pattern is labeled on the chart above (in blue), but some explanations are needed. From left to right, we see the market jumping in an almost vertical line. That is the 1st wave in the pattern.
Such price action is not unusual during the 1st wave’s formation. Make sure you interpret it as a corrective and not an impulsive wave. A zigzag or a zigzag family pattern might form here. As such, look for a simple or, double or triple zigzag.
What other patterns may appear as the first segment of a terminal impulsive wave? Any corrective wave, simple or complex, is eligible to appear in a terminal impulsive wave.
No Retracement beyond the Start of the Pattern
In a 1st wave extension terminal impulsive move, the 2nd wave is typically the most time-consuming segment. Almost always, it would be a complex correction.
One thing to keep in mind is that the 2nd wave cannot retrace beyond the start of the pattern. No matter what, no parts of the 2nd wave can retrace beyond the beginning of the terminal impulsive structure. This is one rule valid for classic impulsive waves, too, not only for terminal ones.
The 3rd Wave Cannot Be the Shortest
No matter how you count the waves in both a classic and a terminal impulsive wave, the 3rd wave should not be the shortest. In the case of the EUR/USD terminal impulsive wave presented earlier, the 3rd wave does not need to be extended—just to be longer than the 1st wave.
An interesting feature of this terminal impulsive wave is the fact that a triangle appeared in both the 3rd and the 5th waves. Two consecutive triangles in an Elliott waves pattern are rarely possible—this is one pattern where it is.
Watch Closely the End of the 5th Wave
A terminal impulsive wave may take a long time to form. Because all its segments are corrective, it often results in fake breakouts, especially toward the ending part of the part.
Therefore, it is important to calibrate the trading size to not be trapped too levered into a fake breakout. For example, the terminal impulsive wave on the EUR/USD pair ended with a triangle as the 5th wave of the pattern.
A triangle has 5 segments of its own, and when it acts as a bearish reversal pattern, 2 of these segments may give the impression that a breakout happened. As such, the rules of a triangle help in determining when the terminal impulsive wave ended.
How to Trade the Pattern?
Continuing with the EUR/USD example, the trader should focus on the end of the pattern. More precisely, when the price breaks, the so-called b-d trendline belonging to the triangle forms as the 5th wave in the pattern.
After the break, the trendline may or may not be retested. Normally, the b-d trendline belonging to a nonlimiting triangle must be retested by the price action that follows the breakout. However, while this was a nonlimiting triangle, there is an exception to the retesting rule because the triangle is the entire leg of a terminal impulsive wave.
So, the first step is to wait for the pattern to end. By the time the market breaks below the b-d trendline, the next step is to project the time element.
To do so, traders need to measure the time consumed by the terminal impulsive wave and project it on the right side of the chart from the end of the 5th segment.
Next, split the time in half and quarters. The price action that follows a terminal impulsive wave must retrace the pattern completely in less than 50% of the time it took to form. Most of the time, it does so in less than 25% of the time.
USD/JPY—5th Wave Extension Terminal Impulsive Move in 2015
Our second example of a terminal impulsive wave comes from the USD/JPY daily chart. We will build this one from scratch so that the reader gets the logical process and fully understands how to count a terminal impulsive wave and, more importantly, how to trade it.
In 2015, the Japanese yen pairs were sold aggressively. The Bank of Japan’s decision to engage in massive quantitative easing led to a sharp depreciation of the Japanese yen.
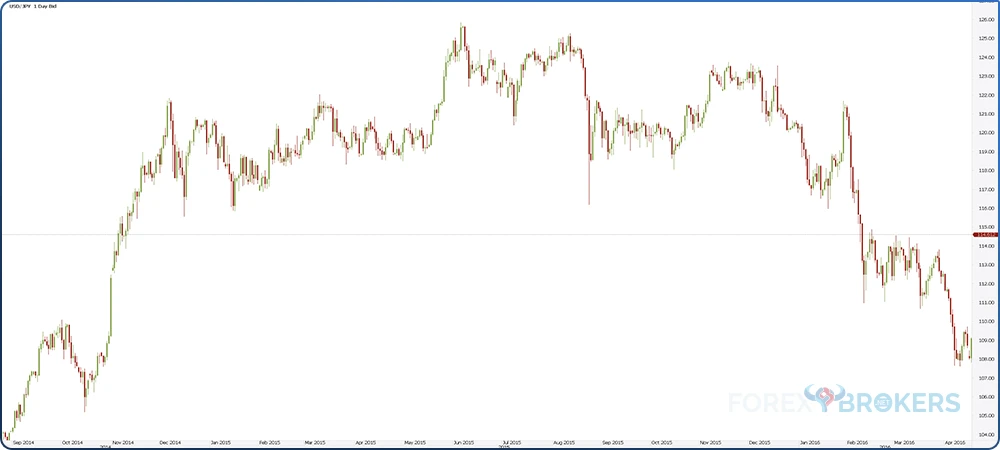
As such, the JPY pairs rallied, with the USD/JPY trading above 125 after only a few years earlier it traded below 80. The advance was, therefore, a sharp one.
From a bigger perspective, the move from the lows resembled impulsive activity. At this point, it doesn’t matter if the impulsive activity was part of a zigzag or an impulsive wave of a larger degree. What matters is that the pair rallied in a 5-wave structure and, at some point toward the end of 2014, it began consolidating.
The chart below shows the pure price action. From left to right, we see the market advancing, making a top above 125, and then reversing sharply. Somewhere in there, a terminal impulsive wave was forming, a pattern that ultimately led to a top that holds to this day.
A 5th Wave Extension Terminal Impulsive Structure
As it turned out, the top was marked by a 5th wave extension terminal impulsive wave. The chart below marks the pattern with a rectangle.
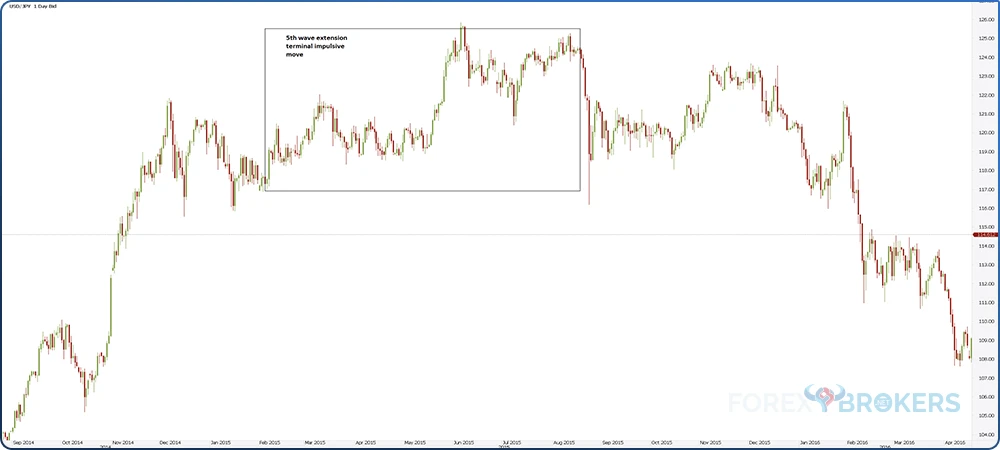
It shows the start and the end of the pattern. The idea is to see the price action that followed the terminal impulsive wave. After the pattern’s completion, the market simply collapsed.
Because the USD/JPY is one currency pair strongly correlated with the U.S. stock market, the sharp decline must have been caused by the stock market declining, too. A quick search reveals that the U.S. stock market “flash-crashed” in August 2015, and that move lower marked the terminal impulsive wave’s full retracement.
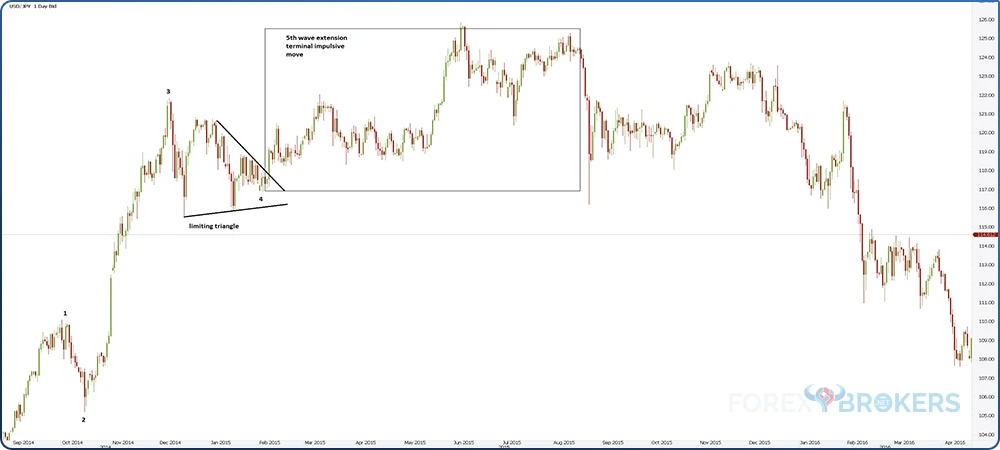
But how do we know that a terminal impulsive wave formed? The answer comes from the pattern formed previously—a limiting triangle.
Limiting Triangle Pointing to a Terminal Impulsive Wave
The key to the terminal impulsive wave is the pattern forming previously. In this case, a limiting triangle.
According to the Elliott waves theory, when forming a limiting triangle, the market needs to respect some conditions. Moreover, the price action must respect certain projections after a limiting triangle.
Without providing too many details regarding the limiting triangle, here are two things to know:
- The price action during the triangle’s formation should not pierce any of the a-c or b-d trendlines.
- A limiting triangle’s b-d trendline is never retested after the breakout.
This trading academy has an entire article dedicated to limiting and nonlimiting triangles, so please feel free to look up more details there. The thing with a limiting triangle is that it can only appear in two specific places:
- The 4th wave of a classic impulsive move
- The b-wave of a zigzag
Out of the two, the second option is out of the question here. A zigzag must respect the time element rule or the time equality between waves A and C. If the limiting triangle depicted below was the b-wave of a zigzag, then the c-wave, or the move that followed the triangle, should have taken approximately the same time as it took the move prior to the triangle. It is not the case here, so the only other option left on the table is that the limiting triangle is the 4th wave of a classic impulsive move.
This changes the picture completely.

Limiting Triangle as the 4th Wave of a Classic Impulsive Move
Once established, let’s try to label the classic impulsive move. Because the triangle’s end marks the end of the 4th wave, it means that the 3rd wave ended where the triangle started.
Moreover, the longest segment in the pattern is the 3rd wave, so we can use the rules of labeling a 3rd wave extension classic impulsive move.
Having labeled the first 4 waves, the only one left is the 5th wave. Here is the catch: the 5th wave of a classic impulsive structure may be either a classic or a terminal impulsive wave on its own. To find out which one, the limiting triangle helps.
One rule says that after the breakout from the limiting triangle, the price must make a new marginal high around the time zone of the apex. More precisely, the market should have made a new higher high around the time the a-c and b-d trendlines intersected. Also, it should have quickly retraced from that level to the triangle’s apex.
None of the above happened, so the move following the limiting triangle must be a terminal impulsive structure. Armed with this information, we could easily move forward with the 2 patterns that most commonly form — a 1st wave extension or a 5th wave extension.
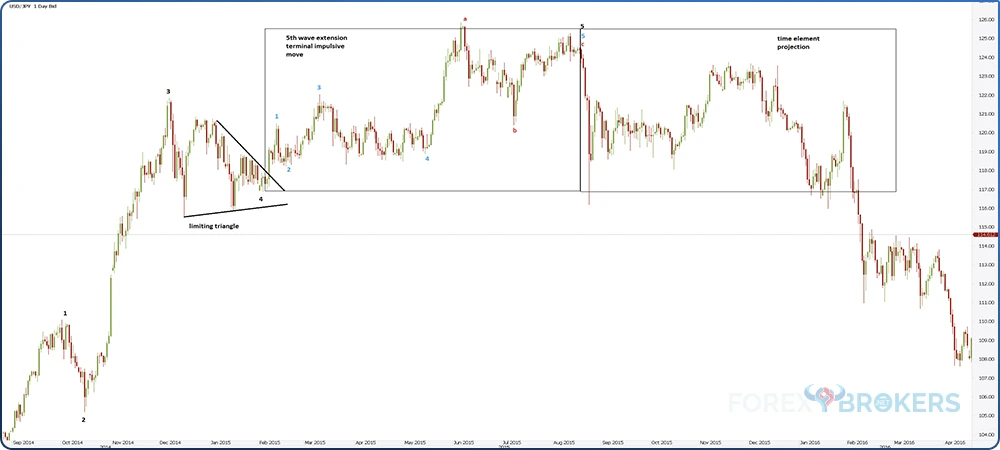
Labeling the Terminal Impulsive Wave
The following part deals with labeling the terminal impulsive wave. After the breakout from the triangle’s consolidation, the market formed 3 segments followed by a long horizontal consolidation area.
As such, we can label the first 4th waves of the terminal impulsive move. Keep in mind that all of them are corrective, simple or complex. For instance, the 4th wave is a complex corrective wave, most likely a complex horizontal correction with a large x-wave—either a double- or a triple-3 combination.
How about the 5th segment? Labeled with a-b-c in red on the chart below, the 5th wave is a flat pattern. Because the b-wave fails to retrace beyond 80% of the previous a-wave and the c-wave fails to fully retrace the b-wave, this flat is called a flat with a double failure. This information is important for the Elliott Waves trader because any flat with a failure indicates countertrend strength.
By the time the c-wave ended, the terminal impulsive wave ended, too. What followed was the stock market flash crash that triggered a sharp selloff in the JPY pairs.

Projecting the Time Element
To check the terminal impulsive wave, we need to project the time element to see if the retracement rule was respected. To do so, we measure the time it took the pattern to form and project it from the end of the flat with a double failure—this is also the end of the terminal impulsive wave.
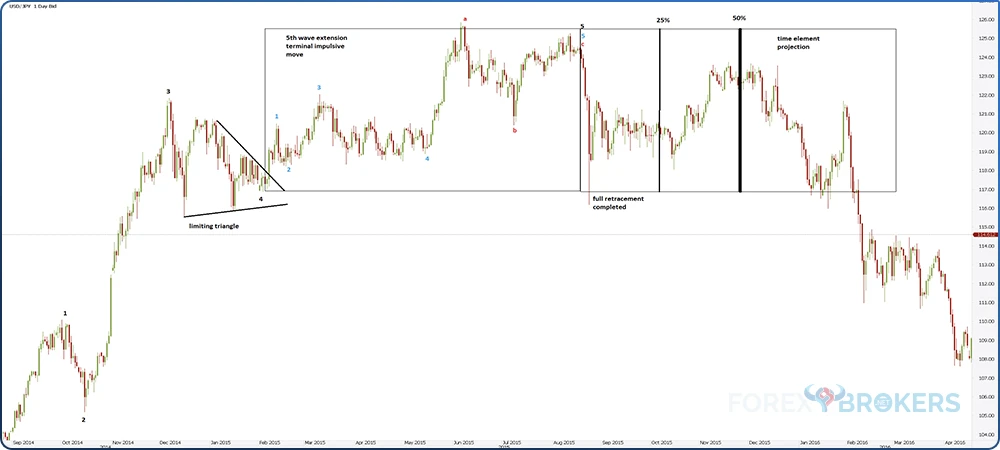
Setting Time Limits for the Price Target
Next, we should split the projected time into half and quarters. The rule says that the terminal impulsive wave must be fully retraced in less than 50% of the time it took the market to form. Moreover, as is often the case, it does so in less than 25% of that time.
As the chart below reveals, the flash crash happened way earlier than the 25% time limit, thus confirming the terminal impulsive structure.
Conclusion
Terminal impulsive waves are special types of impulsive structures. While still labeled with numbers as a classic impulsive wave, all their segments are corrective.
Moreover, the corrective segments may be simple or complex, and the most common terminal impulsive wave is the 1st wave extension, followed by the 5th wave extension. This article presented the rules helping traders identify and label a terminal impulsive wave and 2 examples of such patterns on the EUR/USD and USDJPY pairs.
Perhaps the most relevant detail to keep in mind when identifying a terminal impulsive wave is what it means for the upcoming price action. After all, technical analysis is the ability to interpret past historical prices and make a forecast on the right side of the chart. This is precisely what the terminal impulsive wave indicates—what will happen to the price action once the pattern is completed.
Despite the general belief, terminal impulsive waves form quite often, especially in the forex FX market. The larger the time frame, the bigger the implications for the upcoming price action following the terminal impulsive structure.
The Elliott Waves Theory is a complex one and follows a logical process. Sometimes, it is difficult for traders to identify a pattern, but the theory might imply one exists. Therefore, a close look at all the details is needed to put all the clues together.
Related Lessons


See more from this category