Trends attract all types of traders. The idea of keeping a position on a rising or falling market and merely watching the account grow appeals to everyone.
After all, the "trend is your friend," says a famous market quote. But what is it with trends that everyone wants to ride them?
As we enter deeper into the topics of this trading academy, it feels only reasonable, to begin with one of the most common technical analysis concepts. Trends, trendlines, and trending markets are concepts that all traders have heard of but few master.
This article establishes what a trend is and, more importantly, what the conditions are for a trending market. As it is accustomed, we'll use plenty of examples illustrating not only how trends form but also how to trade them.
Everyone knows that two types of trends exist: rising and fallings or bullish and bearish. However, sideways consolidations are also known as sideways trends too.
The currency market is known for its wild swings and strong trends, but statistics tell us that's not the case. The market, as it turns out, spends most of its time in consolidation rather than traveling in strong trends. Numbers tell us that over sixty-five percent of the time, the market sits in tight ranges, making it mandatory for all traders to understand sideways market conditions too.
A trendline, the line of a trend, is the source of many controversies. Because different ways to draw it exist, many traders are confused regarding how to draw a trendline correctly. This article covers this aspect, too, together with how to build channels to make the most of a trend.
The emphasis, however, is on how to trade trending markets. As always in this academy, we'll use appropriate risk-reward ratios to illustrate the power of trading trending markets.
What Makes a Trend
Before anything, we need to define a trend. A clear definition that leaves no room for doubts follows a series of lower lows and lower highs to describe a bearish trend. Naturally, higher highs and higher lows mark a bullish trend.
While simple, this is a powerful definition of trend formation. Falling and rising markets depend on such a series. Also, the definition helps to trade a trend as it gives precise levels to break to consider a trend reversal.
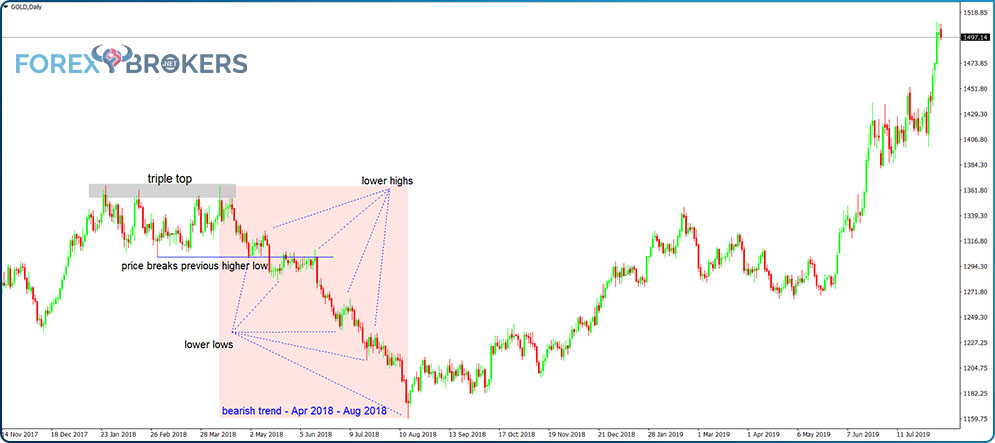
Below is one of the most important markets in the world. Gold on the daily time frame. The only form of money known for thousands of years, gold fascinates traders to this day. It is no wonder gold, or the XAU/USD pair appears in all forex accounts. Brokerage houses offer it to traders with competitive spreads, and traders benefit from the diversification aspect it provides.
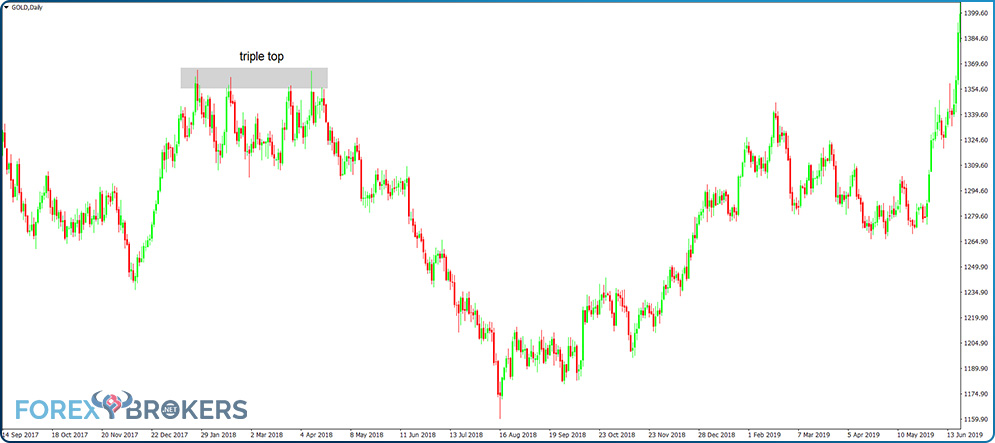
The chart above shows all of the price action for the last years. We notice that, at some point, the gold market formed a triple top. From that moment on, the price broke lower, with the market dropping for more than three months.
Obviously, a bearish market falling for three months is enough to scare all bulls. However, by using specific rules to interpret trends, one doesn't need to worry about the amplitude of a market move. Merely the focus sits on the proper implementation of the trading strategy, as explained below.
Reversal Patterns at the End of Trends
Triple tops are powerful reversal patterns. We'll cover them extensively in a dedicated article later in this academy.
But triple tops give traders a bias. They rarely hold as a reversal pattern for a long time, so the trader always has a bias that the resulting bearish trend that starts after a triple top will eventually reverse too.
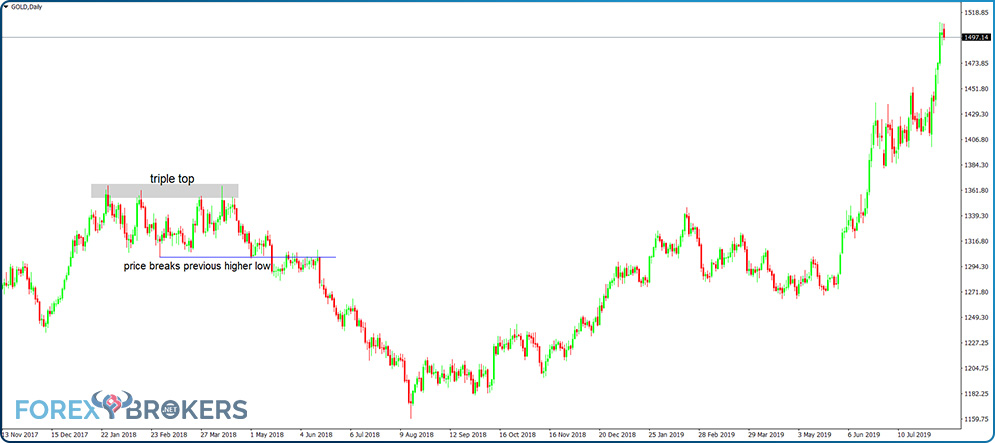
In this case, we see the gold market breaking lower, below the previous higher low corresponding to the earlier rising trend. That's a signal that the previous trend ended and a new one has started. Coupled with the reversal pattern, it reinforces the end of the last bullish trend.
Now the market formed a triple top, but in interpreting a possible end of a trend, any reversal pattern helps, reinforcing the analysis. It could very well be a double top, a dark-cloud cover, a bearish engulfing or an evening star, a tweezer top or a rounding top, a head and shoulders or a rising wedge, a Doji candlestick or a shooting star, and so on. Any bearish reversal pattern at the end of a rising trend helps. Coupled with the break of the previous higher low, it confirms the reversal.
Building the Series
The key to understanding rising and falling trends in Forex is to understand the two series explained earlier. As long as the series exists, the trend won't end. The safest play is just to ride it until its end.
Contrarian traders do exist. They always look for a different alternative to the current market conditions, and usually, their view comes from a more significant time frame. For instance, our example so far used the daily gold market.
However, on the weekly or monthly time frames, the gold market may show something else. Therefore, different views on the same market exist, and they reflect traders' expectations on various time horizons.
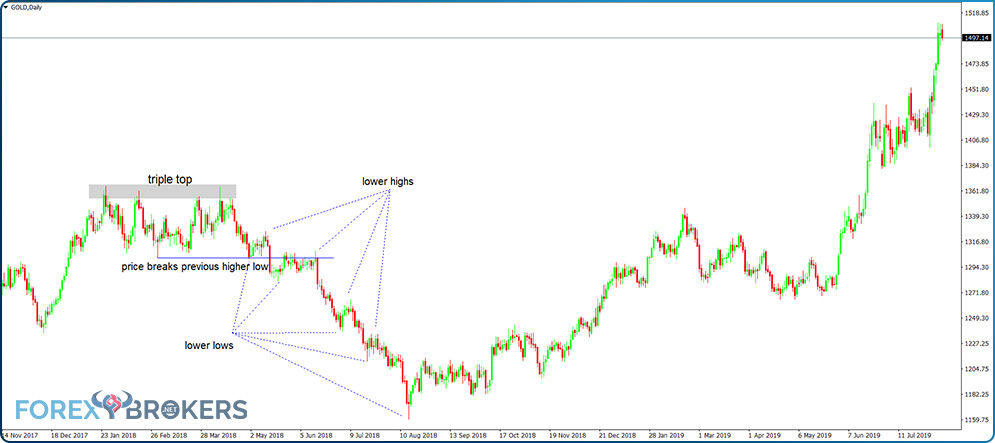
After the gold market broke below the previous trend's higher low, the bearish trend, if any, must start forming lower lows and lower highs. What does it mean?
It means that all the spikes in a bearish trend aren't strong enough to break the previous swing's high. At the same time, the market reverses and makes a new low when compared with the previous one.
The price's inability to reverse above the previous swing's high is the central element of trend formation, and it is the source of fantastic risk-reward ratios, as we'll show later in the article.
For now, let's focus on the chart above. From left to right, after the price broke below the previous higher low, it consolidated on the horizontal. Next, it made a new low, called a new lower low. Another weak spike higher followed, and a new lower low, and so on. This is a bearish trend, and as long as conditions don't change, going long isn't the best available strategy. For four months in the middle of 2018, the price evolved in a bearish trend.
How to Spot a Trend's Reversal
The bearish trend above took four months and was fully identifiable in its early stages. That's the beauty of understanding trending conditions; once traders have mastered them, they find it easy to jump on a trend right at its start.
To identify a trend's reversal, the focus shifts to the lower highs series. A break there ends the trending conditions, and the trader sits on the sideline from that moment on.
Why not go long if the lower highs series breaks? The thing is that we, as traders, don't know what the market forms next. A new, stronger trend in the opposite direction may follow. But the possibility of a sideway correction also exists. No one wants to have the capital tight in a sideway correction on such a significant time frame without the market traveling.
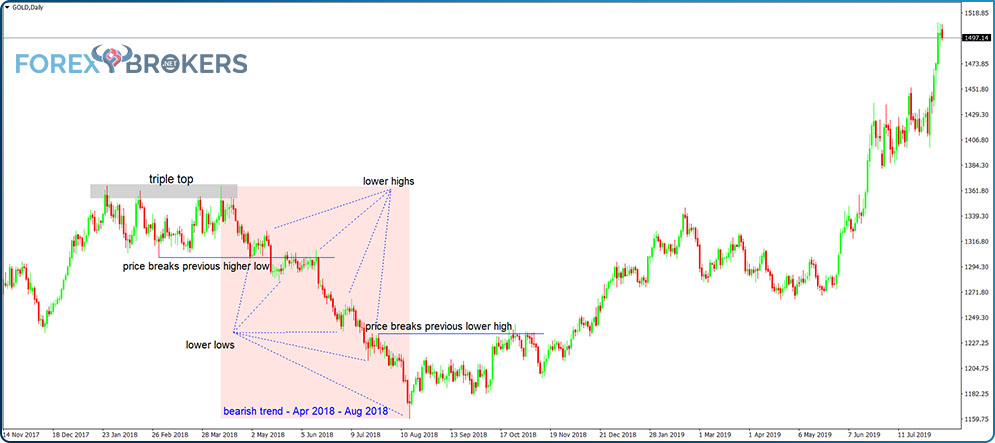
So the name of this paragraph isn't entirely correct. Before a trend reverses, it ends. The end of a trend is easy to identify. The price breaks the previous lower high, as shown in the chart above.
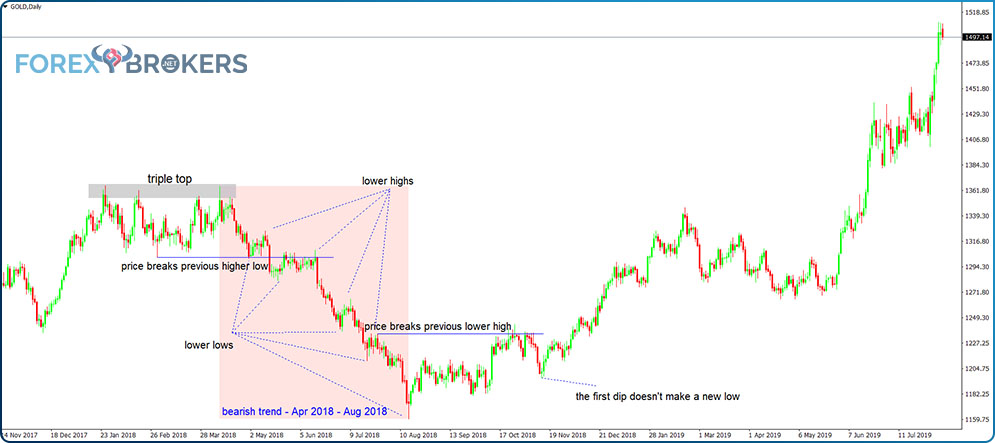
The next thing to watch is the market's reaction to the first dip. There's always a swing that challenges the previous trending conditions, as bears won't give up the fight that easy. If the swing that follows the break of the previous lower high makes a new lower low, the bearish trend resumes, sometimes even stronger.
If not, the market slowly builds conditions for a new trend, this time a rising one. In our example on the gold market, the first dip doesn't make a new low, creating conditions for the birth of a bullish trend.
Riding a Trend
After the price fails to make a new low (i.e., the first dip "survived"), it must make a new higher high. With the higher low now in place, the higher high defines the new bullish trend.
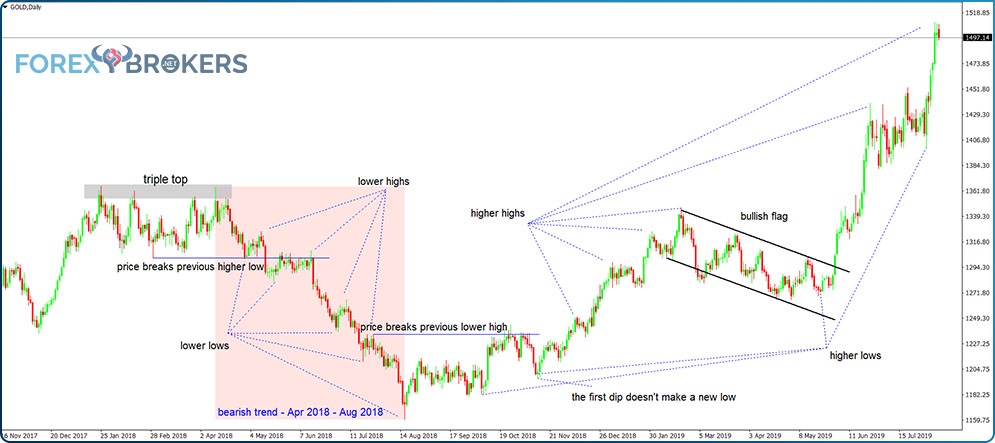
Following a similar process, as explained in the earlier bearish example, the market developed a stronger trend, this time in the opposite direction. But its interpretation may differ from conservative to aggressive traders.
Aggressive traders see the formation of a bullish flag. They won't close the longs and won't consider the bullish flag's correction as breaking the rules of a rising trend. Instead, aggressive traders sit and wait for the flag to end and the bullish trend to resume. They merely look at the bullish flag as a confirmation of the bullish trend.
Conservative traders may decide to close the longs. By the time the price action in the bullish flag formation takes the previous higher low, a similar process, as explained at the start of this article, begins.
Still, both aggressive and conservative traders end up on the right side of the market as they break higher after the flag is violent.
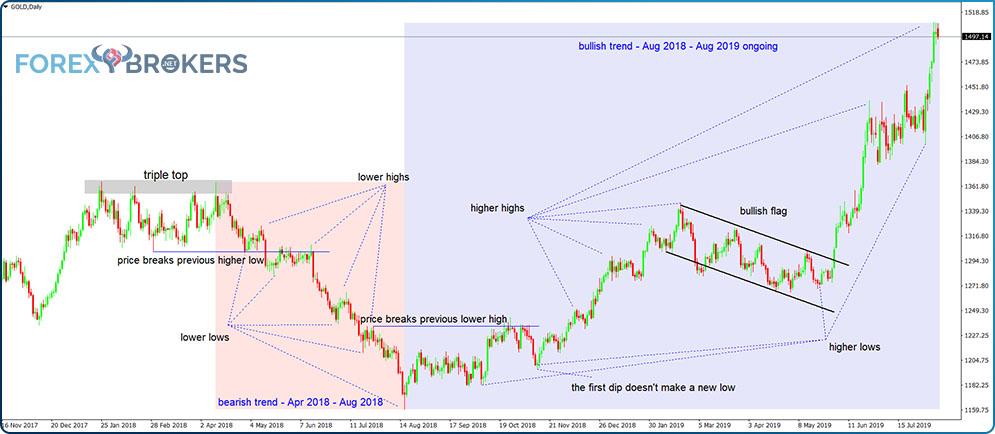
The chart above makes it easy to compare the two trends that formed in the gold market. A smaller bearish trend, followed by a stronger bullish trend, made both bulls and bears happy.
However, for the unbiased trader who only uses the rules of a trend to enter and exit the market, both trends proved to be a source of profit. After all, it doesn't matter where the market goes as long as you're on the right side of it.
How to Trade a Trend
Maybe some or all the things mentioned above are familiar. After all, the conditions of trend formation don't represent a secret for anyone.
While important, knowing how to spot a trend isn't enough. If not coupled with a trading strategy, it won't bring value to the trader's account.
In previous articles, part of this academy, we've already discussed the importance of using risk-reward ratios. For the currency market, risk-reward ratios of 1:2 are appropriate, meaning the trader risks one pip to make two or, for the risk involved in a trade, the trader expects two times the reward.
Using everything discussed so far and the appropriate risk-reward ratios, the two trends identified on the daily gold chart gave four separate trades, all profitable, as you're about to find out, showing just how powerful trends are.
Selling in a Bearish Trend
Never be afraid to sell on a bearish trend. You'll end up selling market weakness, and with trending conditions in place, high chances exist to be on the right side of the market.
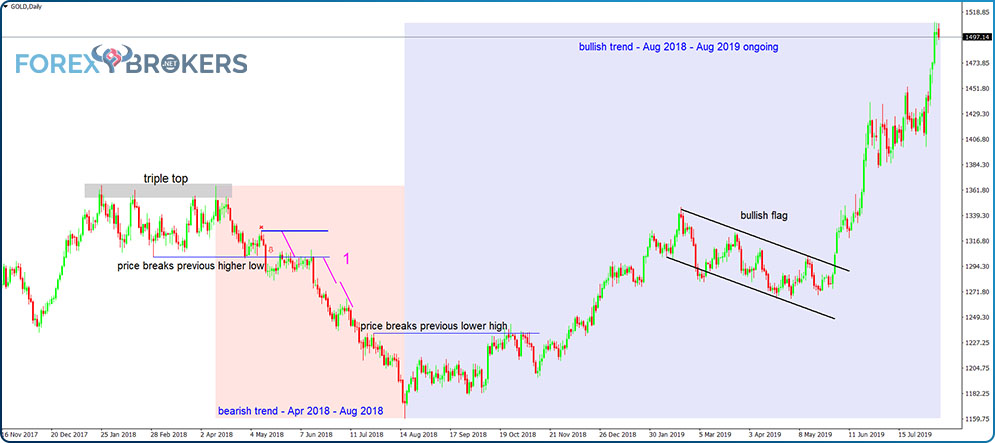
The first trade generated on the short side started when the price broke the previous higher-low series. With the triple top also in place and the price breaking lower, the probabilities favored a further move to the downside.
Some traders use pending orders to enter. In this case, after the swing higher, traders place a pending sell-stop order to enter on the short side. But manual trading works too on a time frame like the daily chart above. After the entry point (where the red arrow lies), the market consolidated the horizontal for about two weeks or more, offering plenty of chances for traders to enter on the short side.
The stop-loss order (marked with the x on example nr. 1) sits at the top of the previous lower high. It's mandatory to have a stop loss, and it represents the most critical element in any trading strategy.
The distance from the entry point until the stop loss (marked with the pink line) is the risk. This is how much, in terms of pips, the trader stands to lose. Obviously, the value of a pip differs based on the volume traded. In any case, the reward adjusts based on the risk for the trade.
As mentioned earlier, a risk-reward ratio of 1:2 means that for the risk involved (the pink line), the reward goes twice as much. As the setup shows, the market reached the 1:2 RR ratio with no meaningful drawdown after the entry point.
Selling Again in a Bearish Trend
Remember that as a trader, you don't know how long the trending conditions remain in place. However, by using a proper risk–reward ratio, you make sure that even if you're in a trade when the market reverses, you'll still make a profit trading the trend.
The bearish trend on the gold market offered a new setup. After the price reached the take profit on the first trade, it bounced, making a new lower high. By the time it fell again, making a new lower low, it had provided the entry for the second trade.
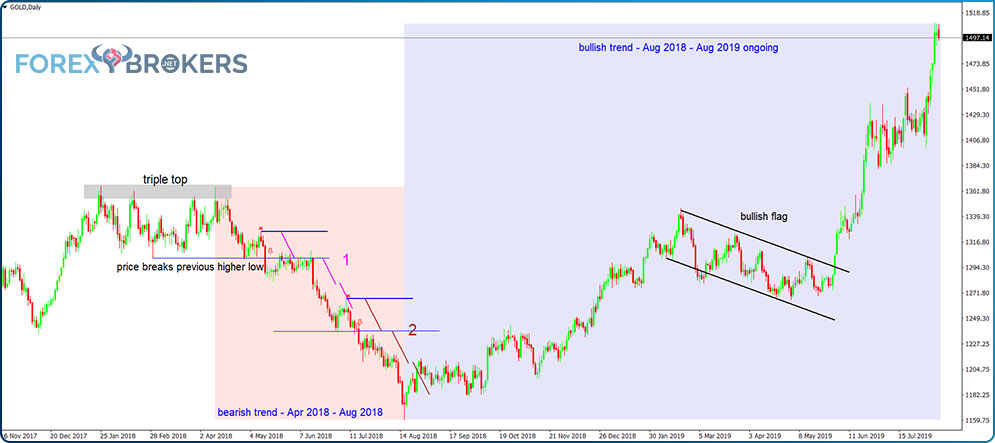
The brown color on the chart above shows how risk-reward ratios work in the trader's favor. The discipline of waiting for the price to reach the take-profit level keeps the trader on the right side of any market and helps to avoid entering new trades.
The beauty of using risk-reward ratios is that by the time a trading setup appears, the trader moves on with the analysis. Such conditions form in all markets and all time frames, and the risk-reward ratio gives traders the proper mindset and tranquility to trade. In other words, the emotional rollercoaster characteristic of all markets is avoided.
Trading in a Bullish Trend
In a bullish market, the same rules apply. The only difference is that traders now use the higher highs and higher lows series when setting up the trades.
The third setup in our example, marked with the green color on the chart below, shows a similar process as before, only this time, traders go long. After the gold market's attempt and failure to make a new low, it bursts higher again, offering entry on a long trade.
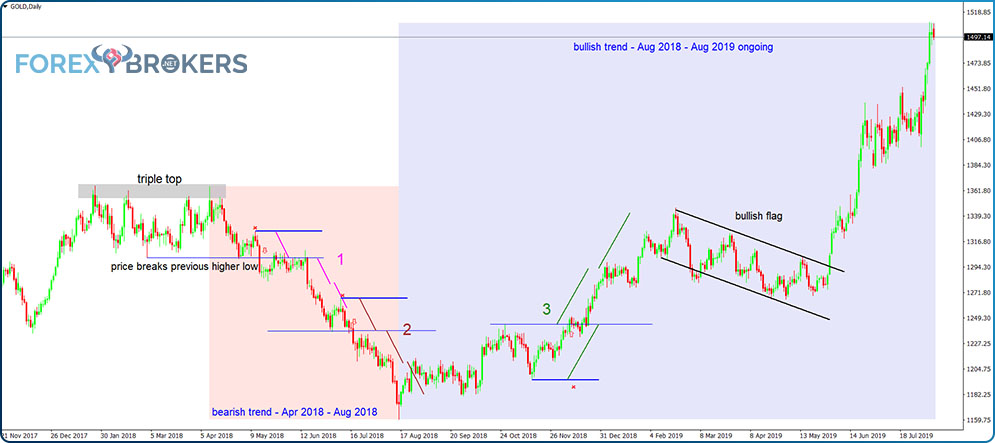
Following the same 1:2 rr ratio setup, the trade closes right before the bullish flag's start, which, of course, opens the gates for a new trade, the fourth in our example.
This is not the trading of a bullish flag but rather a continuation of the same trend trading principles explained earlier. First, wait for the market to make a new higher high above the bullish flag's higher point.

Second, enter on the long side, having a stop-loss order at the lowest point in the flag's formation. Finally, set the risk-reward ratio by measuring the risk for the trade and projecting it twice to the upside. The gold market reached the take-profit level on the last move higher.
In some cases, the distance needed for the stop loss is quite big, but that should not affect the value of the trading account. The thing to do is to adjust the volume traded to the distance needed for the stop loss in such a way that the risk doesn't exceed one or two percent of the trading account.
Trailing the Stop at Lower Highs or Higher Lows
Some traders don't like to jump in and out of a trade during a trend's evolution. Instead, they prefer just to keep the position open, making the most of the trend's strength.
One way to do that is to use trailing stops. It means adjusting the stop-loss order based on what the market does. Again, the series of lower highs and higher lows helps.
For instance, in the first trade illustrated in the chart above, such traders lower the stop loss to the previous lower high every time the market makes a new lower low. This way, they ride the full trend while moving the stop loss into profitable territory. The trade becomes a "free ride," bearing no risk anymore.
Some other traders use a predefined distance. Custom indicators exist that may be imported on the MetaTrader4 platform, and the trailing stop order automatically follows the price action.
For example, let's assume the initial trade needs one hundred pips for the stop-loss order. If the market moves in the trader's favor, fifty pips, the trailing stop order automatically adjusts with every pip the market moves. Therefore, it will lower the stop-loss order by fifty pips in the case of a short trade.
However, when using automated stop trailing, the risk is that the market spikes just enough to get you out of the trade, and then the trend resumes. To avoid this, many other traders trail the stop to the closing price of several candlesticks before the current price. One popular way is to move the stop loss at the closing price from three or four candlesticks ago. This way, the traders protect the profits while giving the market enough space to reach the original target.
Booking Half and Moving the Stop-Loss Order to Breakeven
Another approach is to book half profits when the price reaches the 1:1 rr ratio level. Simply put, the first thing traders do is to measure the risk. Next, they project the risk two times to find the 1:2 level. Finally, when the price reaches 1:1, these traders book half the profits and move the stop loss to break even.
Again, the trade bears no risk anymore, and the free margin becomes available for a new trade. This is a popular approach for traders looking to protect capital as early as possible in a trade's evolution and using the freed margin as a source of funding other trades.
The drawdown here is that the market may bounce before reaching the final target. And by booking half of the profits in advance, the risk-reward ratio is altered. In other words, the trading account will grow at a slower pace than using the original 1:2 risk-reward ratio for the entire trade.
What Makes a Trendline
Trendlines make trends visible. They adapt to a trend, and starting from a single trendline, the savvy trader builds a trading strategy and finds appropriate risk-reward ratios for a trade.
A trendline needs only two points. However, picking the two points that make a trendline is subject to great debate.
The first point is always the top or the bottom of the trend or the starting point of a bullish or bearish trend. The second point is the relevant one. Many traders choose the first lower high in a bullish trend to draw the trendline, and they are right most of the time.
But sometimes, the resulting trendline makes no sense; it has no relevance. Remember, two relevant points make a trendline.
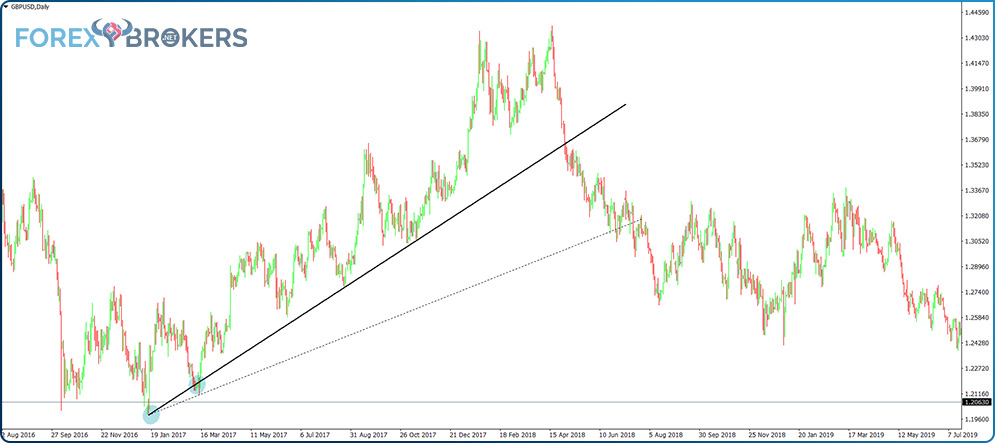
This is the GBP/USD daily chart. It shows the bounce after the 2016 Brexit vote. Right after the United Kingdom voted to leave the European Union, the pair dropped like a rock.
It moved overnight from the 1.50 to the 1.30 area. The move was followed by a so-called flash crash when the pair fell to below 1.20 in a precipitated move. However, it recovered from the lows, building a beautiful upward trend.
The two circles indicate the points used to draw the trendline. By connecting the two points and projecting the trendline further on the right side of the chart, traders see the relevant price action and look for a trend reversal by the time the price breaks the trendline.
In this case, the second point is not relevant. If we connect the first point with the bottom of the first dip (the first lower high), the dotted black line is irrelevant to the rising trend. We need to adjust it.
Adjusting a Trendline
Never be afraid to tweak a trendline. After all, its relevance is confirmed by the market and future price action. In the GBP/USD example, the lower high dip is irrelevant as the price action that follows doesn't reach the trendline. Therefore, an adjustment of the trendline looks like below.
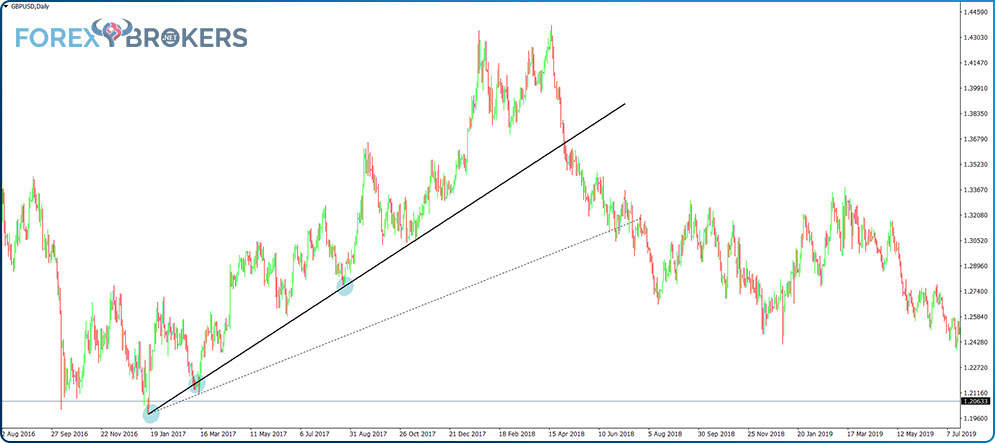
We see that between both the two points that define the trendline and after the second one, the price comes to it, confirming its relevance.
Breaking a Trendline
From left to right, focus on the second circle on the chart above. The price did break the trendline, but traders must always filter the breaks to find out if it's a false breakout or not.
The time element helps to decide if a breakout is worth considering or not. In this case, while the price did break below the trendline, it quickly bounced back above it, spending way too little time below the trendline for the breakout to be considered.
Building a Channel
Trendlines have the great advantage of making the trend visible. By building a channel, traders go one step further with their technical analysis and prepare for taking a trade.
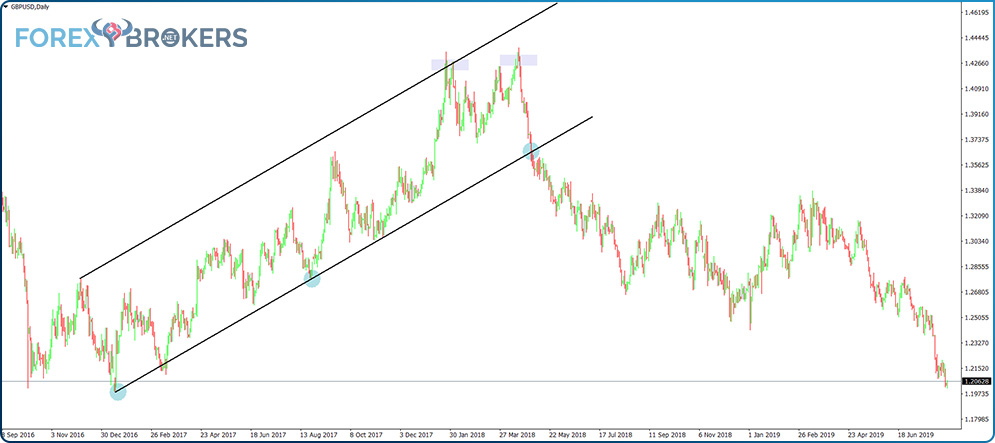
The easiest way to build a channel is to copy the trendline with all its characteristics. The most important one, obviously, is the angle.
First, select the trendline by simply clicking on it. Next, press the CTRL tab on the keyboard while clicking on the trendline again. Finally, grab the trendline from the middle point (it has three points when selecting it—two at its extremes and one in the middle) and drag it to your desired location.
In our case, every time you want to build a parallel channel, focus on the previous trend. Use the last lower high (if the previous trend was bearish) or the last higher low (if the previous trend was bullish) and project the trendline from that point to build the relevant channel.
Trading with a Trendline
Traders use a trendline in two ways. On a rising market, one way is to buy every time the price reaches the trendline, on expectations of a bounce, that is, every time after the two points that define the trendline. On a falling market, traders sell when the price reaches the trendline, with a stop-loss order at the previous market swing.
But buying or selling every time the price reaches the trendline is risky. The more the price tests the trendline, the more the trendline loses its importance. Therefore, look for buying or selling two times and then wait for the trendline to break.
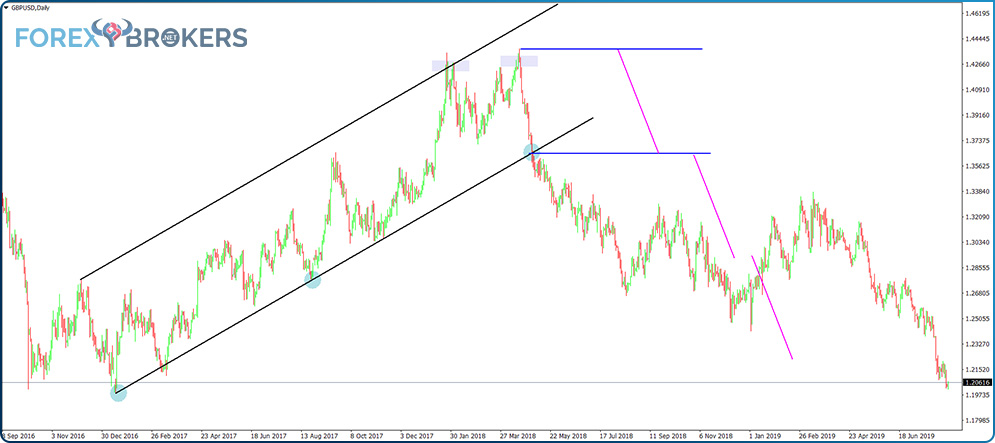
Let's consider the chart above. The main trendline (the one with the two circles on it) is tested once after the second point, offering a great opportunity to trade on the long side with a stop-loss order at the previous lower high. The risk-reward ratio approach of 1:2 works, and the price reaches the target shortly after.
Some traders prefer to wait for the price to reach the opposite edge of the channel, and they even go short on the so-called dynamic resistance. However, that's a risky approach. The more conservative ones wait for the price to break the rising trendline before going short, and they use every little piece of information available that may help with the trading decision.
In this case, the market formed a double top right after reaching the opposite edge of the rising channel. Next, it broke below the main trendline and spent quite some time after the break confirming it. That's enough to go short with a stop-loss order at the highs and a take-profit one respecting the 1:2 risk–reward ratio.
Sideways Consolidations
Throughout this trading academy, you'll find that we always use minimum 1:2 risk-reward ratios for explaining a trading setup. Anything below doesn't make sense from a money management point of view.
But sometimes, the market simply consolidates on the horizontal. What to do with sideways consolidations, and how to find trading setups under such conditions?
Also called horizontal trends, sideways consolidations often form in the currency market. That's especially true when trading cross pairs (i.e., pairs that do not have the USD in their componence).
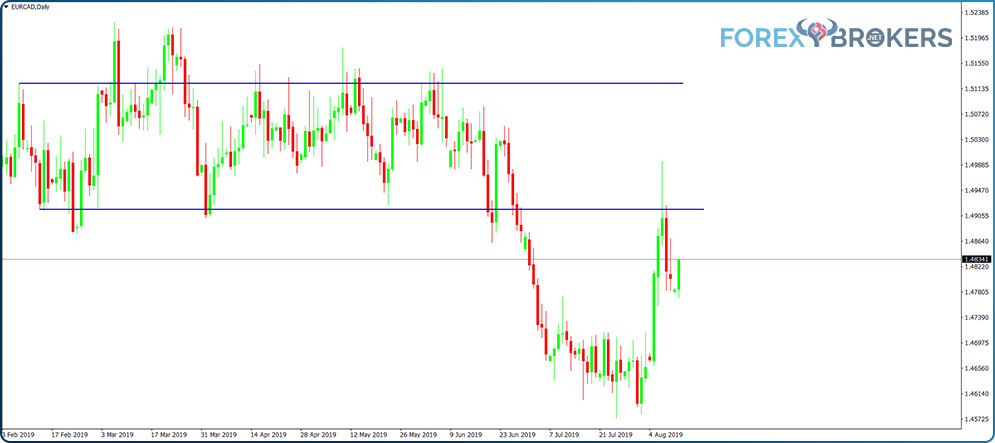
This is what a sideway consolidation looks like. The price simply stays horizontal for a long time (almost half a year in the case of the EUR/CAD chart above). But how do we trade horizontal trends without ending up on the wrong side of the market on the eventual break?
Trading Horizontal Consolidations
A horizontal consolidation provides plenty of opportunities to go long and short. As long as the trader is aware of what the market forms and has a trading plan, horizontal trends are as rewarding as rising or falling ones.
The first thing to do is to establish the edges of the trend. Again, you can use the principles for drawing the main trendline, only this time, the price action is horizontal.
Wait for two market swings and for the price to come back in a predefined range. In the chart below, numbers 1 and 2 show two similar situations when the price broke below the horizontal line and bounced back or above the opposite edge and fell back into the range.
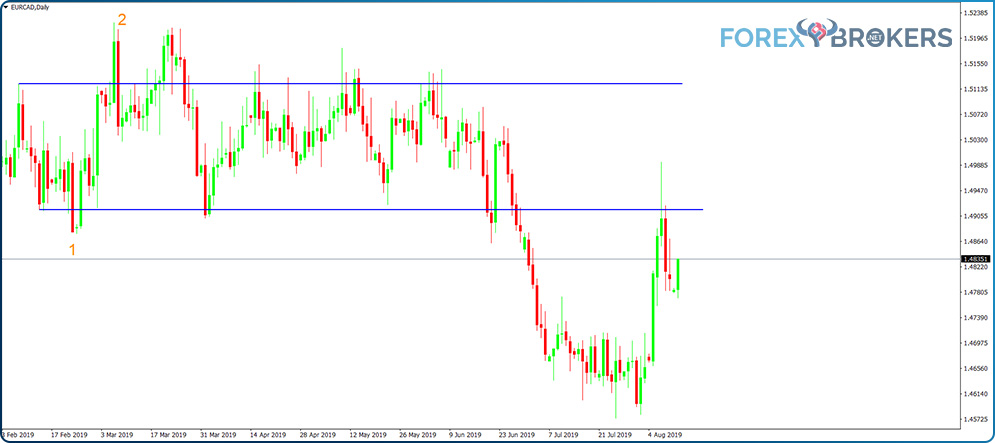
That's enough for considering the range or sideways consolidation as validated, and trading may begin. The secret in interpreting similar trades is to consider only the candlesticks that close out of the range and then come back into the range without closing beyond half of the range.
Rules to Trade Sideways Consolidations
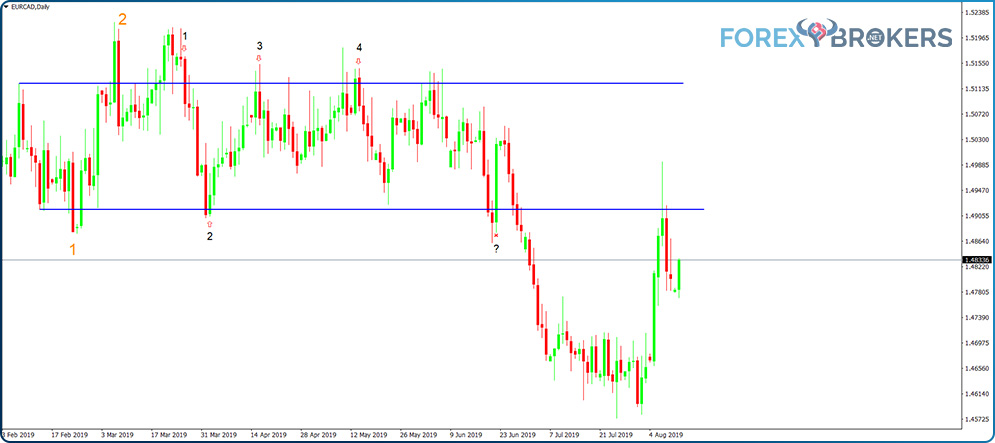
The first trade (in black on the chart above) comes at the end of a bearish daily candle. The secret again is to wait for the candlestick to close.
Let's interpret the price action and conditions needed to trade the sideways consolidation:
- Wait for the price to break and close outside the range.
- Look for a move and close back into the range.
- The price should not move beyond half the range.
- Target the opposite edge of the range.
How many valid trades appear on the chart above? Hint, there's a catch, a fake trade, and you probably already spotted it.
Trade nr. 3 is incorrect. While the price moved above the upper edge, it didn't close above. Hence, the trade is not valid, and the correct entry is at number 4.
The question mark shows another tricky situation to interpret. While the market did close below the lower edge, the subsequent candlestick that followed closed beyond half of the range, invalidating the entry.
Conclusion
Perhaps many traders wonder why sideways consolidations are part of an article that deals with trending conditions. The answer comes from the tight ranges that persist in the currency markets.
Trending conditions do not appear that often. When they do, traders use the main trendline and build a visible channel to ride the trend and even trade a potential reversal.
The lower lows and lower highs, as well as the higher highs and higher lows series, define a bearish, respectively, bullish trend—understanding how the series work is key to trading trends.
In this article, we showed plenty of examples of how to trade trending conditions. We used rising and falling markets, as well as sideways consolidations, to show trades with a minimum 1:2 risk–reward ratio.
Before finishing up, one thing is worth mentioning here. Everything discussed in this article works on all currency pairs and all time frames. Moreover, the principles of a trend, as explained here, work in all financial markets. As long as there's a chart showing the price action, such trades are easy to identify and profit from.
The next article deals with the characteristics of the three trading sessions part of every day. We'll cover their importance and the things to know and provide some other tips and tricks to use during the trading year when specific events are due.
