The technical trader uses prices to interpret the market. In forex trading, most traders use technical concepts, indicators, and trading theories as the base for their trades.
Charting a market is an old concept. Long before computers existed, traders mapped the price of a security or market to identify potential patterns.
In fact, the basis of technical analysis in Forex comes from a pattern recognition approach. Traders looked at similar price patterns, established a set of rules to trade them, and applied those rules every time the patterns formed.
Technical analysis evolved together with technological breakthroughs in our societies. The rise of the personal computer made it easier to chart markets and interpret historical data.
A remarkable thing is the fact that technical analysis concepts developed long ago on different markets do work on all markets available to trade today. That’s especially true in the case of trading theories based on market psychology (e.g., Elliott Wave Theory) or Japanese candlestick patterns.
In some cases, like the Japanese candlestick patterns, the technical concepts have existed since the 1700s. The Japanese used technical analysis concepts to forecast future rice prices.
In this article, we’ll look at the most relevant concepts in today’s technical analysis. As the name suggests, this is merely an introduction to the vast field of technical analysis. Some concepts, like the Elliott Wave Theory, have dedicated articles in this trading academy; some don’t.
But throughout this academy, all concepts mentioned here appear in various forms and interpretations. So think of this article as introducing the concepts and look for the topics to appear in more detail in future articles.
Classic Technical Analysis Concepts
Also known as the Western interpretation of technical analysis, classic technical concepts come from the United States of America. The cradle of the modern stock market and charting, the United States is a significant contributor to technical analysis as we know it today.
Later in the article, you’ll see that the Japanese used technical analysis concepts way earlier than the Americans. However, if we are to compare the patterns and trading theories from the two parts of the world, the United States leads in terms of innovation and continuous improvement in the field.
Support and Resistance
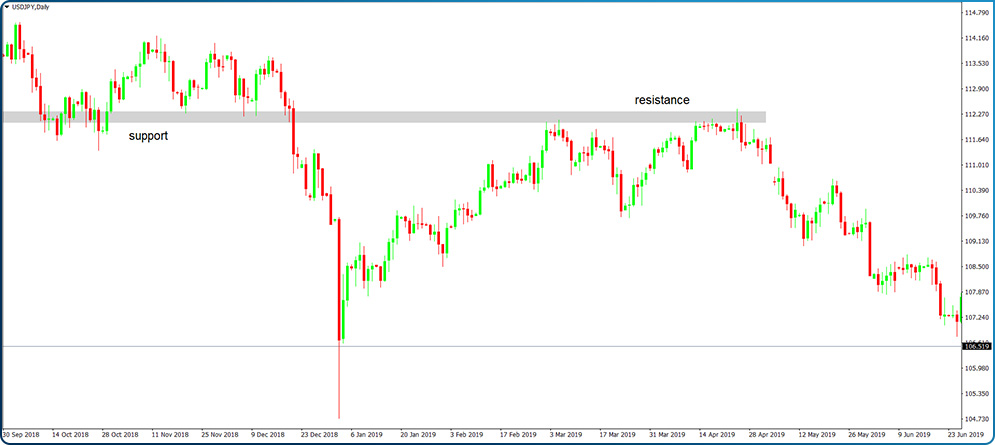
One of the oldest technical analysis concepts, support and resistance levels appear on all time frames and charts. The rule of thumb says that the bigger the time frame, the stronger the support or resistance is.
Once broken, support turns into resistance, and resistance into support. Multiple types of support and resistance levels exist, but for now, just keep in mind the interchangeability of the two concepts.
Also, another thing to consider is how the support and resistance concept evolved over time. Because of the FX market’s volatility, traders don’t interpret a specific level but an area where the price of a currency pair reacts.
Fibonacci Levels
The Fibonacci numbers have a special place in technical analysis. From interpreting potential support and resistance levels to finding extended waves with the Elliott Wave Theory, Fibonacci levels revolutionized market geometry concepts.
Also, harmonic trading uses them extensively. From the basic Gartley pattern to the changes made by Scott Carney, all harmonic patterns use Fibonacci ratios. The following levels appear in various technical analysis concepts and trading theories:
- 23.6%
- 38.2%
- 50%
- 61.8%
- 123.6%
- 138.2%
- 161.8%
- 261.8%
- 423.6%
Fibonacci levels have an extended use in harmonic trading and when counting waves with the Elliott Wave Theory. Starting with the all-important golden ratio (61.8), they all have a tremendous impact on the entry and exit levels of a trading strategy.
Continuation Patterns
Continuation patterns form when the price consolidates a level and then breaks in the direction of the underlying trend. All continuation patterns, and usually reversal patterns, too, have a measured move.
The price consolidates for various reasons. One of the most common reasons is before critical economic releases.
For instance, let’s assume a currency pair is in a bullish trend. The pair keeps making higher highs without meaningful pullbacks.
If a central bank is about to release the monetary policy statement or another economic event is due in the next hours or days, the market stalls. It merely waits for the event to pass before resuming the bullish trend.
Some traders refer to consolidation as the price-building energy to move to the next level. In bearish trends, it keeps valid the lower highs series. In a bullish trend, the higher lows indicate a possible continuation.
Ascending and Descending Triangles
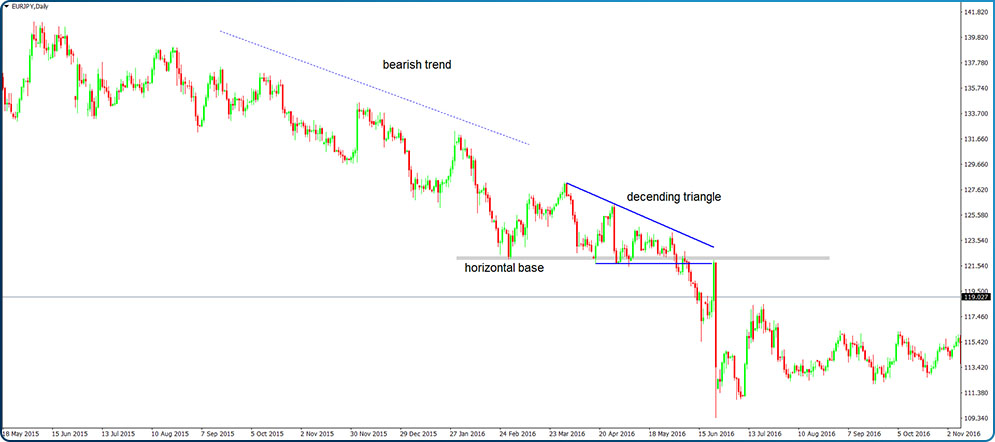
Typically forming against a horizontal base, ascending and descending triangles appear during rising and falling markets, respectively. Such triangles temporarily contain the price action before the trend resumes.
They have a measured move, an implicit trend into existence, and clear rules to trade. Because they form commonly on all markets, they are popular among traders of all types.
Pennants
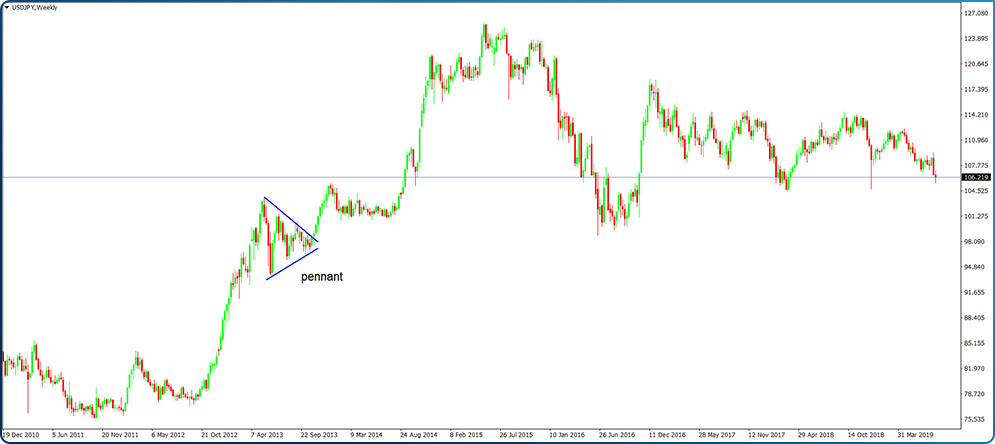
A pennant is a common structure showing continuation and typically forms during bullish trends. Some traders use similar patterns during bearing formations and trade them the same, but that’s not correct.
During bearish trends, conditions differ as the price action to the downside has different characteristics. For instance, the saying goes that a sell-off causes panic, but a rising market creates complacency. Thus, the pennant that forms in a rising market is a different pattern than similar structures in a bearish market.
A pennant is a consolidation area that takes less time than an ascending or descending triangle. Also, the consolidation doesn’t form against a horizontal base anymore. Instead, the market forms higher lows and lower highs, with the price action waiting to pop higher at any time. For this reason, the breakout of a pennant is more aggressive than the breakout of an ascending triangle.
Flags
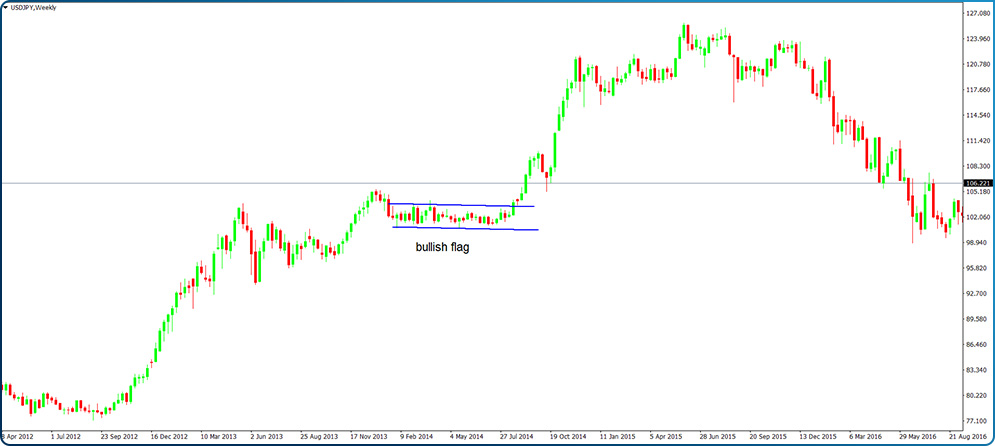
Either bullish or bearish, flags in Forex take a longer time to consolidate. Just like pennants or ascending and descending triangles, flags have a measured move and break in the direction of the underlying trends.
An important thing to mention here is that flags form either horizontally or in the opposite direction of the trend. Also, the range of a flag is tighter than that of a triangle or pennant.
Flags are complicated patterns to trade. Because there’s no time limit for the consolidation during the flag’s formation, traders often lose patience and enter a trade way before the flag breaks higher or lower.
Symmetrical Triangles
A symmetrical triangle is something in between a pennant and an ascending or descending triangle. So there’s no horizontal base like in the case of ascending or descending triangles, and the consolidation takes a longer time than in the case of a pennant. They too have a measured move.
The Elliott Wave Theory treats the concept of a triangle in the greatest imaginable details. Clear rules exist for the legs of a triangle, their structure, and the Fibonacci retracement levels that the trader doesn’t need anything more for their correct interpretation. It is no wonder that almost all triangles identified by Elliott (e.g., limiting, non-limiting) fall into the category of symmetrical triangles.

Reversal Patterns
Contrarian traders love reversal patterns. When the market rises or falls for a long time, someone is always thinking a top is close. Contrarians don’t just go blindly into the market but look for potential reversal patterns.
As the name suggests, reversal patterns form at the top or bottom of a bullish or bearish trend. They have clear rules to trade and even give outstanding risk–reward ratios.
Trading reversal patterns are subject to higher risk than when trading continuation patterns. It’s easier to trade in the direction of the underlying trend, especially if the trend forms on bigger time frames.
Wedges
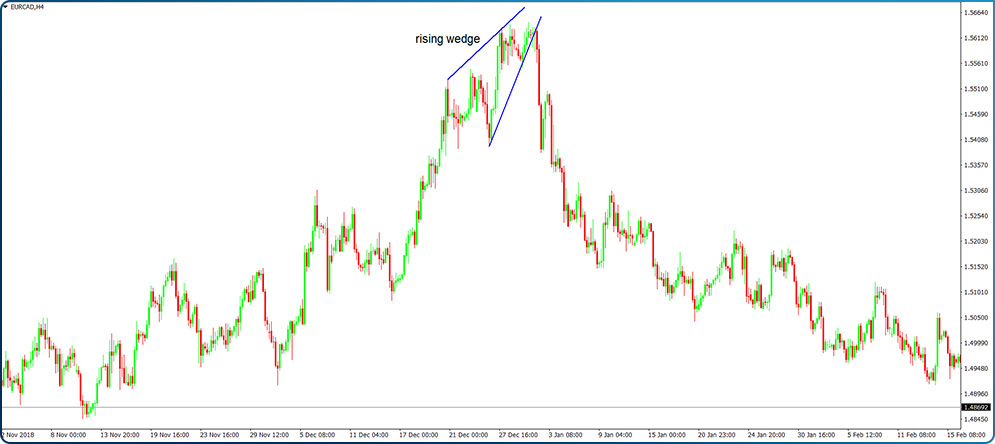
Rising and falling wedges are powerful enough to reverse even the strongest trends. The saying goes that a rising wedge falls and a falling wedge rises, illustrating the price action following such patterns.
The price action into a wedge misleads even the sharpest traders. In a rising wedge, the market keeps forming higher highs and higher lows, albeit insignificant in the overall trend.
Nevertheless, the rules of a trend are in place, and only contrarian traders think of shorting the wedge. Some wait for a break, and some go in early, but when they’re right, the reward is worth the trouble.
Head and Shoulders
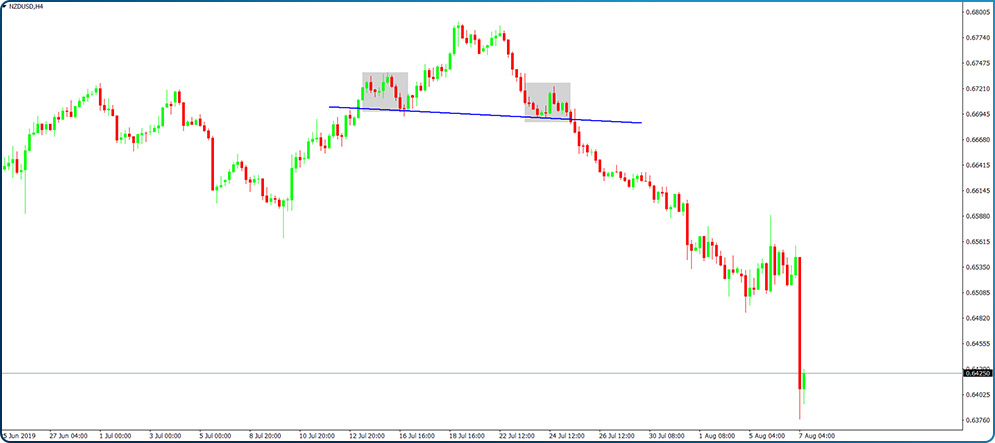
One of the most famous and common reversal patterns in the world of technical analysis, the head and shoulders pattern takes a long time to conclude. As a complex reversal pattern, it is quite powerful, and when forming at the end of a bearish trend, it is said that the market created an inverse head and shoulders.
Double and Triple Top
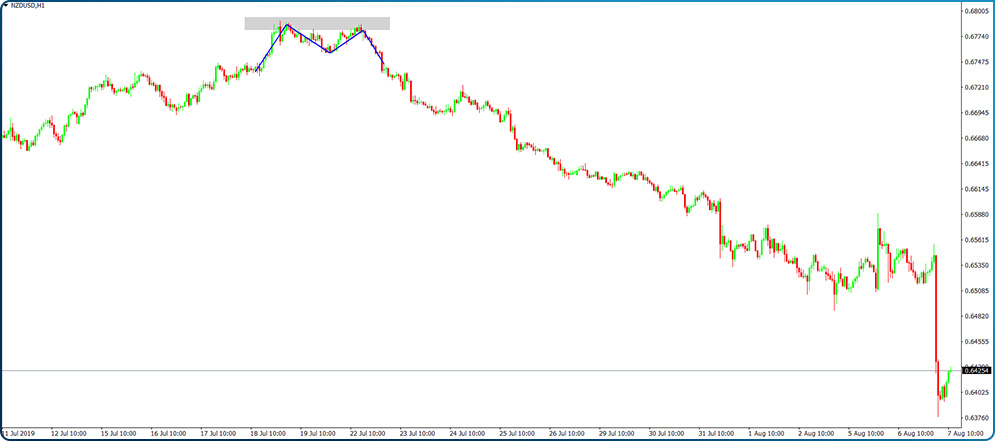
Double and triple tops and bottoms show the price hesitating twice or three times at a specific area. Between the two patterns, double tops are more common, appearing more often than triple tops.
A double top resembles the letter M, while a double bottom the letter W. Again, because of the currency market’s volatility, a double top or bottom shows price hesitation at a particular area and not at a specific level.
Triangles
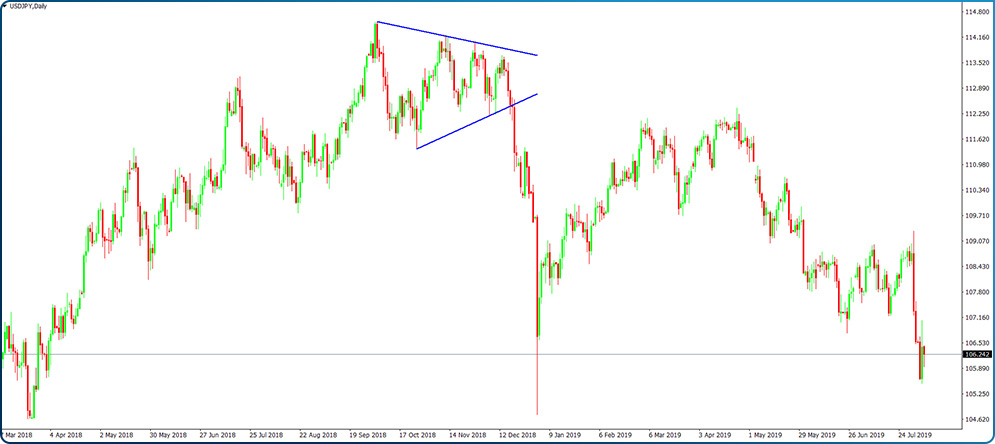
The favorite way for markets to consolidate triangles appears everywhere. On any time frame, currency pair, or other markets, triangular formations come often.
While most of them form continuation patterns, some of them appear as reversal ones. Triangles as reversal patterns have a powerful outcome, giving birth to strong trends.
The thing with triangles as reversal patterns is that the trader doesn’t know the direction that the triangle will break. Following the rules of a triangle best described by Ralph N. Elliott in his Elliott Wave Theory, traders have an educated guess about the breakout’s direction.
Triangles as reversal patterns appear at the end of complex corrections, like double or triple combinations with the Elliott Wave Theory. They make it easier for traders to divide the market into impulsive and corrective activity and to have an educated guess about what the next move is.
Technical Indicators
Still part of the classic technical analysis, indicators have grown in popularity since the personal computer (PC) appeared. Most of the technical indicators as we know them today appeared around the PC invention, and they stood the test of time as a viable indication of future market prices.
Know this, though, before using an indicator: no indicator has 100 percent accuracy, no matter how hard you try to look for the perfect trading setup.
In fact, this is true for any trading theory or pattern, not only for indicators. Proper money management helps to build a profitable strategy by managing the risk in the trading account.
Back to indicators, two types exist - trend indicators and oscillators. The first category appears mostly on the main chart while the second one on a separate, smaller window, typically at the bottom of the main chart.
Trend Indicators
These trend indicators show the market’s nature: bullish or bearish. Their greatest advantage is that they offer a clear view of the market that is difficult to miss by any type of trader.
Listed below are not only indicators but also tools (e.g., to use to visualize a trend). We’ll explain more about trending markets in the next part of this trading academy, but for now, just have a look below at some indicators used to follow the trend.
- Bollinger Bands
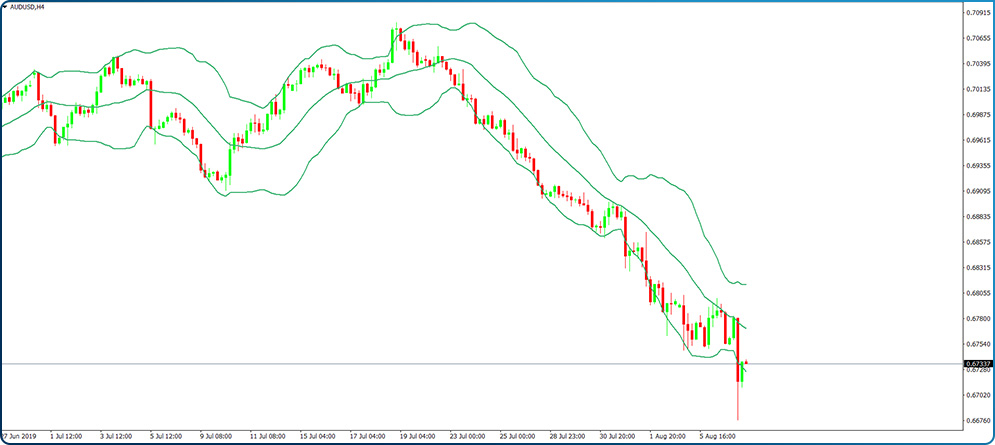
Bearing the name of its developer, Bollinger Bands have multiple functions in technical analysis. One of them is to show the underlying trend, and traders use their adaptative bands as places to buy dips in rising markets or sell spikes in falling ones.
The three bands of the indicator contain the price for over 95 percent of the time. Typically, when the price remains between the lower and middle bands, a bearish trend exists. Or, when it stays between the upper and middle band, the market is in a bullish trend.
- Moving Averages
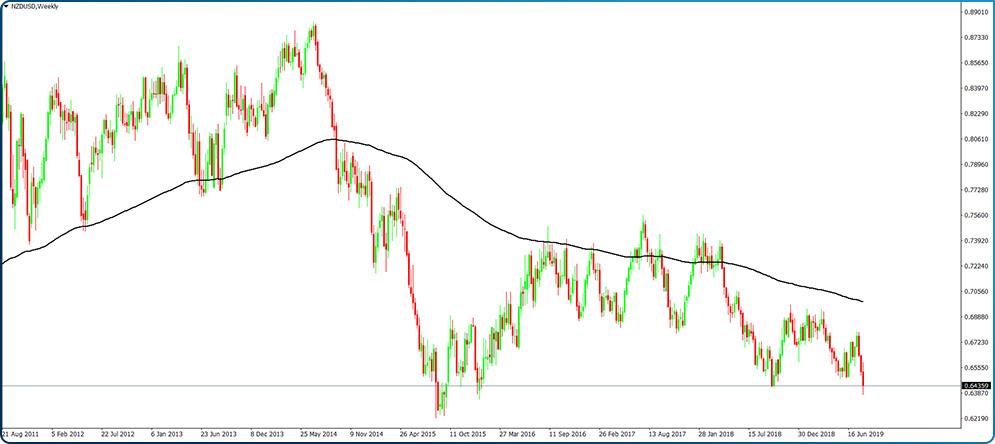
Every trader, regardless of their experience or strategy, looked at least once at moving averages. Extremely powerful indicators, they offer support and resistance on all time frames and various levels.
Take the moving average below. This is the MA(200), also known as the “mother of all moving averages.” It divides the market into bullish and bearish, as seen on this NZDUSD monthly chart. It offers strong support in bullish markets and fierce resistance in bearish ones.
- Parabolic SAR
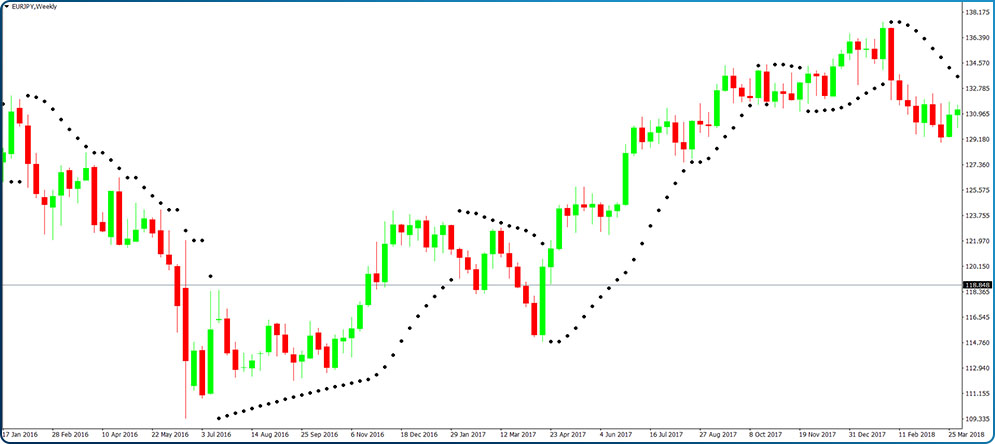
Not many traders use the parabolic SAR indicator, but it provides powerful and useful information about the market. Coming in the form of dots placed above or below the actual price candlesticks, the indicator shows the underlying trend, leaving no room for confusion.
- Channels
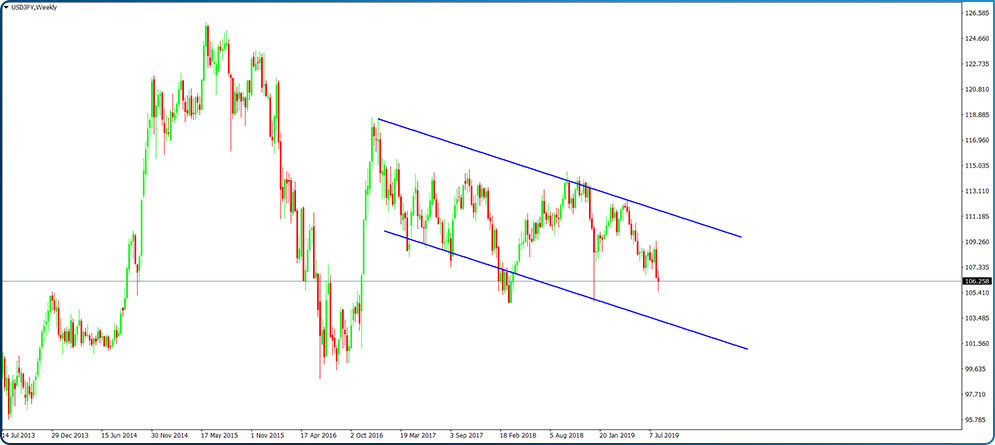
The disciplined trader uses all the appropriate tools to see the market as it is. Channels are such a tool, and they come in various forms and shapes.
A channel may rise, fall, or show horizontal price action. The beauty of a channel is that it shows the consolidation area, revealing opportunities to buy or sell when the price reaches its edges.
Naturally, the focus shifts to the breakout from the channel. False breakouts are common in the currency market, and traders struggle to identify the right way to distinguish between false and real breakouts.
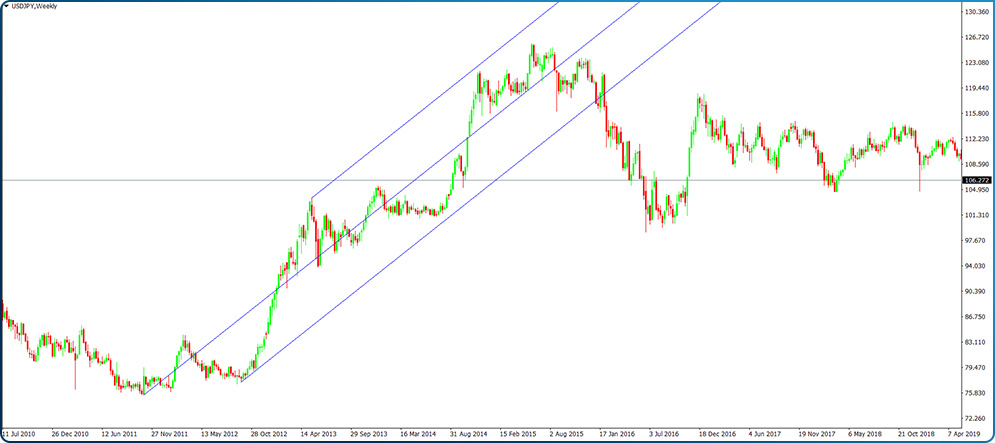
- Andrew’s Pitchfork
Andrew’s Pitchfork is a vital trading tool useful in various ways to analyze the market. We’ll have a dedicated article in the expert section of this trading academy to highlight its ability to forecast prices.
At this point, though, we only mention that the pitchfork has three parallel lines useful to interpret a trend. They start from three pivot points and contain the price in both rising and falling markets.
Oscillators
Considering multiple periods to find out false price action, oscillators are highly regarded in the technical analysis community. Some of them are so famous that every trader used them at some point in their trading career (e.g., RSI [relative strength index]).
We’re only mentioning some oscillators in this article, with further details on how to trade them and plenty of examples coming in the future ones. As a general thing, consider that almost all oscillators show overbought or oversold market conditions. Also, traders look at divergences between the price and the oscillator to find out potential reversal places.
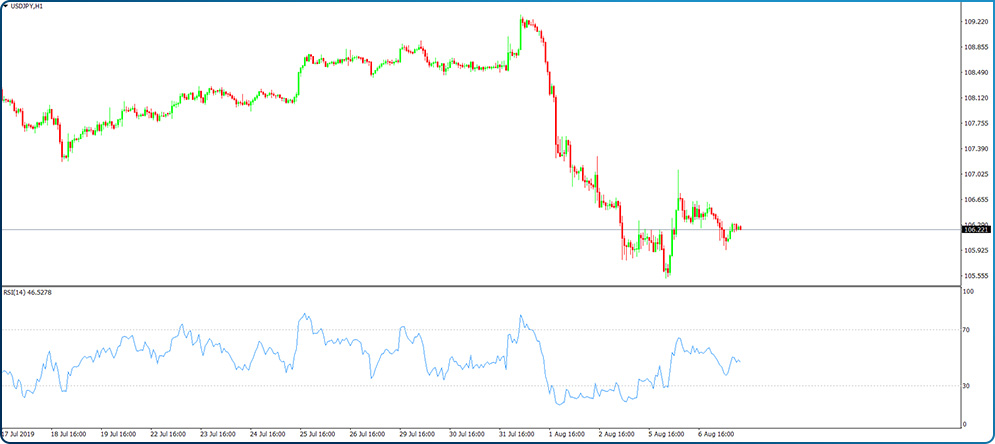
- RSI
The relative strength index, or the RSI, comes in the form of a line that travels only in positive territory. Its overbought and oversold levels (70 and 30) provide great entries for contrarian traders during periods of market consolidations.
For instance, a profitable strategy is to combine a trending indicator with what an oscillator shows. Take a channel and define the consolidation, and then use the RSI to trade the edges of the channel confirmed by the RSI reaching overbought or oversold levels.
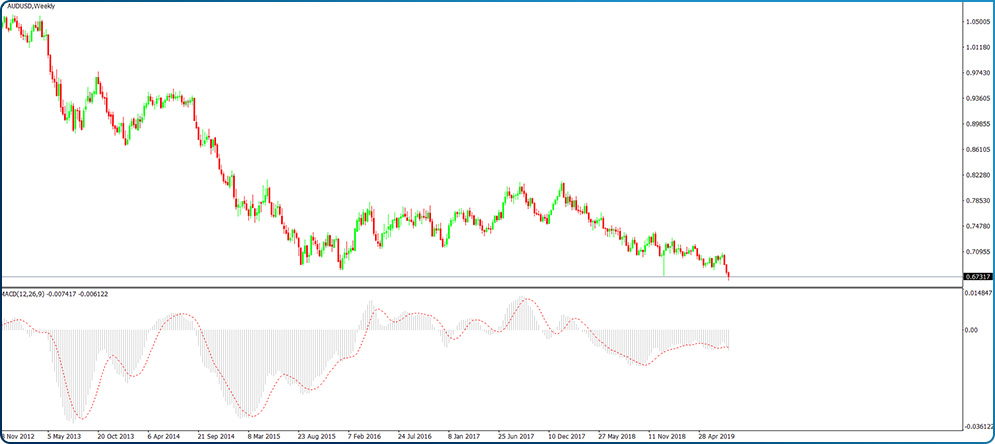
- MACD
The letters stand for moving average convergence divergence, and the indicator is mainly an oscillator. However, it has a strong trending component that we’ll discuss later in this academy. In any case, the MACD is the source of many profitable strategies, and traders around the world find the information provided by it really useful.
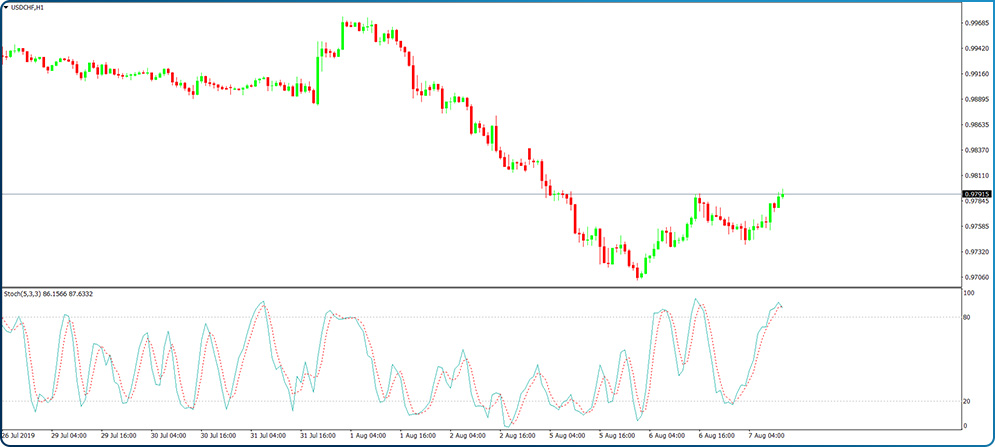
- Stochastics
Another oscillator that travels only in positive territory, stochastics, has slightly different overbought and oversold levels (80 and 20). Its two lines act as a signal to enter or exit the market, and traders also use divergences between the stochastics oscillator and the price.
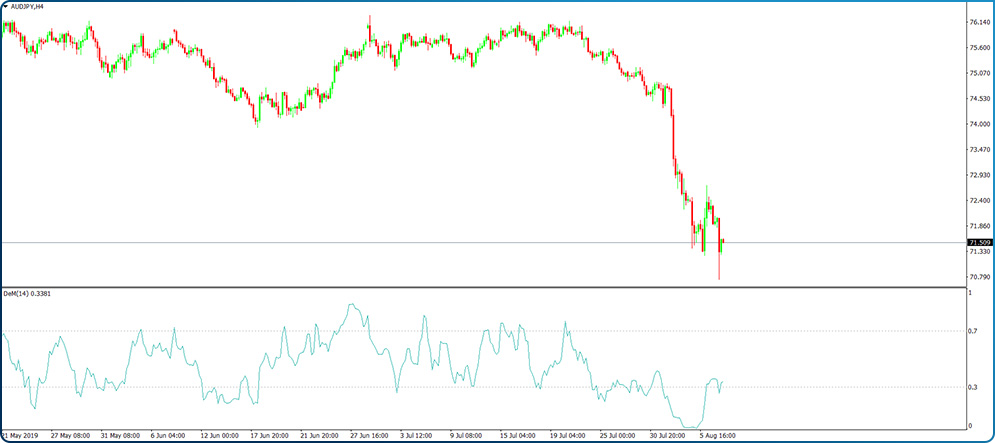
- DeMarker
Tom DeMark is responsible for building many technical indicators. While most of them are for sale, this one is free and available to all traders on the MetaTrader 4 platform.
It has similar characteristics to the RSI, though it shows different overbought and oversold levels (0.7 and 0.3). It travels only between 0 and 1, and it is a bit faster than the RSI.
Market Geometry and Price Action
Way before technical indicators appeared, traders used pure price action and market geometry to analyze charts. Also called trading with a naked chart, interpreting the price action using market geometry is the simplest technical analysis approach.
You don’t need anything to interpret the bullishness or bearishness of a market. All you need is a common-sense market analysis to draw your own conclusions.
Have a look at the recent gold price action. It showed the market exploding higher. But that should come as no surprise for the price action trader.

Remember what technical analysis stands for? Looking on the left side of a chart to project future price action on the right side of it.
From left to right, let’s interpret the market geometry on the gold market recently. We see the market hesitated two times roughly in the same area.
Next, the rejection after the second attempt (nr. 2 on the chart) isn’t strong enough to send the price to a new low. A bounce follows.
Moreover, before breaking above the gray area that acted as resistance before, the market forms a continuation pattern (bullish flag). Coupled with the inability to make a new low, it indicates the price will go for the resistance. And so it did, proving that market geometry and price action are strong enough tools to place the trader in the right market direction.
Japan and Its Contribution to Technical Analysis
Only relatively recently, Japanese technical analysis concepts became known to the world. Steve Nison was accredited with spreading the word about Japanese candlesticks when one of his books enjoyed massive success in the 1990s.
As it turned out, the Japanese used technical analysis concepts way earlier than the Western world did. The concepts used in predicting future rice prices in the 1700s work very well to this day.
The Western world quickly embraced the candlestick pattern, and nowadays, candlestick charts are the number 1 option for traders when setting up the chart style.
Ichimoku Kinko Hyo
A terrific indicator, it projects support and resistance levels on the right side of the chart. The Japanese used it to identify the state of equilibrium between current, future, and past prices.
So many trading strategies exist with the Ichimoku Kinko Hyo indicator that it isn’t worth spending time here to mention them. Instead, there’s a full article dedicated to trading with the Ichimoku and how to make the most of its elements.
Japanese Candlesticks
The Western world quickly embraced Japanese candlestick techniques and patterns. They have become so popular now that all traders know the basic reversal or continuation pattern.
Their most significant advantage when compared with the classic technical analysis pattern is the time component. More precisely, Japanese candlestick patterns take less time to form than Western patterns. The morning star is a three-candle Japanese pattern, and the falling wedge needs multiple series of lower lows and lower highs until they both reverse a bearish trend.
Hammer
The hammer is a single candlestick pattern forming at the end of a bearish trend. As a reversal pattern, it has the power to stop trends, and traders easily integrate it into meaningful risk–reward strategies.

Doji
The Doji candle shows both continuation and reversal conditions. Because traders don’t know what the outcome is after a Doji candlestick appears, the safest thing is to wait until the break comes and then trade in that direction.
Stars
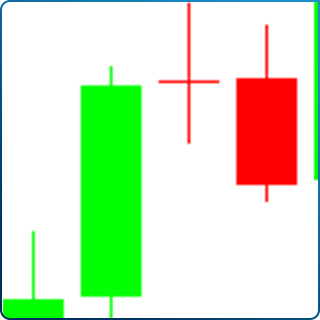
Morning and evening stars are bullish and bearish patterns, respectively. Three candlesticks are enough to reverse a trend, and they give tremendously powerful risk-reward setups.
Piercing
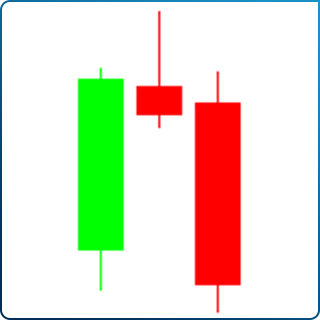
The piercing pattern has only two candlesticks in its componence. A bullish formation appears at the end of strong bearish trends. Also, the opposite pattern of a piercing has an interesting name, the dark-cloud cover, and the only difference is that the dark-cloud cover appears as a pattern.

Engulfing
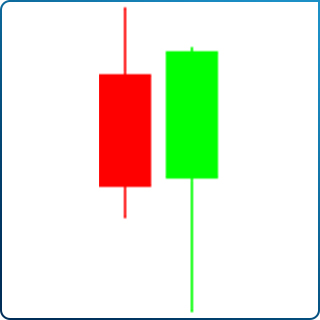
The engulfing pattern appears in two forms: bullish and bearish. In another two-candlestick pattern, the engulfing pattern resembles the piercing or the dark-cloud cover, but the second candlestick totally engulfs the previous one.
Major Technical Analysis Trading Theories
Remember that everything discussed in this article sets up the basis for further detailing each concept. We aim to introduce major technical analysis and trading theories, making the trader curious and further going into more detail in future articles.
The time has come to mention technical analysis trading theories. Perhaps the essential part of technical analysis, not to mention the most comprehensive, the theories here gave birth to great debates throughout the years.
They were all born way before the currency market existed, with some of them dating before the 1900s. For the retail trader, it is inevitable not to stumble into at least one of these theories. First, all retail traders start with technical indicators.
Nowadays, the tendency is to use oscillators and trend indicators to make the most of all market moves. Next, as time passes, traders feel that something is missing and start looking at patterns, like classic and Japanese. Finally, upon the realization that the picture isn’t complete, traders turn their attention to trading theories.
Throughout this academy, we’ll put a lot of emphasis on these trading theories. For instance, the complexity of the Elliott Wave Theory makes it а complete trading theory. Because of its sophistication, we need to cover each aspect in great detail for a complete understanding of it.
Elliott Wave Theory
Born in the 1930s, the Elliott Wave Theory is the work of Ralph N. Elliott. He noticed that the stock market forms specific patterns from time to time and strongly believed they relate to market psychology.
He divided the market moves into cycles of various degrees, with each cycle having a so-called impulsive and corrective wave. In other words, a market’s action and reaction form a cycle.
Moreover, Elliott set clear rules for both impulsive and corrective waves, going to such extremes as establishing time-related concepts that validate or invalidate a market swing. An impulsive wave, according to the Elliott Wave Theory, has five waves of a lower degree labeled with numbers.
On the other hand, a corrective wave was three waves of a lower degree labeled with letters. Therefore, when interpreting an Elliott Wave count or chart, a trader sees a bunch of numbers and letters apparently making no sense.
The beauty of the theory is that it signals the next pattern. For instance, if a flat pattern with the Elliott Theory already completed waves A and B, the next wave to form is the C wave. As Elliott laid down clear rules for how the C wave unfolds, traders have an accurate picture of what to expect from the market.
Things got confusing with all the patterns’ complexity. Some patterns have a simple, clear structure (e.g., flats, zigzags), but some others have sophisticated rules (e.g., triple combinations, terminal impulsive waves).
Nonetheless, because of its power to suggest what the next market move may look like, it attracts traders of all kinds and from all markets. When finishing the theory and writing the book that wears the theory’s name, Elliott stated that it contains “the secret of the universe.” If that’s the case, we’ll reveal everything there’s to know about it.
Point and Figure
Even older than the Elliott Wave Theory, point and figure is a concept that stood the test of time. Traders from all walks of life have much appreciation for this theory as it eliminates the market noise.
That’s correct. The point and figure charts eliminate irrelevant market moves and only show certain swings that exceed predetermined levels. For this reason, a point and figure chart extend over many more years than a classic chart that shows all candlesticks.
Point and figure charting is a bunch of Xs and 0s representing bullish and bearish market trends, respectively. Also, the trends appear in vertical columns, saving space on the chart to interpret as many bullish and bearish trends as possible.
A new X in a bullish trend or 0 in a bearish one appears only if the market travels a certain distance. If not, the chart remains unchanged.
Mastering the point and figure charting means knowing how to set the range for each market. Because markets move differently, traders must adapt and use different values for each market. For instance, the EURUSD daily range has, on average, a different value than the AUDNZD.
One way to solve this riddle is to use a technical indicator called ATR (true average range). The resulting values for each pair represent the minimum distance the market must travel for a new X or 0 to appear on the point and figure chart.
The reversal on point and figure charts also requires some adjustments. Usually, one- or two-box reversal conditions exist, meaning that the market must travel twice the ATR distance for the trend to reverse.
Harmonic Trading
Harmonic patterns appeared when Gartley first used Fibonacci ratios and market behavior. Heavily based on market psychology as well as trend trading theories, the first Gartley patterns had considerable success trading the markets of the 1920s.
In time, the original Gartley principles evolved. Other technical traders brought a new perspective to Gartley’s pattern. Contributions from Pesavento or Carney brought the original Gartley pattern to what is known today as harmonic trading.
Harmonic trading in the twenty-first century means using multiple patterns extensively relying on Fibonacci ratios. With the help of personal computers, some software automatically identifies bullish and bearish ones and alerts the harmonic trader of their existence.
W. H. Gann
The legend says that Gann was the first (and perhaps the only trader so far) to use (with success) the time element in trading. Not only did Gann say where the price would go, but also he indicated the time when it’d happen.
Gann’s fabulous legacy in technical analysis is not that clear, though. A firm believer in astrology and how planetary movements affect human behavior, he dedicated much of his time trying to integrate these concepts into trading.
His work appears in various books, but the terms are confusing and barely connect the concepts discussed. Yet he deserves a special place in this trading academy as one of the most innovative technical traders of all time who used esoteric concepts like astro-trading for the first time.
Conclusion
The world of technical analysis grew as people gained access to more and more information. The trend will most likely continue for the years to come.
At the same time, technological breakthroughs in computing power give birth to new technical concepts. New strategies based on the speed of execution and lower and lower time frames have been quite a success.
But despite all these, classic technical concepts survived the test of time. Moreover, the likelihood that they will still be around in the years to come is considerable.
Because most of the technical concepts involve human behavior and element, the market moves will always be affected by actions dictated by greed, fear, or despair.
While the focus today seems to be on speed and technical indicators, some traders still use trading theories for interpreting the overall market. Who knows what the future brings?
One thing is for sure: technical analysis has gained traction since the birth of financial markets and evolved in time with more approaches coming to the surface. Expect the trend to continue in the years to come.
However, technical analysis alone is not enough to successfully trade financial markets. Fundamental analysis plays an equally important role, even for technically oriented traders.
