
666
Classic technical analysis patterns belong to the Western approach and include both reversal and continuation patterns. So far, in this section of our trading academy, we’ve introduced technical analysis and discussed basic notions such as trends, types of trading charts, double and triple bottoms, and the head and shoulders pattern.
A pattern recognition approach provides traders with trades that respect sound money management rules. As you saw in the previous article, a pattern recognition approach leads to trades exceeding a 1:2 or even a 1:3 risk-reward ratio. That’s good enough even by the highest trading standards.
In this article, we move further into the area of pattern recognition by introducing ascending and descending triangles, flags, and pennants as continuation patterns. We’ll also add to the reversal patterns by discussing one of the most powerful ones: wedges.
All these patterns have a measured move. That’s good enough to use them to build a trading plan in each situation.
What’s even more interesting is that all the patterns in the classic technical analysis in Forex have the same rules regardless of the timeframe they appear on. In other words, you can use the rules of trading classic technical analysis patterns both on lower timeframes (e.g., five-minute charts) and bigger ones (e.g., daily, weekly, monthly).
The only difference is that the volume traded increases as the time frame decreases, and similarly, the volume traded decreases the higher the timeframe is. This way, traders don’t end up risking more of their trading account on any given trade.
As usual, we’ll look at the patterns one at a time and provide plenty of examples so that everyone understands them. There’s a big difference between theory and practice, so make sure to keep an open mind when searching for patterns like these on the currency market.
Ascending and Descending Triangles
As a rule of thumb, if the market consolidates, it’ll most likely form a triangle. A triangular pattern is the most common way for the market to consume time.
Imagine any possible reason the market might consolidate, such as waiting for the decision of a central bank on rates or release of the Non-Farm Payrolls (NFP), and the pattern most likely to form is a triangle.
Triangles have a long history in technical analysis. Ascending and descending triangles are basic patterns, but this subject has been covered extensively by many generations of traders.
You may consider ascending and descending triangles just an introduction to the world of triangular patterns. Later in the trading academy, when we dive into the secrets of the Elliott Waves Theory, you’ll see triangles are a big part of it. Triangular patterns are key to understanding the Elliott Waves Theory, so the ascending and descending triangles presented here set a good base for it.
The first thing to keep in mind when interpreting ascending and descending triangles in Forex trading is that they form against a horizontal base. The price puts pressure against the horizontal base, building energy until it eventually breaks it.
Naturally, the base acts as support during a bearish trend and as resistance during a bullish one. When acting as support, the base is the main element of a descending triangle. Similarly, when acting as resistance, the base represents the main element of an ascending triangle.
Interpreting Ascending and Descending Triangles
The names of the two patterns tell you everything about their inherent expectations. A descending triangle suggests further descent to come. It implies a bearish trend already exists, and the trend will resume after the horizontal base gives way.

The critical part of a descending triangle is, again, the horizontal base. Focus on it because you’ll rarely find a perfect horizontal base when trading triangles. Because of the currency market’s high volatility, traders consider areas rather than fixed levels.
Besides the horizontal base, the legs of the triangle reveal a lot about its structure. By legs of the triangle, we mean the bounces or swings up during a descending triangle’s formation.
Ralph Elliott, who developed the Elliott Waves Theory, defined a triangle as having no fewer and no more than five legs or waves, which are different from market swings.
The image above shows five market swings, and if the price breaks the horizontal line, each market swing will represent one leg of the triangle. Elliott established further rules for trading triangles, calling them corrective waves and assigning the first five letters of the alphabet to label them.

If we connect the a-c and b-d points, the triangular formation becomes obvious. Between the two trendlines, the b-d trendline is far more critical. It shows the end of the triangle, and it implies that the bearish trend has resumed.
How to Trade Ascending and Descending Triangles
Just like all patterns in classic technical analysis, ascending and descending triangles have a measured move. To find it, simply measure the length of the most extended wave (always the a-wave) and project that from the horizontal base. That is the minimum distance the price must travel to confirm the continuation pattern.

Ascending and descending triangles always form a series of higher lows (ascending triangles) and lower highs (descending triangles) for the a, c, and e waves. For this reason, any trade resulting from an ascending or descending triangle must have the stop-loss order at the end of the smallest wave – the e wave.
Proper risk-reward ratios apply in this case, too. Look for 1:2, with ascending or descending triangles rarely providing larger ratios. The explanation comes from the relatively small measured move. If the 1:2 RR ratio falls outside (beyond) the measured move, book half the profits at the 1:1 ratio, move the stop-loss order to the break-even level, and stay for the final target with the remaining position.

This is theory – how about practice? Let’s have a look at an example, this time considering an ascending triangle. We’ll apply the identical principles, only this time, we’ll look for the price to break higher after the ascending triangle.
Practical Example of Trading an Ascending Triangle
The USDJPY pair had a rough start to the year. It collapsed in January 2019 on the back of the U.S. also equities correcting. The two usually have a direct correlation, moving up and down together.
However, buyers quickly stepped in and sent the pair higher. The vicious dip was retraced rapidly, and the price kept pushing higher, this time against a horizontal base.
It took the ascending triangle more than a week to form, so no serious currency trader had an excuse to miss it. It’s just that, as the chart below shows, the pattern has a unique shape, quite different from the textbook definition of an ascending triangle.

Nevertheless, it respects all the rules. The five legs (labeled here as a, b, c, d, e) push against a horizontal base, forming a series of higher lows on every dip on the points a, c, and e.
By the time the price broke above the b-d trendline, surpassing the horizontal base, it had triggered a long trade. As the rules of trading an ascending triangle say, the risk, or the stop-loss, is the distance from the horizontal base to the lowest point in the smallest leg of the ascending triangle, the e wave.
Projecting the measured move, we see that the 1:2 risk-reward ratio falls beyond the end of it. In this case, the conservative approach to trading tells us how to apply the money management system: book half the profits by the time the price reaches the 1:1 risk-reward ratio, move the stop-loss to the break-even level, and keep the rest for the target. In this example, the price did reach the final 1:2 target, albeit in a problematic way.
Rising and Falling Wedges
Bullish or bearish trends might be formed if wedges signal a trend’s exhaustion. Simply put, the price has a hard time advancing or declining, and a reversal is imminent.
However, wedges do not always act as reversal patterns. Sometimes the price seems to reverse, only to quickly move in the opposite direction. We will cover that situation here as well as in more detail later in this trading academy when we deal with the concept of a running triangle with the Elliott Waves Theory.
Traders refer to rising wedges as “falling” and falling wedges as “rising.” The names come from the shapes of the wedges – the way the pattern looks.
Have a look below. This is how a rising wedge looks. Since a rising wedge is actually falling, it signals that the bullish trend in place is about to end, and a reversal will follow.

This is how the price action looks during a rising wedge’s formation. While advancing, it forms only marginally higher highs, followed by lower lows. In a falling wedge, the opposite price behavior is seen: The price keeps forming lower lows and lower highs, albeit marginal ones.
The shape of the wedge becomes evident if we connect the higher highs and the higher lows, revealing why the pattern bears the name “wedge.”

The numbers help us identify the market swings needed for the wedge to be completed. Five segments make up a wedge, and traders often refer to the wedge as the shape that defines the price action between the 1-3 and 2-4 trend lines.
Almost all wedges (not absolutely all of them, though) pierce the 1-3 trendline before breaking the 2-4 one. As it signals the end of the reversal pattern, the 2-4 trendline is the most important one.
How to Interpret Rising and Falling Wedges
A wedge starts way before the first higher high (labeled as 1 in the image above) becomes evident. As a rule of thumb, the first segment is the longest and has a key role in defining the trading strategy after the wedge formation. If the first segment weren’t the longest, the wedge pattern simply wouldn’t exist.
Obviously, wedges form on all currency pairs and all timeframes. That means that when a wedge appears on a big timeframe (e.g., 4h and beyond), traders have plenty of time to see it and plan the next step.
It is tempting, albeit dangerous, to try to trade the wedge before it breaks the 2-4 trendline. However, as humans, all traders have different personalities, and every person has a different risk appetite. Some traders thrive and perform better in riskier environments. Therefore, there are two approaches to trading a wedge: a riskier one and a conservative one.
Before explaining the two approaches, let’s say a few words about the 2-4 trendline. It is, by far, the key element in a wedge’s formation. It shouldn’t be pierced by the price action until the wedge ends.
In other words, not even between the 2-4 points should the price action pierce it. Sometimes, though, due to the high levels of volatility experienced in the currency market, that does happen. Therefore, a bit of flexibility when interpreting the 2-4 trendline never hurts.
One more thing about the 2-4 trendline: Once the price manages to break it, it usually comes back and retests it. A retest acts as a reinforcement of the pattern, but it’s not a mandatory condition.
The Prudent Approach to Trading a Wedge
The conservative or prudent approach requires patience. That’s especially true if the pattern forms on bigger timeframes. As traders want quick profits, it’s easier said than done. Patience is a virtue, and in this case, waiting for the price to confirm the pattern is critical.
Several steps confirm that the price has completed a rising or falling wedge. First, the price pierces the 1-3 trendline. Then, it breaks the 2-4 trendline. Finally, it moves below (in the case of a rising wedge) or above (in the case of a falling wedge) the end of the fourth segment. That’s the entry.
Traders should set their stop-loss order at the highest (in a rising wedge) or lowest (in a falling wedge) point of the wedge. As for the take-profit, the usual risk-reward ratio of 1:2 works this time too. Remember, this is the conservative approach, and many traders that fall into this category also move the stop-loss order to the break-even level once the price reaches the 1:1 ratio and/or book half of the profits.

Wedges do not have a measured move per se, but traders use two targets to confirm a wedge. One is the 50% retracement of the entire wedge pattern, including its longest segment. The second one is the full retracement of the wedge pattern.
Considering that wedges appear at the end of trends, usually as the last attempt of the price to reach new highs or lows, a full retracement of the wedge is not inconceivable. In fact, it happens quite often.
The Aggressive Approach to Trading Wedges
Aggressive traders accept higher risk, but they do so expecting a higher reward, too. Therefore, it is no wonder that the risk-reward ratio, in this case, exceeds 1:2, with traders settling for a minimum of 1:3.
When using this approach, traders don’t know if the pattern will end up being a wedge, nor do they know when the wedge will end. They just assume, based on the price information offered by the first four segments, that the market is forming a wedge.

When the price pierces the 1-3 trendline, that’s the entry point. To set the stop-loss level (the risk), traders should measure the distance from the end of the fourth segment to where the fifth segment touches the 1-3 trendline for the first time.
The next step is to project that distance from the entry point. In the case of a rising wedge, traders project the distance to the upside. In the case of a falling wedge, they project it to the downside.
For the reward, the same distance is projected three times in the opposite direction: to the downside in the case of a rising wedge and to the upside in the case of a falling wedge. For the assumed risk to make sense, aggressive traders always remain in the trade until the price reaches the final target.
Examples of Wedges on the Currency Market
The recent EURJPY price action offers a perfect example of a falling wedge and the implications of trading it using these two approaches. We see the market forming a beautiful falling wedge, with all the rules respected:
- The 2-4 trendline is clean, with no piercing until the price breaks it.
- On the last attempt downward, the price pierces the 1-3 trendline, as often happens.
- After the price breaks the 2-4 trendline, it comes back for a retest, reinforcing the pattern.

The chart above shows how to trade such a pattern using the conservative approach. Wait for the price to exceed the highs in the fourth segment, measure that distance, use it as the risk, and project it two times to the upside to discover the reward. By the time the price reaches one time, the risk, book half the profits, move the stop-loss to the break-even, and stay for the original target with the rest of the position.
We can see that the price has just reached the 1:1 RR ratio, meaning conservative traders have already booked partial profits and are now just waiting for the price to reach the final target or to get out of the trade at break-even. In the meantime, with the free margin obtained by booking half of the profit, traders can focus on other trades with similar potential.
A Practical Example of Trading a Falling Wedge Using the Aggressive Approach
The aggressive approach calls for entry when the price pierces the 1-3 trendline. The chart below shows the risk calculated by measuring the distance from the end of the fourth segment to the 1-3 trendline.
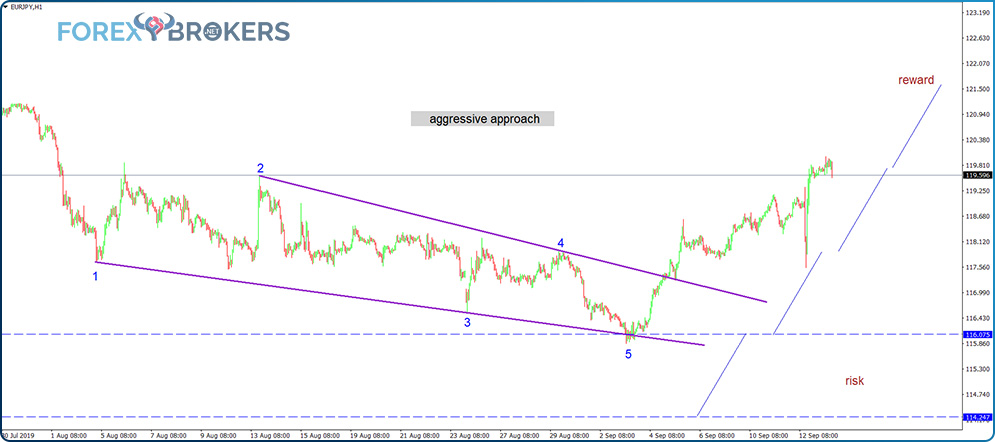
Next, the risk is projected from the entry point three times to the upside to obtain the 1:3 RR ratio. As the chart shows, the price has already reached the 1:2 RR ratio, so the aggressive approach has worked well up to this point. In fact, both approaches to trading this wedge have proved to be excellent trades, as there was little or no drawdown after either entry.
Bullish and Bearish Flags in Technical Analysis
A flag is a continuation pattern. It forms during the central part of a rising or falling trend, and the price action that follows the flag formation shows the trend resuming.
A flag has two elements. One is the pole or the price action before the consolidation area. The other one is the flag itself or the consolidation area.
Obviously, traders do not know what the market will form until the consolidation begins. In a flag, the price consolidates between two parallel lines, evolving either on the horizontal or against the primary trend. The more horizontal the consolidation is, the more powerful the pattern is.

A flag’s measured move is the length of the pole projected from its highest point (where the consolidation starts in a bullish flag) or its lowest point (where the consolidation starts in a bearish flag). Many traders project the measured move from the moment the price breaks the consolidation, but that can be disrupted by the price, making a false breakout. Therefore, the proper way to trade a flag is to wait patiently for the entry point.

How to Trade Bullish and Bearish Flags
The problem with flags is that no one knows how long the consolidation will last. It may continue for quite some time without any breakout in sight.
Therefore, the best way to trade flags is to use pending orders. In the case of a bullish flag, traders place a pending buy-stop order to buy from the highest point of the pole, and in the case of a bearish flag, the pending sell-stop order is set at the lowest point of the pole.
In the case of flags, there’s no need to set a risk-reward ratio. That may sound strange, but ALL flags offer a risk-reward ratio more significant than 1:2, far bigger in some cases.
If you ever see a flag with a target given by the measured move that’s not enough to cover the 1:2 ratio, that’s not a proper flag formation. You should ignore trading it!
But if you do see that the price consolidates in a tight range, why not take advantage of the range and scalp for as long as the consolidation continues? This way, you make the most of the range and get ready for the imminent breakout.
Trading the Flag Pattern
As mentioned above, the risk-reward always exceeds the 1:2 ratio. To set the risk, traders use the lowest point in the flag’s consolidation. As we can see below, it almost reaches the 1:3 RR ratio, more than enough for any sound money management system.

Trading the Range of a Flag
While the approach presented above is less risky, trading the range of the flag is for the more aggressive traders. Just like in the case of wedges, these traders like having a contrarian opinion on the market.
The thing to do is to split the channel into two equal parts. In a bullish flag, divide the lower part further into two equal parts. Buy the lower section of the upper edge of the original channel with a stop-loss at half the original channel’s distance projected to the downside. The problem with this approach is that the RR ratio barely exceeds 1:1, which is far too small for many traders.
However, when the market is not moving, as is often the case, it may be just enough to get the ball rolling until the flag breakout comes.

Examples of Flags on the Currency Market
Trading a flag depends very much on the timeframe. Bigger timeframes, such as weekly or monthly, offer plenty of opportunities to trade the range on the lower timeframes.
For example, upon identifying a flag pattern on the monthly or weekly charts, go to the lower timeframes, like the hourly, and use the range-trading technique presented above. For flag patterns forming on smaller timeframes, range trading has little chance of working due to algorithmic trading and the extreme volatility during vital economic data releases.
The example below comes from the USDCAD pair. On the weekly timeframe, the pair formed a bearish flag.

Note the strong bearish trend before the flag’s formation. That’s the measured move projected from the lowest point before the flag’s formation. It took the market a while to reach the measured move, but it did.
Some traders also use the element of time when trading flags. This refers to considering the duration of the price consolidation in the flag’s formation and projecting that on the right side after the flag ended. The measured move should come in less time than it took for the flag to form.
The above example proves that the element of time doesn’t bring value in all setups. If it were used in the USDCAD weekly case above, traders would have missed out on a big portion of the profits.
Pennants in Technical Analysis
A pennant is a continuation pattern in Forex trading that resembles a flag. The only difference between a pennant and a flag is that the consolidation area during a pennant’s formation takes way less time than for a flag.
In other words, the trend is so strong that the price pushes aggressively during the consolidation. It so happens that many times, the price action until the pennant is almost a vertical line, a condition that remains in place after the break of the pennant.

Pennants usually form a triangle during their consolidation. In most cases, the price builds up energy to break, and the breakout is very aggressive. Symmetrical triangles often develop during a pennant’s formation.
For a pennant to form, the market typically is caught on the wrong side. Upon realization, a strong rally starts, and a triangle forms due to a decrease in volatility (Asian session coming) or the price waiting for pending news.
A curious thing to note here: Aggressive price action or rallies do not form strong trends. Strong trends continue relentlessly, with the market forming lower lows and lower highs or higher highs and higher lows again and again. Complacency does appear, but that’s not a quick and robust breakout.
Countertrend moves have strong rallies. That’s especially true in bear markets, with traders even having a saying that bear market rallies are very aggressive.
The element of time plays a crucial role in interpreting a pennant. The target, or the measured move, must come in less time than it took for the pennant to form.
How to Trade a Pennant
When trading a pennant, traders use both the measured move (in price) and the element of time. If the time expires and the price doesn’t reach the measured move, traders close the position. The two, therefore, go hand in hand, with the pattern failing if the price doesn’t respect the element of time.
Simply take shape or a line or whatever your trading platform offers and measure the consolidation. Next, project it on the right side of the chart after the breakout. That’s the time limit for the price to reach the measured move.

Another thing to consider is the risk-reward ratio. A pennant always has a risk-reward ratio bigger than 1:2. If there’s a pattern that resembles a pennant but has a lower RR ratio, the chances are that the price will form something else in the end.

The entry point is the highest point in the pennant, and an appropriate stop-loss order is at the lowest point in the triangular pattern. Rarely does the price try for the stop-loss after it breaks higher, thanks to the characteristics of a pennant (the price builds up energy to break). However, when that does happen, the pattern is NOT a pennant and, instead, most likely the developing phase of another, more complicated pattern.
Practical Example of Trading a Pennant
In the currency market, pennants do not form that often. In the last few years, especially with the rise in automatic trading and so much political uncertainty (Trump, the U.S.–China trade war, tariffs, etc.), the market has consolidated quite a lot.
Therefore, the chances that the price action forms a pennant are slim. However, they do appear and, when properly identified, result in significant profits.
When a pennant is forming, traders don’t know that a pennant is forming. All they know is there is a violent move followed by a consolidation that maintains the same bias. The breakout is so powerful that it resembles the movement before the consolidation.

A pennant formed on the EURUSD daily chart some time ago. It was after Trump won the U.S. presidential election and Macron won in France.
Macron’s win in France caused a gap in all the Euro pairs. The markets opened the next Monday with a gap higher, as the new French president, a young personality, had a pro-euro agenda.
The Macron gap is still open at the time of this writing, but that’s another story. Shortly after the gap, the price exploded upward. Followed by a quick consolidation resembling a symmetrical triangle, all the prerequisites of a pennant were in place.
The two white boxes in the chart above show the element of time. Upon the moment of the breakout, the race began to reach the measured move in the expected time. If the time expires and the price doesn’t reach the target, simply get out of that position. As it turned out, the EURUSD pair reached the take-profit level quite fast, respecting the element of time.
Check out our video on basic technical analysis patterns:
Classic Technical Analysis Patterns – Serving Traders for Market Prediction
Newcomer
Classic Technical Analysis Patterns – Serving Traders for Market Prediction
Conclusion
The patterns presented in this article complete the basic technical analysis concepts. While some of them look simple, don’t be fooled. Their efficiency has stood the test of time, and active traders can make a living simply by trading classic technical analysis patterns.
Some new charting software has appeared in the meantime. Applied to a chart, it identifies patterns automatically, like head and shoulders, pennants, triangles, wedges, and so on. All that remains is for traders to check the rules to see if the patterns respect them and trade the patterns accordingly.
The most significant advantage of classic technical analysis patterns is that they all offer high risk-reward ratios. Therefore, it is easy to set and use money management rules when trading basic technical analysis patterns.
Speaking of that, you’re probably wondering what the complex patterns are if the ones presented here are just basic. By the time we begin the Elliott Waves Theory and dive into more details, you’ll notice the difference between these patterns and the more complex ones (double and triple combinations, flats with failures, double and triple zigzags, and so on).
Moving forward, we’ll remain on the technical analysis side of trading, discussing the concepts of support and resistance. Still, basic technical analysis concepts, support, and resistance help traders identify the possible places where the market might react in the future.
Successful trading is about odds and probabilities. When entering a trade without a plan, the odds are the price will reach the stop-loss order. But when entering a trade with a plan that gives sound risk-reward ratios, the probability that the trading account will grow rises. This is why basic technical analysis concepts have survived the test of time and will continue to do so for as long as financial markets exist.
Related Lessons


See more from this category