The previous article dealt with the different types of charts that exist today, with an emphasis on the two main areas where technical analysis has evolved: the Western world and Japan. Basic technical analysis patterns belong to the classic technical analysis approach.
Also known as the Western approach to technical analysis, the classical technical analysis approach has sparked the imaginations of many generations of traders. Pattern recognition was and remains suitable for technical forecasting, regardless of the type of market (stocks, currencies, bonds, and so on).
Our journey through the pattern recognition approach begins with two patterns every trader has heard of: double and triple tops and bottoms and the head and shoulders pattern. Every technical analysis book dealing with the subject includes them as mandatory for those studying classic patterns. For this reason, we can’t forgo them in our trading academy.
As always, the article’s focus remains on examples of everything that we discuss. The idea is that there’s a big difference between pattern recognition in theory and practice.
This is especially true if we consider volatile markets like the currency market. When prices move fast due to increased algorithmic trading activity, the rules of some patterns established a long time ago don’t hold down to the last detail.
For this reason, traders must “bend” the rules a bit, though, without interfering with the overall meaning and intended interpretation. Obviously, there’s a thin line when doing that, and this is one of the points this article makes.
Classic technical analysis patterns have a long history. At a time when the personal computer (PC) didn’t even exist, traders noted that prices tended to form similar activities before continuing in the same direction or reversing. Traders documented the conditions, and this is how reversal and continuation patterns appeared.
Double and Triple Tops and Bottoms – The Classic Technical Analysis Reversal Patterns
The name of the patterns speaks for itself. Effectively, the price fails two or three times at the same market level. As a rule of thumb, the double and triple tops and bottoms form at the end of trends only.
Therefore, traders refer to them as reversal patterns. The price tries to break resistance (in the case of top formations) or support (when the patterns form a bottom) but consistently fails.
While based on a relatively similar concept, the two patterns differ. Some particularities do exist (e.g., the triple bottom or top pattern resembles a triangular formation), and for this reason, we must treat them as separate.
You must know before anything that the double top or bottom is more powerful than the triple top or bottom. The name is misleading, and many retail traders tend to put more trust in a reversal signaled by a triple top or bottom. However, the double top or bottom is more reliable.
We’ll treat the two patterns as identical, so it’s easier for you to understand the differences between them. As such, for both double and triple tops and bottoms, we’ll cover the following:
- rules for the patterns
- how to set the measured move
- how to trade the patterns
As always, we’ll look at some examples of different currency pairs and timeframes. The idea is for you to get acquainted with what the patterns look like in the currency market, as the reality differs from the patterns described in textbooks.
Double Tops and Bottoms – Rules
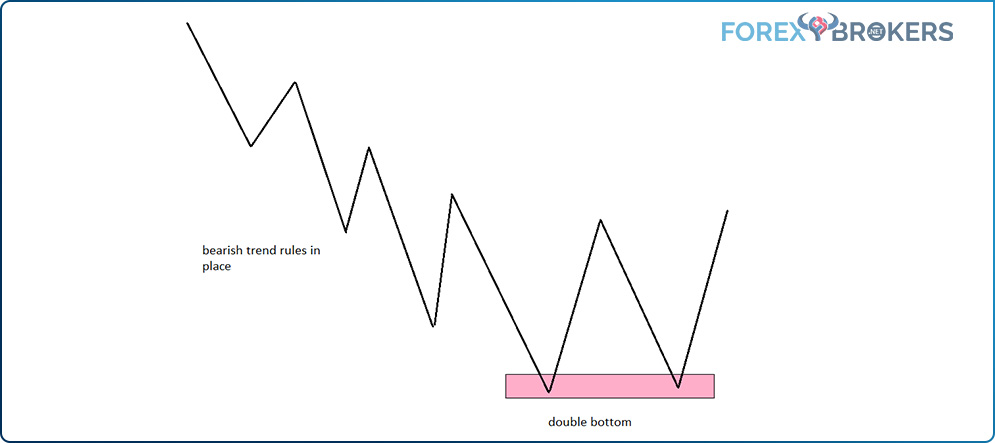
The first thing to remember about double tops and bottoms is that they form at the end of trends. Therefore, any similar pattern forming during a trend does not fall under this pattern.
Second, the patterns have a distinct appearance. Think of two letters of the alphabet, M and W, when trading double tops and bottoms.

Third, before the M or W, the rules for a trend must exist. More precisely, look for an extended series of higher highs and higher lows before the M formation or a series of lower lows and lower highs before the W formation.
Finally, keep in mind that due to the high volatility in the currency market, the patterns cover an area, not a precise level, where the price makes a turning point.
Setting the Double Tops and Bottoms Measured Move
All classic technical analysis patterns have a measured move. One typical point of confusion for retail traders is interpreting the measured move as the final target after the pattern’s formation. That’s a mistake.
In fact, the measured move is just the minimum distance the price must travel. In other words, it acts as a confirmation that the pattern is in place, especially in the case of a double top or bottom. As such, many traders add to an already opened position or use the measured move as an entry point for a longer-term perspective trade.
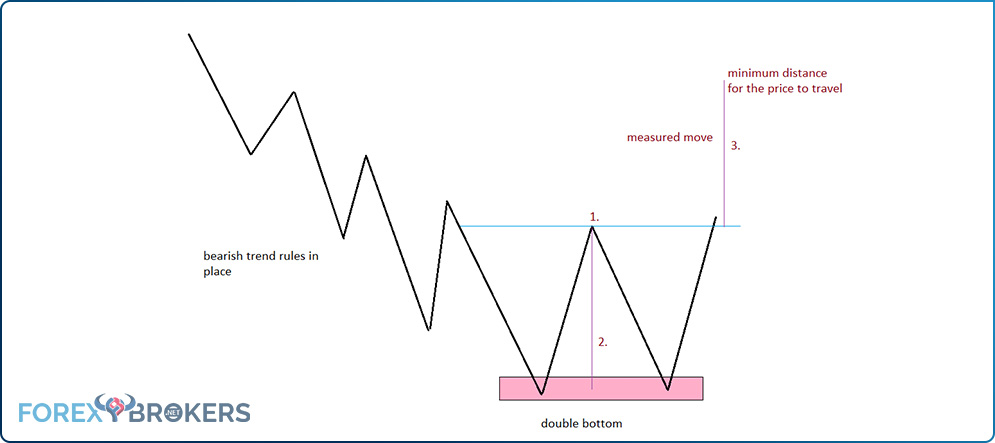
Three simple steps give you the measured move. First, use a line to delimitate the M or W area. Drag the line marking the dip or bounce between the two tops or bottoms.
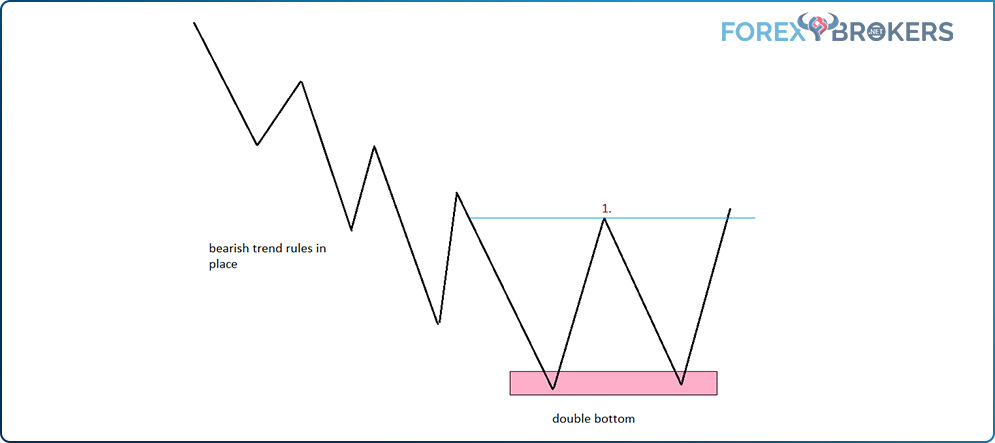
Second, measure the distance from the line to the double top or bottom. Remember to adjust for the area and not a precise level.
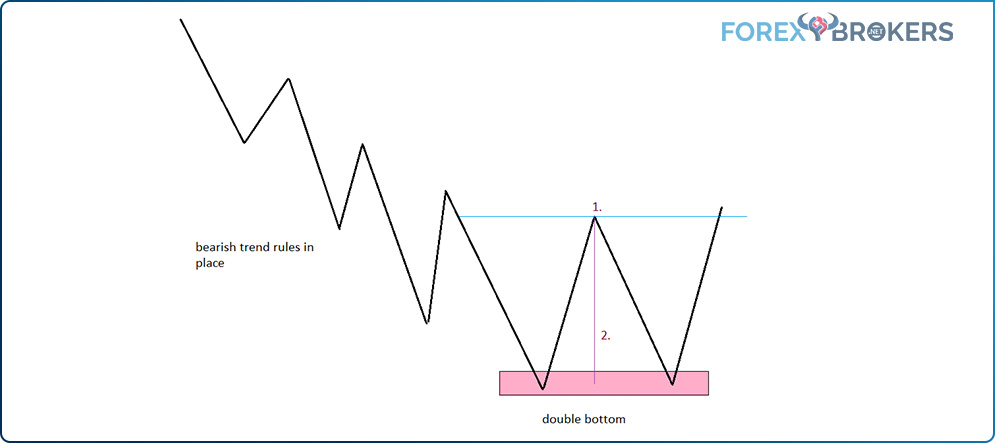
Finally, project the distance from the line drawn in the first step. This is the measured move and represents the minimum distance the price must travel to consider the reversal pattern to be in place.
Practical Examples of Double Top and Bottom Formations
Patterns like this are everywhere. Forming on all currency pairs and spread on all timeframes, double tops, and bottoms reward disciplined traders.
The rule of thumb says that the higher the timeframe, the more rewarding the pattern. That makes sense if you consider that the two patterns form against resistance and support, respectively. As is the case with support and resistance, the market has a hard time breaking them when they form on higher timeframes.
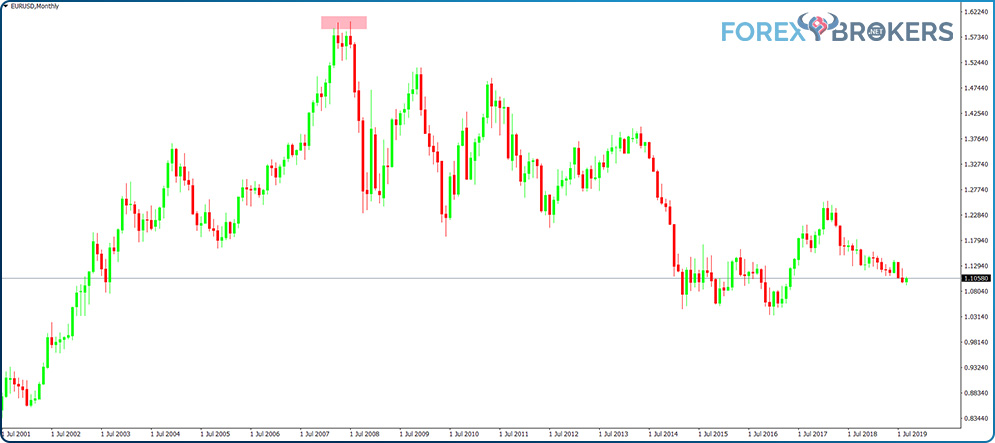
One of the most famous double top formations in the currency market formed on the EURUSD pair. The most popular pair among retail traders, the EURUSD put a top around the 1.60 level when the 2008 financial crisis started.
Here’s the double top on the monthly chart, showing the sharp reversal that followed. After that moment, the EURUSD never again traded at such high levels, highlighting the importance of the double top formation on bigger timeframes like the monthly chart.
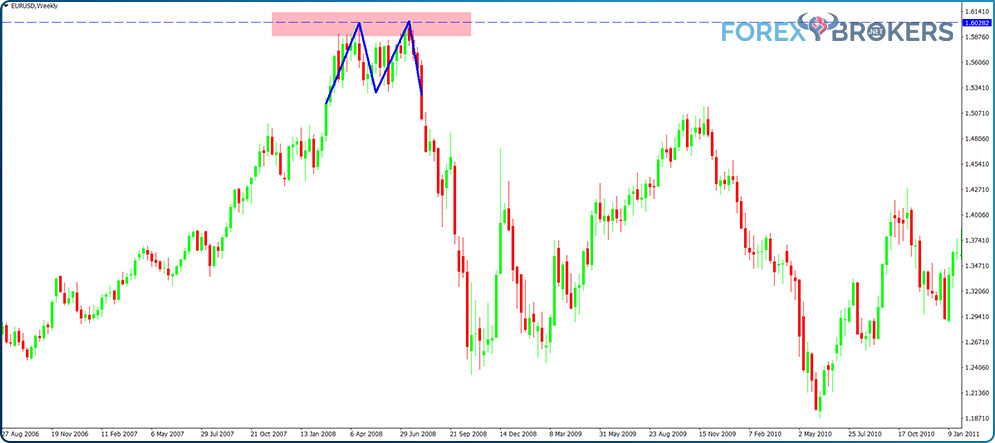
If we zoom in and take a closer look at the pattern, we can clearly see the M formation marking it. This shape should be evident in all double top patterns; otherwise, the market is forming something else.
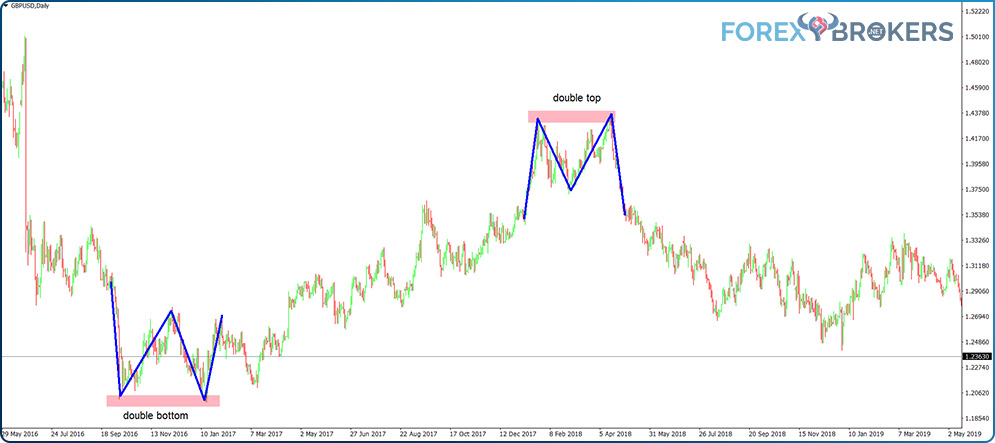
As mentioned earlier, the double tops and bottoms form on all timeframes. Here’s an example illustrating the two patterns on the same chart, the daily GBPUSD.
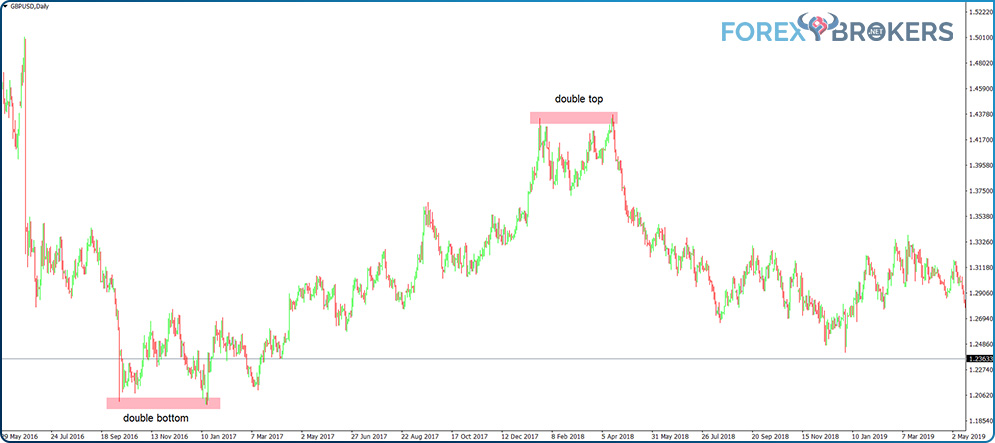
After the 2016 Brexit vote (the sharp, bearish, vertical move on the left side of the chart), the pair collapsed from 1.50 to around 1.20. However, a double bottom formed before a bullish trend began.
Then, the bullish trend ended with a double top in the same timeframe. Traders had an easy time identifying the W and M shapes corresponding to the two patterns.
How to Trade Double Tops and Bottoms
All trades must have a take-profit and a stop-loss order. After all, these two orders are part of the mandatory trading plan for taking a position on the market.
The reward (the distance from the entry-level to the take-profit) must exceed the risk (the distance from the entry-level to the stop-loss order). Later in the trading academy, we’ll cover the importance of money management and how risk-reward ratios help traders manage the funds in their trading account better.
The bigger the reward when compared to the risk, the better. The result, or the risk-reward ratio, tells us the likelihood of the trading account surviving the test of time.
Double tops and bottoms offer great trading setups. The minimum recommended risk-reward ratio when trading Forex is 1:2. That basically means that for every pip risked, the trader aims to gain two.
The measured move helps define the trading plan. As already shown in this article, the measured move represents the risk projected from the entry-level. Doubling that distance gives us our desired 1:2 risk-reward ratio.

Triple Tops and Bottoms – Rules
When compared to double tops and bottoms, triple tops and bottoms incorporate one more attempt to break the resistance or support area. For this reason, they do not form as often as double tops and bottoms.
They also resemble a triangular formation. Because they form against a horizontal base, traders often confuse them with ascending or descending triangles.
A few things must happen when the market forms a triple top or bottom. First, a bullish or bearish trend must be in place. If not, the market is most likely forming a triangle, not a reversal pattern.
Second, the inability of the market to break the resistance or support area three times in a row says a lot about the trend’s weakness. After the third attempt at a high or low, the focus shifts to the previous swing in the opposite direction. A break there triggers more continuation, with traders focusing on the measured move.
Finally, the measured move sets the minimum distance for the market to travel. Just like with double tops and bottoms, the measured move also helps define the optimal risk-reward ratio.
Practical Examples of Triple Top and Bottom Formations
Triple tops and bottoms don’t appear as often on charts as many traders think. Many times, it seems like the market is forming a triple top or bottom, only for the price to reverse again and break the resistance or support. In that case, the market formed in a triangular pattern instead.
Because triple tops and bottoms look like double tops and bottoms, we won’t focus too much on these patterns. The chart below shows both a triple top and a triple bottom forming on the daily EURGBP timeframe, with the price trying three consecutive times at the highs and lows, respectively, before reversing.
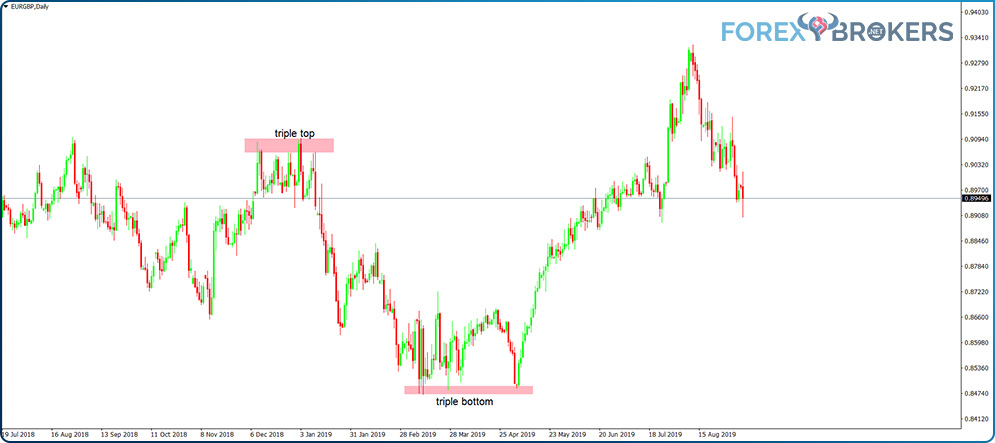
This makes it more evident that the reversing place is an area and not a certain level. The market tries to break through, fails, and then reverses sharply.
How to Trade Triple Tops and Bottoms
In a similar fashion to double tops and bottoms, triple tops and bottoms offer impressive risk-reward ratios. Again this time, the measured move acts as the minimum distance the price must travel to consider the move a reversal.
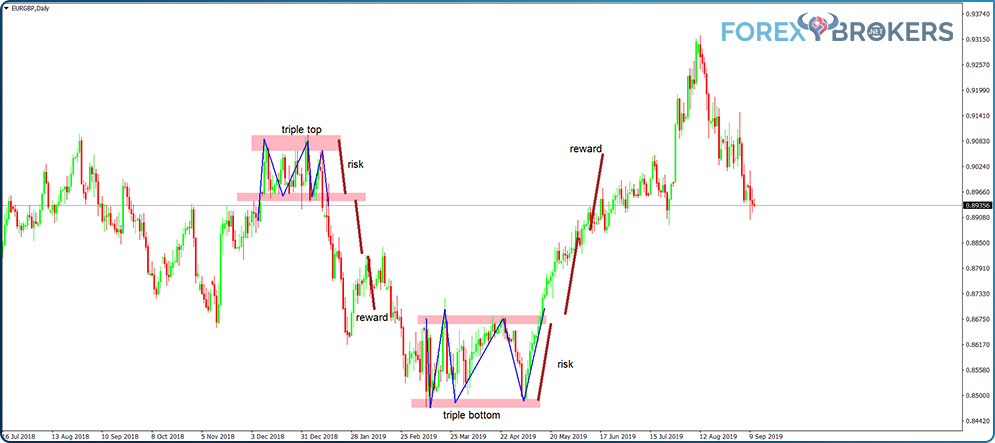
Here are the steps for setting up a trade based on a triple top and bottom, using the EURGBP examples from earlier:
- clearly define the area for the triple top or bottom
- use a horizontal area to mark the swings between the three tops or bottoms
- measure the distance between the two horizontal areas (that’s the measured move)
- project the measured move below (after a triple top) or above (after a triple bottom) the break of the horizontal area
- target double the measured move as the reward for the trade, with a stop-loss order at the highest point in a triple top pattern or the lowest point in a triple bottom pattern
Traders, conservative and active alike, don’t like to wait with the entire position for the price to reach the target. Therefore, they often book half of the profit by the time the price reaches the 1:1 risk-reward ratio (i.e., when it reaches the measured move), place the stop-loss order at the break-even level for the other half, and stay for the reward.
Triple Tops and Bottoms – Why They Trick Many Traders
One of the things every trader knows is that “triple tops or bottoms rarely hold.” Yes, there’s actually a saying among savvy traders that such patterns rarely hold.
It isn’t common for the market to try three times to break the resistance or support area. In fact, the ability to come back for the third time and try to break the area is a sign of strength rather than weakness.
Reading this, you may wonder why these patterns exist and why they are relevant for currency traders if they don’t quite work. Well, as the chart above shows, they do work to the extent that all trades must follow strict money management rules.
Having said that, traders should favor the conservative approach to trading a triple top or bottom. After all, if the patterns rarely hold, it might be wise to assume a conservative approach when trading them.
Another thing to consider is that the price action almost always forms a triangle instead of a triple top or bottom. In the few cases that differ, the swing lower (after a triple top) or higher (after a triple bottom) isn’t that strong.
For instance, have another look at the chart above. The trade derived from the triple top did work in the sense that the 1:2 risk-reward ratio was realized. However, the price eventually reversed and exceeded the resistance area given by the triple-top pattern.
Does this always happen? No, but it happens often enough to paint a picture of what the price might eventually do.
The Head and Shoulders Pattern
Another reversal pattern, the head, and shoulders, is also a classic technical analysis pattern. A complex pattern, it takes a lot of time to form and brings a lot of confusion to even the most experienced traders.
The thing is that traders have no indications that such a pattern is forming all the way until its very last section. By the time the head and shoulders pattern becomes evident, the pattern has almost ended.
One thing to remember when interpreting head and shoulders patterns is that all traders know them. Therefore, when an obvious pattern forms on a bigger timeframe, sometimes the standard interpretation doesn’t work. It’s not that head and shoulders patterns never work on bigger timeframes, but sometimes the market invalidates them when they’re too obvious.
For this reason, just like in the case of double and triple tops and bottoms, having a stop-loss order is mandatory when trading the head and shoulders pattern. That helps traders remain in the game and protects their capital.
Like with any reversal pattern, the head and shoulders pattern appears at the end of both bullish and bearish trends. When forming at the bottom of a bearish trend, traders call the pattern an inversed head and shoulders. It looks like this:
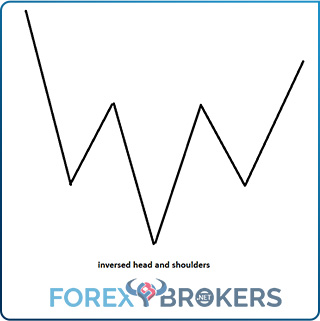
On the left side, a robust and bearish trend must exist. Then, the price bounces, forming a lower high, just as is the case during bearish trends.
Another push follows, with the price putting in a lower low. So far, it appears to be a bearish trend (a series of lower lows and lower highs), and no one suspects a reversal pattern.
The first sign that a reversal might occur appears when the price action of the lower low is quickly retraced. Another consolidation follows, and the market eventually reverses.
Head and Shoulders – Elements
A head and shoulders pattern has the following elements:
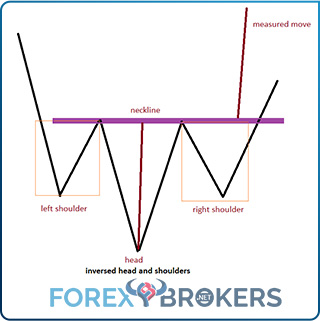
- left and right shoulders
- head
- neckline
- measured move
The interpretation of the head and shoulders pattern depends very much on the five elements above. Textbooks always show the head and shoulders pattern forming on a horizontal. However, as you’re about to find out in this article, the volatility of the currency market twists the patterns into uglier ones. In fact, the “uglier” the head and shoulders pattern is, the most likely that it’ll work, and the resulting trade will end up profitable.
How to Draw the Head and Shoulders Neckline
A controversial subject, the neckline of the head and shoulders pattern defines it. It is perhaps the most critical element when interpreting the reversal pattern.
Not all necklines are horizontal. The image above shows the ideal head and shoulders formation with a horizontal neckline. While such head and shoulders patterns do form, the likelihood is that you won’t see them very often on the currency market.
Many traders tend to draw the neckline to connect the highest points (in an inversed head and shoulders) in the left and right shoulders. It’s not that this approach is incorrect, but most traders use candlesticks charts, which can make this approach tricky from time to time.
Imagine candlesticks with huge upper shadows forming on the left and right shoulders of an inversed head and shoulders pattern. The presence of these shadows indicates tremendous pressure to the downside, and drawing the neckline from the top of the candlesticks would be a mistake.
The neckline is an important part of determining the measured move. If traders don’t draw it correctly, the resulting measured move won’t represent the head and shoulders pattern.
When drawing the neckline on a candlesticks chart, try to ignore the candlesticks’ shadows. Instead, a better approach is to draw the neckline to connect the real bodies of as many candlesticks as possible.
In the next section, we’ll look at how to draw the neckline for a representative measured move. As always, practical examples offer a better perspective of how a pattern looks.
Interpreting the Measured Move of a Head and Shoulders Pattern
This is the weekly EURAUD chart. At one point in time, the cross pair moved in a strong, bearish trend. The price action on the left of the chart shows an interrupted series of lower lows and lower highs.
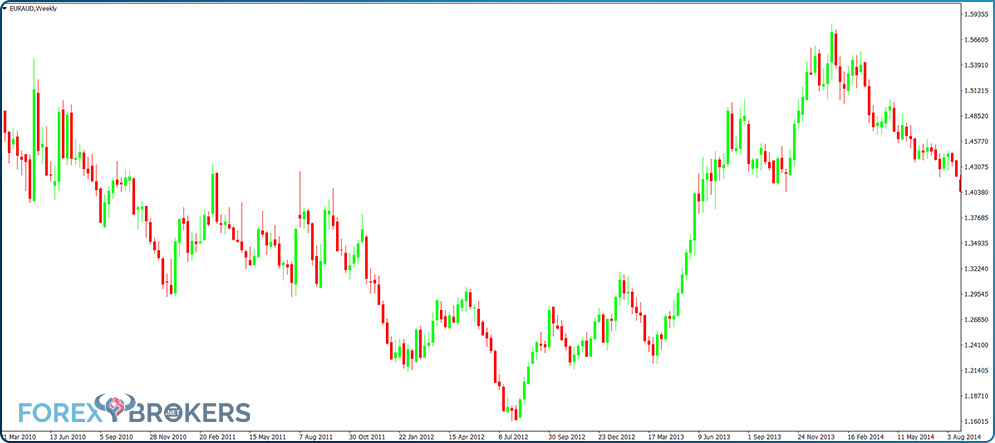
Remember that traders don’t know the price action on the right side of the pattern until it forms. Only after the head’s formation does the inversed head and shoulders pattern become apparent.
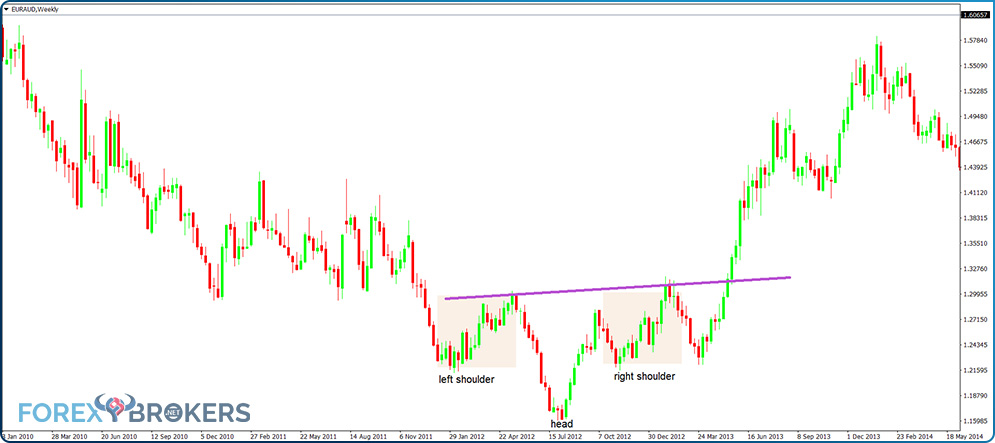
At this point, you should focus on the neckline. There are a few things that can help you better understand how to use it. First, take note of the two highest swings during each shoulder’s formation. The neckline connects the real bodies of the candlesticks that create the highs in the two swings. It doesn’t connect the absolute highs.
Second, it isn’t horizontal. It has an upward angle, but still, the inversed head and shoulders on this chart resemble the classic textbook examples. Some of them are even uglier, as we’ll see later.
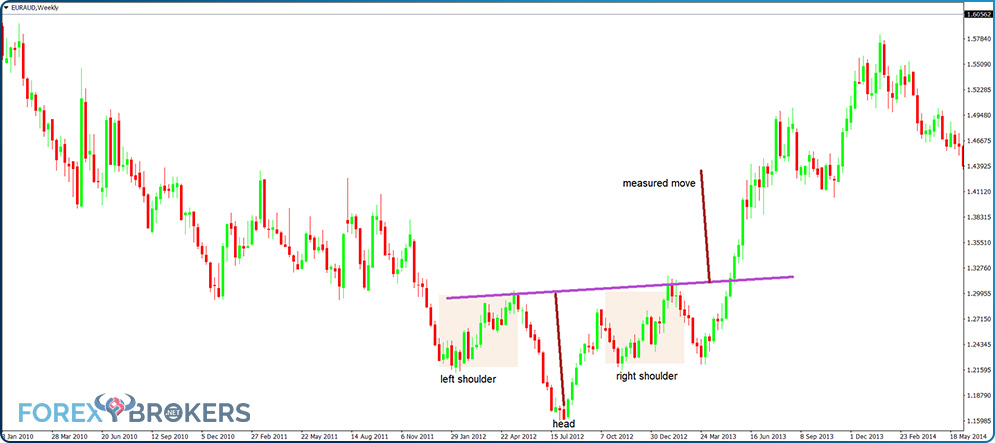
The measured move for the pattern is the distance from the head to the neckline projected from the neckline. As is the case with double and triple tops and bottoms, it shows the minimum distance for the price to travel before a reversal pattern can be confirmed.
To correctly draw the measured move, traders must consider both the neckline and the head of the pattern. First, take a line and measure the distance from the neckline to the head. Do NOT measure the lowest point in the head but rather the “empty” space between the neckline and the candlesticks that form the head.
Second, make sure the measured move forms a right angle on the neckline. This is vital, as otherwise, the measured move will have a different size depending on how close it is to the horizontal.
Practical Examples of Head and Shoulders Formations
We’ll use the inversed head and shoulders pattern we just showed that formed on the weekly EURAUD as well as a new example, one on the USDCAD pair, that formed right at the top of a strong rally.
Now that you know the elements, it’s time to learn how to make the most of them or, more precisely, how to trade the head and shoulders pattern for the best results.
The main issue with the pattern is time. Imagine the EURAUD pattern we showed, which is on a weekly timeframe. Each candlestick there represents one week. In other words, the two consolidation areas take quite some time.
We can discount the consolidation during the formation of the left shoulder. After all, no one knows at that point that a head and shoulders pattern will form.
However, by the time the price retraces, the move corresponding to the head and begins consolidating again, time is an issue. For some traders, though, the consolidation on the right shoulder is one of the most critical elements when trading the head and shoulders pattern.
Here’s a quick guide of all the steps to follow when trading a head and shoulders:
- wait for the head’s price action to be quickly retraced
- draw the neckline according to the rules we listed
- measure the time it took the left shoulder to consolidate and project the outcome upon the start of the right shoulder
- project the neckline from the lowest area (in an inverse head and shoulders) containing the real bodies in the left shoulder
- use the projection to forecast entries on the right shoulder
- use the element of time to make an educated guess about when the price might end the consolidation on the right shoulder
How to Trade the Head and Shoulders Pattern
Now let’s use the rules above to interpret and trade an inversed head and shoulders. First, draw the neckline and the measured move. We already did that earlier.
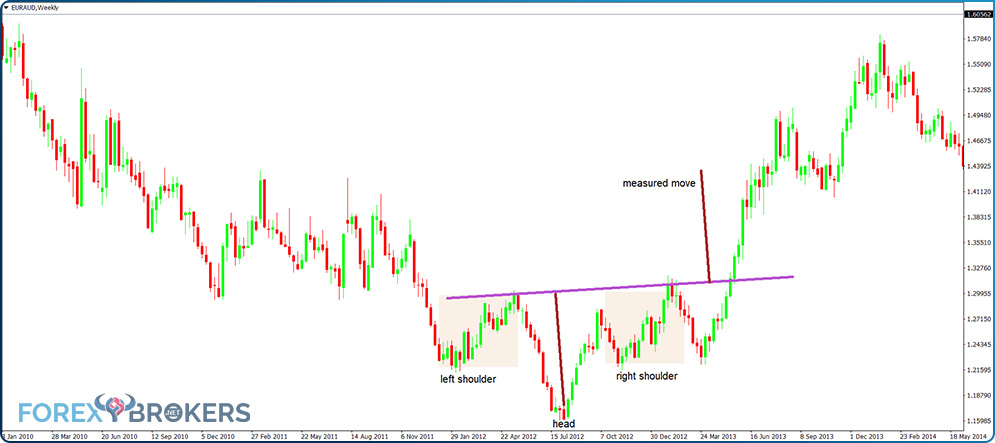
Second, measure the time it took the price to consolidate on the left shoulder. Done, as marked on the chart above. Next, project it onto the right shoulder – done.
Moving forward, copy the neckline such that you respect its essential characteristics (mainly the angle) and project it from the lowest real bodies on the left shoulder.
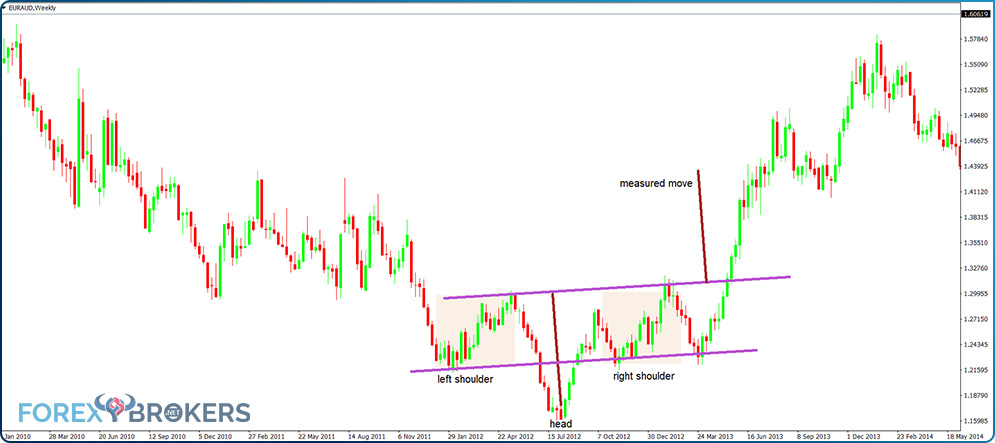
This indicates the right time to enter a trade when the market consolidates on the right shoulder. On the chart above, the first time the price tests the projected neckline is not a valid entry on the long side. How come? A close look reveals that we could draw the neckline only after that dip, so it wasn’t possible to know its angle (and therefore use it in our analysis) earlier. But the second dip into the projected trendline is valid. That’s the entry into a long trade.
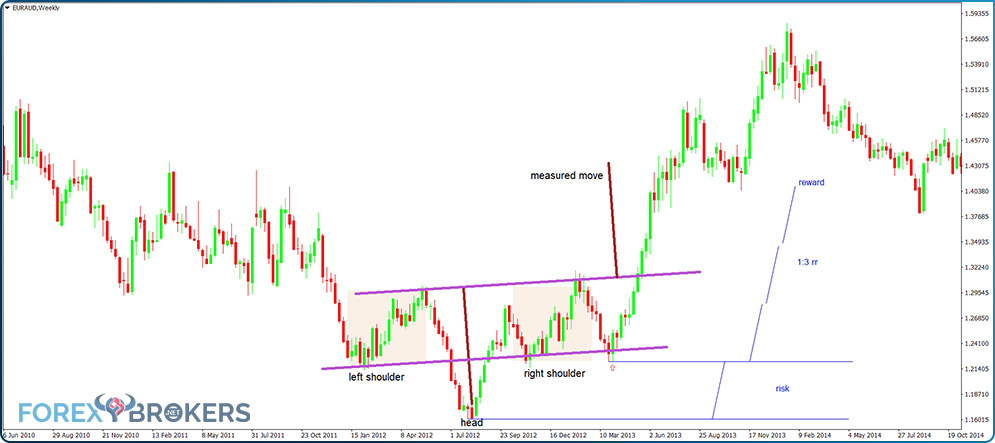
Always set the stop-loss order at the lowest point of the head’s price action when the market forms an inversed head and shoulders pattern. Using the rules described here, the resulting long trade-up to the measured move ends up offering a magnificent 1:3 risk-reward ratio. That means that for the risk assumed by going long, the reward exceeds it by a factor of 3:1. A 1:2 risk-reward ratio is already outstanding by all standards, so anything bigger than that serves to reward a good trading plan appropriately executed.
Another Head and Shoulders Example
The EURAUD example we’ve shown looks similar to the standard pattern. However, the currency market often forms patterns difficult to interpret as head and shoulders.
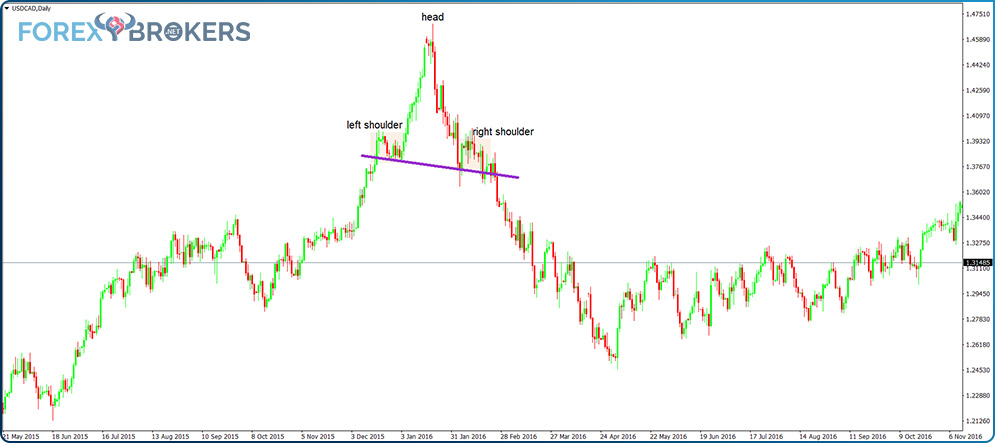
Take this USDCAD daily chart, for example. The price rose a few years ago when the oil market tanked from $100 to below $30.
Because CAD has a direct correlation with the price of oil, the drop in the price of oil caused an immediate drop in CAD. Hence, USDCAD moved higher with little or no pullbacks.
However, the last swing-up was quickly retraced. The price then paused and consolidated around the same level as the consolidation before the attempt at the highs. That’s when a possible head and shoulders appears.
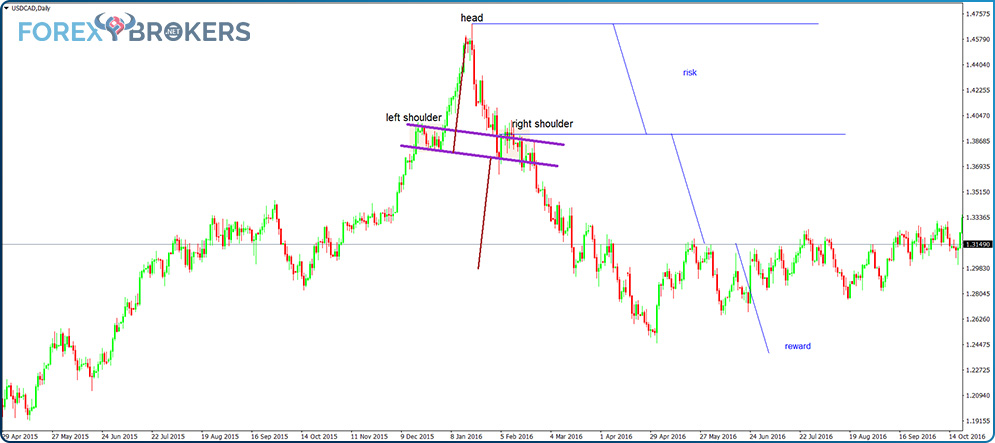
Following the same rules of trading for the head and shoulders pattern described earlier, the setup looks like the picture above. There are a couple of different things to note this time, though.
The first thing to note is that the left and right shoulders have very tight ranges. The amplitude during the price formation is insignificant.
It’s not that is something wrong with that, but the trade (a short trade this time) requires a bigger stop-loss. Automatically, that means that the price needs to travel much more to reach the measured move and, accordingly, the reward.
Another thing to note is that by the time the price reaches the measured move, it merely makes a 1:1 RR ratio. That’s not enough for disciplined traders, as it reduces the odds of surviving in the currency market in the long run.
In the previous example, the price reached a 1:3 risk-reward ratio before the target set by the measured move. In this case, the measured move is not enough.
- Adjusting the Trading Plan
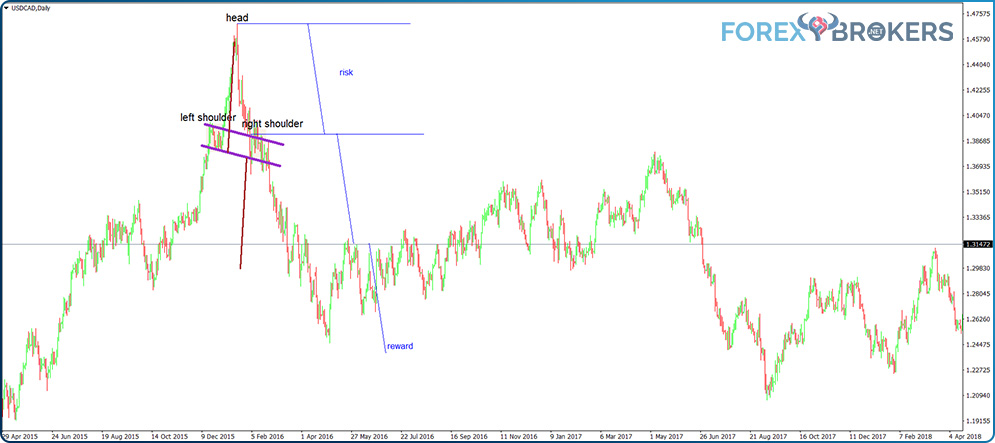
The logical thing to do in this case is to change the trading plan. First, wait for the price to reach the 1:1 RR ratio and the measured move.
Next, book half the profits and lower the stop-loss order to the break-even level, protecting your capital from a possible reversal. Finally, wait for the 1:2 RR ratio, but don’t continue waiting after that. Because the 1:2 ratio falls outside the measured move’s range, looking for higher ratios makes no sense.
As it turns out, the 1:2 level did come, albeit after a long time and only with half a position active. However, one may simply argue that the margin freed from the trade was used successfully in other trades, thus making up for the opportunity cost lost.
Check out our video on these patterns:
Tips and Tricks when Trading the Head and Shoulders Pattern
Because of the various shapes they take, head and shoulders patterns give different results. As shown in this article, we can’t use the same risk-reward ratio for all of them.
Here are some tips to help you make the most of any head and shoulders pattern:
- Look for the price to retest the neckline after it breaks – while not mandatory, if it does, that’s a confirmation of the previous support becoming resistance, which reinforces the short side (in the case of a head and shoulders pattern forming at the end of a bullish trend).
- The more similarities between the left and right shoulders, the better.
- Look for the amplitude on the right shoulder to match the one on the left shoulder.
- If the right shoulder matches the consolidation time of the left shoulder, that’s a reinforcement of reversal conditions.
- If the consolidation on the right shoulder takes much longer than the one on the left shoulder, take it as a warning that the market will form something else instead of a reversal pattern.
Conclusion
Slowly but surely, we’ve dived into the fascinating world of technical analysis. We’ve covered here two of the basic, classic technical analysis patterns – double and triple tops and bottoms and the head and shoulders pattern.
They both give birth to great trades. Because the patterns are derived from pure price action, they form on all timeframes.
Simply trading such patterns on different timeframes is enough for a trader to succeed. The condition is, of course, that the trader has mastered them and integrated a money management system that allows the account to grow. The risk-reward ratios needed for trade are only one part of such a system. We’ll discuss this subject in detail in another article in this academy.
To sum up, the double and triple top and bottom pattern and the head and shoulders patterns form at the end of trends. Therefore, as reversal patterns, they have the great advantage of offering the possibility of an early entry. On the other hand, their most significant disadvantage is that they take a lot of time to complete.
Still focusing on basic technical analysis patterns, the next article covers different concepts like ascending and descending triangles, flags and pennants, and rising and falling wedges. This way, you’ll have a full picture of the classic technical analysis patterns and how they work in the 21st century.


