
425
Our readers are probably familiar with concepts such as economic recessions, depressions, contractions, and expansions. The last 2 decades brought one of the most severe economic recessions – one caused by the Great Financial Crisis in 2008-2009, and another by the COVID-19 pandemic. Therefore, not only did we hear about economic recessions, but most of us lived through at least one.
While the Great Financial Crisis, caused by the housing market in the United States, impacted only some economies, the pandemic caused recessions or downright contractions in all economies. For example, the Great Financial Crisis affected most of the developed world, but had little or no impact in Asia-Pacific – Australia, New Zealand, and Singapore did not record an economic recession.
The point is that various economies around the world expand or contract at different times, if we exclude the extreme case of a pandemic. The explanation comes from the theory of the business cycle, which states that aggregate economic activities of nations grow following a pattern – a cycle.
Imagine a chart with a rising trendline. Let’s say that an economy has grown by 10% in the last 5 years, according to the rising trendline. But the growth rate varies – some years may witness an economic contraction, others a recession, and so on.
Yet, the recessions and expansion cross below and above, respectively, the main growth line. Therefore, while the economy grew by 10% in the last 5 years, it may have experienced at least 1 recession or contraction.
This is the basic principle of the business cycle and from this simple concept, the world’s economists have built a full theory. I’m sure many of our readers have heard of cyclical and non-cyclical companies – companies with business-cycle sensitivities. This article covers all the phases of the business cycle, and also the cyclical and non-cyclical industries and how to interpret them.
What Is a Business Cycle – Definition
The very definition of a cycle means that something is “on repeat.” In other words, the phases are repeating.
In a way, the business cycle reflects the way a trader or investor manages to grow an account. If the account grows from A to B, it does not do that in a straight line, but with ups and downs, reflecting both the winning and the losing trades.
The same is true for an economy. The business cycle reflects all the booms and busts in an economy, and even if it grows, the economy does so with ups and downs.
In 2020, the world’s economies were hit by a severe contraction. When this happens, traders also refer to the phenomenon as a recession or depression.
By March, the stock markets around the world dived into the fastest bear market ever. The move lower was so quick that it triggered the circuit-breakers (i.e., safety measures in place to limit the drop) on most American indices.
Fast forward 1 year, and most advanced economies are poised to grow in 2021. In other words, the bottom of the business cycle was reached and economic projections show that most of the developed economies will regain the pre-pandemic growth level by 2022.
By the time that happens, the economies will be above the growth trend, although they registered an economic contraction in 2020 and a good part of 2021. The phenomenon is explained via the theory of the business cycle.

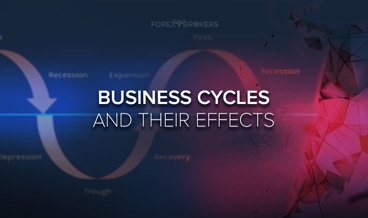
The image above shows a basic representation of the business cycle. The rising black line represents growth, a stable trend, while the cycle crosses above and below the trend, depending on what phase of the cycle an economy is – peak, contraction, trough, or expansion.
The Phases of a Business Cycle
A full understanding of the theory of the business cycle is important for investors, especially for investors in the currency market. Macroeconomics is key to global investing and not all economies are in the same phase of the business cycle.
Therefore, if an investor masters the business cycle, being able to correctly identify where in the business cycle an economy finds itself, it becomes relatively easier to divert the funds where most of the growth is. For example, an investor who believes that Asian economies are at peak may decide to sell short the Asian currencies and invest in currencies of other economies in a different phase of the business cycle.
The theory of the business cycle has some assumptions that are important to know in advance. One of them is that the business cycle is recurrent. Another one is that the business cycle affects just certain parts of an economy, but all sectors and industries.
Each phase of the business cycle has some characteristics that offer clues to help investors identify the phase. As always, the economic data and behavior of both consumers and businesses tell much about where an economy is in the business cycle.
Factors like inflation, business spending, general economic activity, consumer spending, and unemployment are critical in the analysis of the business cycle. Therefore, economic data to watch expands to the labor market participation rate, retail sales, core inflation, changes in long-term employment, average hourly growth rate, and much more.
We will start with the peak of the business cycle, but before going into more detail, the reader should know that intermediate phases exist as well. For example, before the peak, an economy experiences a so-called boom period, where economic growth accelerates at an extremely rapid pace. Or, during the expansion phase, there is an intermediary growth phase, and so on.
Peak
At the peak of the business cycle, there are few signs that an economic contraction follows. Yet, some economic indicators, the leading ones, point to a decline in economic output and offer clues about what is to come.
Right at the peak, inflation accelerates to extreme levels. Because most central banks have a mandate that targets a certain inflation level, the accelerating inflation usually exceeds (or comes closer to) the central bank’s target. In recent years (i.e., the last decade), most central banks in advanced economies had a problem delivering higher inflation close to their target, but nevertheless, inflation accelerates close to the peak of the business cycle. So, that is one clue or sign to look for.
Another clue comes from an unexpected indicator – employment. The unemployment rate is a lagging indicator, and for this reason it will continue to fall while the economy comes closer to the peak. But businesses slow the rate of hiring, and the unemployment rate, while still falling, does so at a slower pace.
It is very important for policymakers to try to avoid as much as possible a so-called “hard landing.” Hard landing refers to an economy that grows extremely fast, at an unsustainable rate, and then drops even faster.
Finally, while economic activity continues to increase, as measured by the growth in the GDP, it does so at a decelerating pace. To sum up, close to the peak of the business cycle, the unemployment rate continues to fall, albeit at a slower pace, the GDP grows but not as it did during the expansion phase, and inflation rises the most.

Contraction
The peak represents the top of the business cycle. After the economy tops, contraction follows, characterized by a decline in GDP and rising unemployment.
It is truly easier to exemplify the contraction phase because in the last decade, 2 recessions have hit major economies in the world. One of them, in fact, has affected the entire world – triggered by the COVID-19 pandemic.

The GDP drops as a result of decreased economic activity, and households’ savings rate increases. The bigger the uncertainty, the higher the savings rate and the longer the recession will take.
As mentioned earlier, there are various types of contractions, depending on how much the GDP shrinks. We can have a mild contraction, a severe contraction, also known as a recession, and a depression, which is a prolonged recession.
In a contractionary phase, investors run from risky assets, such as the stock market, and find refuge in the safety of government bonds. Also, some non-cyclical businesses we will discuss later in the article are attractive for investors, especially those that have a predictable future cash flow.
Naturally, the unemployment rate rises during an economic contraction, but again, with a lag. Employers are reluctant to fire people because human capital may be costly to replace in the future. However, the more the contraction persists, the unemployment rate will eventually pick up and businesses will lay off their employees.
Trough
The business cycle typically turns when pessimism is at extreme levels. At this point in the business cycle, all eyes are on the leading economic indicators.
Guess which is one of the best economic indicators closely watched by investors all over the world during a recession? The stock market.
When the stock market declines 20% from the top, it is said that it enters bearish territory. Just the opposite happens when it rises more than 20% from the bottom – it enters bullish territory.
The stock market is a leading economic indicator because it reflects investors’ optimism. Higher optimism leads to higher stock market prices and, eventually, the savings rate declines as consumers start spending their extra savings accumulated during the recession.
It is said that the stock market leads the turn of the business cycle by 6 months or so. If we look at the most recent recession, the one triggered by the COVID-19 pandemic, the stock market bounced from the lows in April 2020, and by the end of the year the US economy had posted positive economic growth for the last 2 quarters.
The wealth effect generated by the stock market refers to the fact that higher equity prices induce consumers to spend more as they see their wealth increasing. Therefore, the economic recession lasts for less time with rising stock market prices.
The trough forms right before economic expansion, and pessimism dominates. After the economy turns and posts positive growth for 2 consecutive quarters, it is said that expansion has started.
Expansion
When the expansion phase starts, no one knows how long it will last. At first, economic activity stabilizes before it starts to grow. As mentioned a bit earlier, when the GDP grows for 2 consecutive quarters, it is official – the economic expansion has started. Remember that the stock market by this point should be in bullish territory, i.e., it should have already bounced back from the lows by more than 20%.
The housing market is one of the first to signal the return to economic growth. The housing sector is key to economic growth because it influences local businesses and stimulates economic growth.
Let me give you an example. Imagine a reviving housing market suggested by leading indicators such as a rise in building permits issued.
Regardless of whether it is a greenfield or a brownfield project, construction companies hire workers locally. Furniture is needed down the road as well. Even for existing home sales, new owners typically improve the house by adding new features or by renovating and painting. All in all, the communities benefit on the horizontal from a strong housing sector, and, in the end, the entire economy.
Inflation, however, will not rise as easily as many may think. In this phase, inflation remains moderate and may continue to fall.
Perhaps our readers find it easier to understand why central bankers fighting the COVID-19 pandemic argue that it is better for inflation to be higher than lower for economic growth. While to many such a statement makes no sense, in reality, higher and rising inflation toward the central bank’s target suggests that the economy has left the trough of the business cycle and the expansion started. The sooner the inflation rises, the better.
Boom
Expansion has 2 sub-phases: early and late expansion. The latter, also known as a boom, forms right before the peak of the business cycle. It is at this point in the business cycle that the limits of economic growth are truly tested.
As such, qualified workers are scarce and companies start contracting headhunters to fill difficult positions. One strategic mistake that often occurs during the boom phase is that some businesses may decide to borrow capital to increase their production facilities, and that is a crucial mistake as investments in long-lived assets take a long time to be depreciated.
Overtime hours are on the rise during late expansion as businesses begin hiring in full. Inflation picks up notably and rises at a faster pace.
The Cycle Repeats
The phases of a business cycle repeat as the economy goes through busts and booms. There is not a certain time length for each phase – an economy may remain in expansionary territory for many years, such as the Australian economy, which experienced its longest economic expansion of over 3 decades before ending with the COVID-19 pandemic.
At the opposite end, the economic recession triggered by the pandemic was the shortest on record. As such, the phases of the business cycle have different time lengths.
Nevertheless, the corrections and expansions form below and above the sustainable growth rate. It becomes obvious that the better the businesses anticipate the turns in the business cycle, the easier it is to maximize shareholders’ wealth.
The same is valid for traders and investors. The more accurate they are at pinpointing the peaks and troughs of the business cycle, the more their investments will benefit.
In a way, picking the tops and bottoms of a business cycle is like picking tops and bottoms using technical analysis. Both approaches are in contrast to what happens in the economy and the markets, and yet, they are extremely rewarding should the forecast be right. Also, just like trend trading in technical analysis, some fundamental investors may prefer only the expansionary phase of the business cycle; basically, they ride the growing economic trend.
Multiple theories of the business cycle exist, with fans all over the world to date. Every economist has heard of John Maynard Keynes, but only few may be aware that one of the most well-known theories of the business cycle is named after him as he offered economic solutions for each phase of the cycle. Other theories exist as well, but the Keynesian is one of the most famous.
Cyclical vs. Non-Cyclical Industries
Now that we know what a business cycle is and its phases, it is obvious why traders and investors must know what phase of the cycle an economy is in. Therefore, all attention is on leading economic indicators and how to spot the peaks and troughs.
If we do not account for the pandemic, when literally all economies in the world entered recession, different economies are in different phases of the business cycle. As such, investors use available macroeconomic data to analyze and interpret economies in order to spot the phase of the business cycle. At the end of the analysis, capital flows in various parts of the world as a consequence.
This is why, throughout history, we have seen periods when Asian economies suffered a recession while Western economies did not. Or, when Japan entered deflation, while other economies did not.
The point here is that macro traders use macro data to analyze economies from a top/down approach and invest capital as a result of their beliefs. How to invest and what to invest in, that is a different story. There are so many different financial instruments to use that literally everything is possible. One may decide to sell a currency short on the belief that one economy is about to contract and another is still in the expansionary phase. In a way, traders and investors using macroeconomic data to invest use fundamental analysis to find arbitrage opportunities around the world.
In the stock market, some companies follow the business cycle religiously, while others don’t. Therefore, by correctly identifying them, investors may protect their interests better.
Cyclical Companies
When a company’s profits are strongly correlated with the strength or weakness of the overall economy, it is said that the company is cyclical. More precisely, it means that it follows the business cycle, reflecting the periods of booms and busts.
Therefore, traders and investors have a mission to correctly identify the type of the company in order to diversify their portfolio accordingly. A critical aspect of diversification is to find that point where the portfolio would benefit in both recessions and economic expansions.
One characteristic of cyclical companies is that their products and services are quite expensive when compared to products of non-cyclical companies. For instance, think of a car manufacturer in comparison to basic services such as a grocery store. Regardless of the business cycle’s phase, the grocery store will continue to function without fluctuations in demand. However, the car manufacturer will see sales drop in recessions, and rise during economic expansions.
While not a rule for all of the companies in a sector, certain sectors tend to experience greater sensitivity to the business cycle. For this reason, investors need to distinguish between different industries and sectors and properly label a company as cyclical or non-cyclical.
Examples of Cyclical Sectors
Manufacturers of capital goods are companies with high sensitivity to the business cycle. Think here of durable goods, or goods with a high life expectancy, typically longer than 3 years. In this category, we may include automobiles, appliances, airplanes and computers. There is even one metric that measures the durable goods industry, a monthly release in the United States. As such, by monitoring the changes in durable goods, investors may have an idea about the phase of the business cycle.
Another example comes from the consumer discretionary sector. In this category, we can include companies that sell consumer-related products and services. For example, hotels and restaurants belong to this sector.
It makes sense to think of it in terms of the 2020 COVID-19 pandemic. As the recession took over the world, hotel and restaurant businesses suffered the most. Economies around the world contracted as people did not travel and so the business cycle affected the consumer discretionary companies.
Non-Cyclical Companies
Also called defensive companies, non-cyclical companies experience less sensitivity to the business cycle. It is not to say that there is zero sensitivity, but typically such companies do a better job of surviving during recessions than cyclical companies.
Tobacco companies, beverage companies, and companies that sell food and personal care products fall into this category. Utility companies also fit the description of a non-cyclical company.
Besides defensive companies, growth companies also belong to the non-cyclical category. When thinking of growth, imagine a company that belongs to an industry in such a strong growth phase that an economic recession is not enough to alter its growth. Sure enough, the company may experience slower growth rates, but the recession will not stop its growth.
The tech industry is representative in this sense. When the COVID-19 pandemic hit in 2020, the tech sector and the Nasdaq 100 index were among the fastest to recover, and many stocks even hit a new all-time high, growing at a faster pace than other companies.
Why Should Investors Care About the Business Cycle?
Knowing the phase of the business cycle is crucial for traders and investors. Economic data released daily, weekly, monthly, or quarterly helps to identify where the economy is going next.
Leading indicators, in particular, are very useful in correctly identifying the state of the economy and if it is in a recession or expansion. Lagging indicators also prove to be useful, although they act more like confirmation indicators than contrarian ones.
To exemplify, think of the unemployment rate and the stock market – the former is lagging, the later is leading. They both serve the same purpose, but the timing is different. Also, while the unemployment rate is similar to a trend indicator, the stock market acts more like a contrarian indicator.
Let’s start with the unemployment rate. In a recession, when the unemployment rate declines, the economy has already been contracting for some time. The definition of economic recession or contraction is that the economy must have a minimum 2 quarters of economic decline. Typically, investors wait for the GDP data for 2 consecutive quarters to see if a recession or contraction has started.
But that is a process that takes a long time. The GDP is released some thirty days after the end of the quarter, which means that investors need to wait 7 months before having confirmation that the economy is contracting or expanding. Therefore, the GDP, while providing accurate information, lags the actual movements in the economy by over half a year. The same is true for the unemployment rate.

In sharp contrast, the stock market is a leading indicator, and a contrarian one at the same time. It is said that it leads the business cycle by 6 months or so. Therefore, a sharp rise in the stock market during an economic recession is not unusual, as it hints to the end of the recession and the start of a new expansionary phase.
Different Phases of the Business Cycle in Different Parts of the World
Fundamental analysis is based on a top-down approach. Investors look at different economies around the world and interpret their “fundamentals”.
Armed with the result of their analysis, they decide if an economy is growing, contracting, or just consolidating current levels. The next decision is how to allocate the capital in such a way as to profit the most.
For currency traders, most macro-trades are based on fundamental analysis. The idea is to buy undervalued currencies and sell overvalued ones, and the best way to do so is to interpret the phases of a business cycle.

Every trader and investor has a different approach, but there are some things to consider before deciding which phase of the business cycle an economy is in. If you want, traders have a checklist and simply collect the data and then draw a conclusion regarding the phase of the business cycle.
Naturally, in some parts of the world the economy may be in recession, in other parts in expansion, and even the growth and contraction rates may differ. As such, there is always an opportunity to invest either at the peak of the business cycle, by selling the currency or the stock market, or at the bottom of a recession, by buying the currency or the stock market.
Eurozone’s Leading Index
A previous article part of this trading academy presented the leading, coincident, and lagging indicators. They serve the purpose of identifying the phases of the business cycle so that the investor can easily deploy capital where it can produce bigger returns.
Therefore, one checklist may be formed by a combination of these indicators, such as the change in unit labor costs, consumer expectations for businesses and economic conditions, or the change in the number of employees on non-agricultural payrolls.
But some parts of the world, or economies, have different names for the same indicators. The only thing that the investor must know is what the indicators represent.
Take, for example, the eurozone. The leading index in the eurozone is composed of 8 different components: the future business activity index for the services sector, the M2 money supply level, the economic sentiment index, residential building permits, the stock market, manufacturing PMIs, capital goods orders and an interest rate spread.
Let’s think of an economy in an expansionary phase and what these indicators should show. In an economic expansion, the stock market should already have been up and running for more than 6 months. A bullish market, as explained earlier, is defined by the stock market rising more than 20% from the recent lows. Also, the manufacturing PMIs should be steady above the 50 level, the level that distinguishes between a sector’s contraction or expansion.
Moreover, capital goods orders should be up and running as well, meaning the cyclical industries are growing at a nice pace. Finally, the investor may want to see a tightening interest rate spread.
Japan’s Leading Index
The eurozone leading index was just an example, but many others exist. For example, the Japanese leading index has ten components, most of them identical to the ones seen in the eurozone, such as the interest rate spread, the M2 money supply, or the stock market prices.
However, some particularities specific to the Japanese economy do exist, such as dwelling units started, business failures, and the 6-month growth rate in labor productivity. Also, the Tankan survey is key in assessing the performance of the Japanese economy over time.
While leading indices exist for almost all countries, in some cases, like for countries in emerging and frontier markets, it is difficult to find centralized data. As such, traders and investors build specific lists of economic data to analyze and interpret in order to identify the correct phase of the business cycle.
Using Cyclical and Non-Cyclical Companies to Diversify a Portfolio
A portfolio is easily diversified by holding both cyclical and non-cyclical companies. During economic expansion, the growth companies in the non-cyclical sectors will outperform the average economic growth. Also, cyclical companies will grow in line with the economic expansion.
On the other hand, during economic contractions, the non-cyclical or defensive companies will help balance the portfolio. If we add to the mix the dividend-paying potential as well as the possibility to sell short or buy currencies in different parts of the world where economies are in different phases of the business cycle, it becomes obvious that diversification benefits may be easily obtained.
Conclusion
Interpreting economic data is straightforward, but interpreting the timing of a specific phase of the business cycle is difficult. For this reason, at the turn of the cycle, contrarian investors are usually “alone” in their thinking.
Yet, by correctly interpreting the business cycle, investors have the chance to position on the right side of a trade. Even if it takes a while for the economy to turn around and for the central banks to adapt the monetary policy, being on the right side of a trade is always more desirable than being on the wrong one.
The business cycle, with all its phases, proves that economies grow despite recessions and contractions occurring all the time. Because of that, the theory of the business cycle is the cornerstone of fundamental analysis and of actively managed portfolios. Moreover, the theory of the business cycle helps to properly diversify portfolios over different assets and parts of the world.
The phases of the business cycle can be further subdivided into different stages, with specific characteristics that help identify the phase in more detail. As such, the fundamental analysis used in stock or currency market trading is based on the proper identification of the phase of the business cycle the economy is in. The better the trader is at identifying the phase of the business cycle, the bigger the chance that the investment will be profitable.
Related Lessons


See more from this category