Trading and investing in the 21st century involves a portfolio approach to financial markets. A portfolio comprises at least two securities or assets and is often a complex structure spread over multiple markets.
It is not to say that a portfolio must have securities spread over multiple markets. Think of a currency trader.
A swing trader or an investor might have multiple FX positions open at any one point in time, long or short or both. By trading multiple currency pairs at the same time, it is said that the trader manages its FX portfolio.
But why do we talk about portfolios? Why not have just one big, concentrated bet to make an outsized return?
The answer lies in the question. Portfolios reduce risk, mainly through diversification. Sure enough, total risk reduction is not possible, but portfolios spread the risk so that the investor avoids total disaster.
As the old saying goes – why put all your eggs in one basket? Why buy shares in only one company and risk the company going bankrupt? Or underperforms in the long run? Instead, why not spread the investment over multiple companies and even different sectors? This way, the risk spreads, and the investor can easily manage drawdowns and losses.
Which brings us to portfolio management.
Managing a portfolio should be a complete process that starts with knowing yourself (if you manage your own portfolio) or knowing your client's needs (assuming you manage some other people's capital). From this point forward, portfolio management evolves into a complex field designed to increase performance while containing the risk.
At the forefront of portfolio management sits diversification. The clearer the notion of diversification is for the trader and investor, the better.
Diversification – The Starting Point of Portfolio Management
We have all heard of diversification, or the spread of an investment over multiple assets, securities, or markets. Diversifying in portfolio management is to avoid disastrous outcomes when it comes to your investments.
Diversification may be complex or simple. For example, one may diversify within the same asset class or across markets, countries, regions, and even continents.
Diversification reduces risk. But what is the point where too much diversification hurts the portfolio?
Because diversification is a two-way street, it hurts returns while reducing risk. At one point, the portfolio may be over-diversified, and that risk is very low – but so is the return.
Therefore, the diversification level of a portfolio must be known in advance. To find it, one should start with a simple question: what do I want from this investment?
If the answer is 10% yearly return, then a certain combination of assets might be able to provide it. If it is 30%, a riskier combination is needed. If it is 5%, a less risky combination is needed, with a more diversified portfolio.
In the case of a client's assets, the process is similar. It should start with understanding the client's needs and then making sure that the client understands what you are going to do to meet those needs. Also, constant feedback regarding the portfolio's evolution is needed.
Not all investors are the same. For example, some are risk averse, but some may be risk neutral. In other words, understanding what you as a person is may help define your investment strategy. Similarly, understanding the type of investor your client is, helps define the right investment strategy.
Many tools exist to calculate the proper diversification level, such as the diversification ratio. A diversified portfolio aims to provide the expected return with less volatility than otherwise.
Correlations and Market Turmoil Affect Diversification
Upon knowing the aim of constructing a portfolio, the time comes to execute the plan. Effectively, it means buying or selling short securities in such a way that the risk is reduced, volatility as well, and the goal is possible to reach.
Two aspects play a critical role in this process. One is the correlation degree between various markets and market turmoil.
Correlation may be direct or inverse. A direct correlation between two securities means that they respond similarly to the same input. For instance, if the Non-Farm Payrolls report in the United States shows that the US economy has added more jobs in the previous month than the market expected, this is typically good for the local currency, the US dollar.
As a result, the US dollar strengthens. But it does so across the FX dashboard. It means that EUR/USD, AUD/USD, or GBP/USD, will move in the same direction. That is, they are directly correlated.
Therefore, a long-term investor believing that the dollar index will be higher one year from now, would likely have the long dollar position spread over multiple USD pairs, to avoid adding correlated assets that would decrease the diversification level and thus increase the risk.
But more about correlations, the reader will find out later in this article.
Periods of market turmoil also affect diversification. For example, during a financial crisis (e.g., the 2008 Great Financial Crisis), or an exogenous risk coming true (e.g., Russia invading Ukraine in February 2022), all stock market indexes fell sharply. Also, the US dollar strengthened as the world's reserve currency.
In other words, diversification in times of market turmoil is often ineffective.
Active and Passive Portfolios
Part of portfolio management is the investment strategy. At first, there is the investment scope or aim. Then, the investor's risk profile.
Eventually, it comes down to the strategy. That is, how to obtain the desired return and in what way?
In general, one can split portfolios into two types – active and passive. The main distinction between them is whether managers try to outperform a benchmark.
Let us think of a stock market investor that it is actively managing a portfolio. Effectively, the manager buys and sells shares of companies of a certain profile, believing their price is undervalued or overvalued.
The key element here is to have a benchmark to quantify the performance. One popular benchmark for stock market investors is the S&P 500 index, also known generally as the market.
Active managers aim to beat the benchmark. They believe they can do so, and the index acts as a performance benchmark.
At the opposite end of the spectrum, passive managers simply want to replicate the returns of a market. Using the same example, a passive manager may want to have the same returns as the S&P 500 index, so it makes sense to invest in an ETF or Exchange Trading Fund that replicates the index's performance.
The trend is that active management of portfolios exceeds passive management in the last years, especially given the complex economic and geopolitical circumstances.
Types of Investors
People are not the same, and so are investors. It means that each investor has his or her own risk profile, one that needs to be well understood before taking any position in financial markets.
Investing requires risk, or uncertainty. The way an individual acts in uncertain conditions tells us the type of an investor. More precisely, it tells everything about the investor's risk profile.
Gamblers seek risk. As such, they will accept a smaller return in favor of the risk component. On the other hand, risk neutral investors is indifferent to the risk, but cares only about the return.
Finally, a risk averse investor would want to minimize the risk for a similar amount of return. Most investors are risk averse.
The definition of a risk averse investors needs to be well understood. As mentioned earlier, most investors fall into this category.
A risk averse investor is a person preferring to avoid a loss over making a gain. In other words, the investor always prefers a lower return given known risks over an investment with a potentially higher return but also with a higher risk.
But what is a high risk investment? Such investments are stocks, penny stocks, mutual funds, derivatives, such as options, futures, or forward contracts. Commodities and ETFs or Exchange Trading Funds are also considered high risk investments.
At the opposite end, we have low-risk investments, such as bonds, certificates of deposit, Treasury securities, investment grade corporate bonds. Also, the US 10-year Treasury bond is considered risk-free.
Correlation and Its Role in Portfolio Construction
The idea of correlated assets was explained earlier in this article. Now it is time to understand how correlation is used when diversifying a portfolio.
The idea is to have as many uncorrelated assets in a portfolio as possible. For instance, a classic venue for portfolio diversification is to build a portfolio of stocks and bonds. Historically, there is a low correlation between stocks and bonds, and this is why the two asset classes are attractive for investors.
But a key issue to a portfolio built solely with stocks and bonds is the weight of each asset class. More precisely, how much should the investor allocate to each asset class?
The 60/40 Portfolio
The investing community came up with the now-famous 60/40 portfolio. Effectively, it means that an investor willing to build a portfolio of stocks and bonds only to make the most of the low correlation between the two asset classes will allocate 60% of it to stocks, and 40% to bonds.
The idea is to minimize the risk while producing returns. However, as past performance is not indicative of future performance, the 60/40 portfolio doesn't always perform.
For example, the 60/40 portfolio delivered negative returns in 2022. More precisely, a portfolio constructed of 60% stocks and 40% bonds returned -17% in 2022.
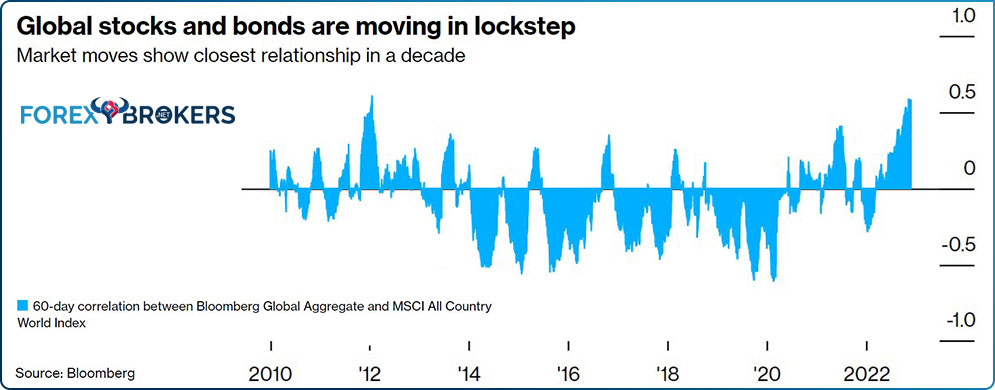
The underperformance is due to many factors, such as inflation surging in advanced economies. However, the main reason for the underperformance is the fact that global stocks and bonds have moved in locked steps.
More precisely, they enjoyed the closest relationship in a decade.
Understanding Correlation
Correlation is a key component of risk diversification. The idea is that adding an uncorrelated asset to your portfolio can reduce the portfolio's risk.
A problem in using correlation to construct a portfolio comes from different types of correlation levels that exist. In other words, not all assets have the same correlation.
Fortunately, correlation can be calculated. The so-called correlation coefficient tells investors how strong a correlation between two assets is. Also, it tells if the assets are directly or inversely correlated.
The coefficient measures the tendency of two assets to move in a similar way. It is bounded to the upside by +1 and to the downside by -1.
The two extremes are key. If two assets have a correlation of +1, it is said that they are perfectly positively correlated.
On the contrary, if two assets have a correlation of -1, it is said that they are perfectly negatively correlated. More exactly, they will move in opposite directions in equal steps.
The best example here comes from the currency market.
- SNB Held the EUR/CHF Exchange Rate floor at 1.20 for Years
In 2011, the Swiss National Bank (SNB) decided to put a floor under the EUR/CHF exchange rate. It announced that it would not tolerate a rate below 1.20 anymore, triggering an instant market move to 1.20.
What followed in the years to come was extremely interesting. Sure enough, traders have tested the SNB's words, by pushing the EUR/CHF close to 1.20.
From a correlation perspective, the closer the EUR/CHF came to 1.20, the closer the correlation between the EUR/USD and USD/CHF came to being perfectly negative.
In other words, if the EUR/CHF traded at 1.20, then every EUR/USD upside move would coincide with a similar downside move in USD/CHF. Hence, trading the EUR/USD and USD/CHF in those days was like trading similar assets, because EUR/USD provided a prediction regarding the USD/CHF movement. And, the other way around – USD/CHF provided a prediction regarding EUR/USD.
But in 2015 the SNB announced that it no longer can afford to protect the EUR/CHF floor. What resulted was extreme turbulence in financial markets, and the end of the perfectly negative correlation between the EUR/USD and USD/CHF pairs.
Sure enough, the correlation still exists, but it is not perfect anymore. The correlation coefficient rose from -1 closer to 0.
So what does it mean when two assets have a correlation coefficient equal to 0? It means that the two assets are uncorrelated.
However, such assets are hard to find. Because of that, it is said that adding an asset with a correlation between -0.5 and +0.5 is desirable for portfolio diversification.
How to Diversify a Portfolio
Correlation is key for diversification, and diversification is key for risk management. Numerous ways exist for portfolio diversification, such as diversification among countries, asset classes, index funds, etc.
Historical correlation coefficients do help in choosing the right diversification path. For example, the correlation between US large company stocks and international stocks is +0.66. Therefore, an investor with 100% of its portfolio in international stocks other than US stocks would be better off avoiding adding US stocks because the correlation coefficient is above +0.5%.
However, the investor may add US long-term corporate bonds to the portfolio, as their correlation with international stocks is 0.02. Basically, the two asset classes are close to being uncorrelated.
Long-term Treasury bonds are also a good option, because the correlation with international stocks is -0.13. Because it is between -0.5 and +0.5, by adding long-term Treasury bonds to a portfolio of international stocks can reduce risk via diversification.
How to Measure Return
Portfolio returns are the way portfolio managers keep score. But returns vary, and it is important to understand why and how.
First, in the case of an actively managed portfolio, the return helps compare with the benchmark. Active managers believe they can deliver higher returns than the benchmark did over the same period.
Second, the return may help in the comparison process of two or more portfolios. But for that, it is mandatory to have a similar way of calculating the return of a portfolio.
Many ways of doing it exists, such as calculating a holding period of return or some mean, such as arithmetic, geometric, or harmonic. It also helps to know what are the two primary sources of income in a portfolio – fixed income and capital gains.
Fixed income refers to things like interest payments or cash dividends. Suppose the investor's portfolio is made up of some stocks that pay a dividend. In that case, the dividend income must be considered when calculating the full return of the portfolio over a period.
This is important because the dividend-paying stock or stocks were part of the portfolio with a specific purpose. Stocks that pay a dividend have a different price action than those that don't and are often viewed as fixed-income assets. Interest payments may arise from portfolios holding various bonds that pay regular coupons.
Capital gains or losses arise from changes in the underlying asset's price. Those who bought a stock may want a higher price over a period. In this case, they realized a capital gain. Conversely, those who sold a stock may want a lower price over a period.
Holding Period Return
The holding period return is a single period return that takes into account income other than the return of the portfolio. For example, if the portfolio gained 2% over a specific period, but it also had dividend income or interest income, they should be accounted for.
Its calculation is pretty straightforward and involves several steps. First, the buying price of an asset. Let us assume that you bought Apple shares at $100/share and hold them for one year.
Second, the selling price at the end of the period. Let us assume that one share of Apple in the one year period rose to $125.
Besides the two pieces of information, one should account for the dividend received. Apple is known as one of the companies paying a regular dividend; such a dividend was received in one year. Let us assume the dividend is $2/share.
In this case, the holding period return for the investment is calculated by adding the dividend to the difference between the selling and the buying prices and then dividing the outcome to the initial buying price.
Arithmetic and Geometric Mean Return
When talking about multiple holding periods, arithmetic and geometric means may be used to have an idea about the average annual return. If we use the arithmetic mean for a period of, say, five years, all we need to do is to sum the annual holding periods of returns and divide the outcome by the number of years. The disadvantage of using the arithmetic mean is that it assumes that the amount invested does not change.
But in the case of a portfolio, it does change, and this is when the geometric mean comes in handy. It is also known as the compounded annual growth rate or CAGR, and it shows the geometric mean of the growth of a portfolio over time.
Internal Rate of Return
The biggest drawdown of using either the arithmetic or the geometric mean is that they do not account for cash flows. For example, one investor may have a return of 10% in the first year and then decide to withdraw a part of its investment due to unforeseen emergency events. Thus, a cash flow out of a portfolio appears and it should be taken into account. For this, the internal rate of return does help.
Also called the money-weighted return, it provides information about the return of an actual investment, accounting for cash flows into or out of the portfolio.
The process of calculating it is relatively simple. It starts with the balance from the previous year and then it accounts for all the movements in the portfolio.
A new investment from the investor is accounted as a cash inflow and withdrawal from the portfolio is a cash outflow. Because of that, the internal rate of return is not useful in comparing portfolios even if they are similar, because investors may have invested different amounts in different years.
Time-Weighted Return
This is the preferred performance measure for portfolios. So, if you ever want to measure the return of a portfolio correctly, the time-weighted return is the right method to use.
Let's say that you want to calculate the time-weighted return for a portfolio for one year. The first step to take is to subdivide the year into sub-periods. This is convenient, as one could subdivide the year in quarters, as US corporations report quarterly earnings and those that do pay a dividend do so quarterly too.
Next, you need to calculate the holding period return for each of the four quarters. Finally, link them into an annual return to find the time-weighted return of the portfolio.
Types of Risks
The idea of a portfolio appeared as investors wished to protect against risk. However, full protection is not possible.
Also, the diversification degree of a portfolio must be carefully considered. But can investors protect against all risks? The answer is a sound no.
Two types of risk exist, and one cannot be diversified away. Think of the COVID-19 pandemic that hit the world in 2020.
What followed after the World Health Organization declared a pandemic was chaos in financial markets. All equities declined, no matter what.
Sure enough, central banks intervened and, with governments' help, provided monetary and fiscal support to businesses and households. Their actions worked as the economies stabilized and, in time, vaccines to fight the pandemic were available.
But the governments and central banks actions led to high inflation. In the developed world, in countries such as the United States or in the euro area, inflation has reached levels not seen in the last four decades.
Inflation is another risk that cannot be diversified away.
Political uncertainty is another. Two examples are worth mentioning here – Donald Trump's election as the President of the United States, and the Brexit referendum that led to the United Kingdom leaving the European Union.
All these risks are not diversifiable with a portfolio, because they lead to similar market reactions in all asset classes. Such risk is called systematic risk.
Nonsystematic risk, for instance, can be diversified away, albeit not 100%. Think of an investment in a biomedical company involved in the development of a new revolutionary treatment for cancer.
If the drug fails to deliver the expected results on trial, the company's stock will be affected. However, the news will have no impact on other companies in other industries or even in the same industry.
In other words, nonsystematic risk can be diversified away, while systematic risk cannot. Investors should pay attention to both, but out of the two, the nonsystematic risk has the biggest impact to the performance of a portfolio.
How to Measure the Risk of an Investment
One thing to remember when discussing risk is that it is a forward-looking measure. In other words, it attempts to describe what could happen in the future.
Sure enough, investors look at the past performance to form an idea about future performance. However, past performance is not indicative of future success.
For instance, an investment strategy that had a big drawdown in the past does not mean that it will have a similar one in the future. From the perspective mentioned above, of risk is a forward-looking measure, the drawdown simply describes what happened in the past.
One financial metric used for estimating the risk of an investment is Value at Risk, or simply VaR.
Value at Risk (VaR)
Investment managers highly use VaR. It tells things like how much the investor might lose, on what timespan, and what is the probability of losing capital.
For example, if one uses a monthly Var with a 95% statistical confidence, it means that the aim is to estimate how much the investment might lose in a month with a probability of 95%. Simply put, VaR is a statistical technique with both advantages and disadvantages.
On the plus side, VaR is easy to understand and can be applied to all types of assets, such as currencies, bonds, etc.
On the downside, the VaR needs to be calculated for each asset in a portfolio. In other words, the bigger the portfolio, the more difficult it is to calculate VaR because the manager needs to do so for every security part of the portfolio.
What Affects Risk?
Most of this trading academy is built on examples from the currency market. Therefore, let us use the currency market to exemplify how a portfolio of FX positions might increase risk.
There are several avenues for risk to increase when trading FX. First, the trade frequency. The more trades in an investment, the higher its risk.
In second place comes leverage. The higher the leverage, the higher the risk.
In developed markets, financial authorities intervened, and the retail community cannot trade with leverage bigger than 1:30. However, back in the day, the leverage used to be much higher.
Leverage works both ways. It allows the investor to gain more when the market moves in the desired direction, but the same is true when the market moves against the trader.
Still, in the FX market, the longer the duration, the higher the risk. An FX market participant might be a scalper (i.e., focuses on short and very short-term trades), a swing trader (i.e., focuses on trades that takes from a couple of hours to a few days), or an investor (focuses on long-term positions mainly taken from understanding interest rate differential and macroeconomic developments in the world). However, investors have a hard time performing in the FX market, and if they do, they have both the resources and the willingness to wait for months, or maybe even more, for a trade to come their way. Anyways, the longer the trade takes, the higher the risk.
Market volatility is another factor that leads to increased risk. The higher the volatility, the higher the risk. For example, 2022 was known as the year when inflation jumped to 40+ years high in the advanced economies. As such, the main economic report to watch was the CPI or inflation report. During the release of these reports, the volatility increased dramatically in the FX market, thus affecting the risk.
Finally, the correlation of assets also increases risk. By adding correlated positions to a portfolio, the trader increases the risk of the market changing direction suddenly.
How to Compare Two or More Portfolios
What if an investor wants to compare multiple portfolios to see which one performed best? In this case, the investment industry uses several ratios, and the most popular ones are the Sharpe ratio and Jensen's Alpha.
If we divide the risk premium of a portfolio by its risk, we find the Sharpe ratio. The portfolio with the highest Sharpe ratio should be favored. However, the ratio has some limitations, such as the fact that it considers total market risk.
On the other hand, Jensen's Alpha focuses only on systematic risk. That is, the risk that cannot be diversified away. If Jensen's Alpha is positive, it means that the portfolio outperformed the market. Conversely, if it is negative, it means that in underperformed the market.
Conclusion
Increased potential return is only possible with increased risk.
Investors build a portfolio to protect against risk. Managing a portfolio differs from managing a single investment in an asset.
A portfolio is made of at least two assets or securities, and it can grow from there. It cannot, however, grow endlessly because it will eventually become too big and affect performance.
Diversification is key when managing a portfolio. The secret is finding the appropriate diversification level that protects against risk and leaves room for the portfolio to grow.
Speaking of risks, not all risk is diversifiable. Investors should pay attention to non-diversifiable risks, such as political uncertainty, inflation, or natural disasters.
While diversification protects against risk, it does not guarantee a positive return. To calculate returns, the investor has multiple methods available to use, such as the holding period of return or the time-weighted return. Finally, some famous ratios can be used to compare two or more portfolios on a risk-adjustment performance.
Portfolio management in Forex trading is a huge area impossible to cover in just one article. Yet, in time, it became the bedrock of the investment community, with several developments taking place each year.
