

217
Are financial markets efficient? This question has generated intense debate over the years.
An efficient market means that trading opportunities do not exist. Market participants are supposed to arbitrage them away quickly. Such opportunities should disappear quickly in the world of trading robots and algorithms.
Yet, some traders and investors delivered impressive results over time. Some follow only the charts, use technical analysis, and predict future price levels. They found a niche that worked in the past and works now, but there is no guarantee that it will work in the future because markets adapt quickly.
This article touches on subjects such as market efficiency and behavioral finance because the two are connected. Behavioral finance explains market efficiency, or its inefficiency, because of the ever-changing human nature.
Are markets efficient? This article does not try to answer the question but gives arguments on why the markets move the way they do, what market efficiency is, and what behavioral traits one needs to overcome to be successful.
Behavioral finance is a growing subject in finance because, in the end, it is the way investors react to the flow of information that moves financial markets. This article will also discuss concepts such as intrinsic value and main market anomalies and touch on the basics of behavioral finance.
Market Efficiency
An efficient market incorporates all available information. Therefore, opportunities to profit from market movements should not exist. As such, believers in the theory of market efficiency are convinced that long-term profits are not possible. They are possible only if the market is not incorporating all the available information.
The truth lies somewhere in between. There is a gap between gathering and processing new information, and that difference might be speculated. In other words, an efficient market reflects all past and present information.
Because consistent returns are not possible in efficient markets, passive and active investing differ too. Effectively, active investing would underperform passive investing because transaction costs are higher for the active investor than for the passive one that simply tracks the market.
Let us think of the currency market. Traders price in the current economic data and the central banks' policies.
Any surprise economic data or change in central banks' view will trigger intense volatility. For example, suppose you have ever wondered why the market reacts so abruptly to the release of the Non-Farm Payrolls report in the United States? In that case, the answer is that the new information gets incorporated into the market. Because the FX market is dominated by algorithmic trading, that information is incorporated almost instantly, creating sharp up or down movements.
Active traders do not believe that markets are inefficient. Instead, they believe that differences in pricing new information exist. Because of that, they constantly monitor the market to identify such differences. Once found, they are traded away, so the mispricing disappears quickly.
To better understand market efficiency, one needs to understand the difference between four important concepts: market value, intrinsic value, overvalued and undervalued.
Market Value
Market value is the current price in the market. For example, if we talk about the EUR/USD exchange rate, at the time of writing this paragraph, the pair traded at 1.0591. Or, if we talk about the S&P 500 index, it is 3986 points. Finally, Apple stock trades at $147.83/share.
Referring back to the concept of market efficiency, these are the prices that reflect all the past and current information in the market. Anything new will be quickly traded away.
But in order to trade an asset, one needs to know its real value – not only the value at which it could be bought or sold. Therefore, the trader needs to determine an asset's intrinsic value.
Intrinsic Value
The intrinsic value is also called the fundamental value and can only be estimated, not known exactly. This is the value that should reflect all the asset's characteristics. If one believes that markets are efficient, then it makes no sense to try to find out the intrinsic value of an asset because it would be 1.0591 for the EUR/USD, 3986 points for the S&P 500, and $147.83/share – the current market values for the three examples used.
But all participants in financial markets know that the prices do move – quite substantially. It means that traders, speculators, and investors have different ideas about an asset's intrinsic value. As such, they take positions in the market by buying or selling based on their belief in the intrinsic value.
So, what do investors and traders use to determine an asset's intrinsic value? Regarding an exchange rate, traders try to find the intrinsic value using various technical and fundamental analyses. The same is true for a stock market index or a specific stock, with the mention that in the case of a specific stock, investors use complex models like the Capital Asset Pricing Model or CAPM or Discounted Cash Flow to find the intrinsic value. These traders and investors believe that the market is relatively inefficient. Thus, they believe they can find an asset's true value and trade the market for a profit.
What happens after an investor finds what is believed to be the intrinsic value of an asset? The next step is to compare it with the asset's market value to determine if it is overvalued or undervalued.
Overvalued or Undervalued
Overvalued or undervalued are fairly simple concepts. The difficult part is finding out the true intrinsic value or estimating it as accurately as possible.
If the market value is bigger than the intrinsic value, then the asset is overvalued. As such, the trader will initiate a short position or sell the asset, with the idea that the market must decline for the price to reach the intrinsic value.
For the EUR/USD example, if the intrinsic value is 1.04, the trader will sell short the pair from the current 1.0591 to make a profit of 191 pips points. In doing so, the trader must decide the volume traded (e.g., one full lot equals $10/pip, so the entire 191 pips point distance would value $1910 gross of costs) and the risk taken. That is, the stop-loss order, or what would invalidate the trader's scenario.
If the trader believes that the intrinsic value of the S&P 500 index is 4500, the next step is to open a long position and trade for the difference. ETFs or Exchange Traded Funds are preferred due to their low transaction costs.
The same is true for stocks. Suppose Apple's intrinsic value is believed to be $155/share. In that case, the stock market investor will accumulate Apple shares and keep them until the market value reaches the intrinsic value, making a profit on the way up.
The EUR/USD was overvalued in the three examples, while the S&P 500 and Apple stock were undervalued. Whenever an asset is overvalued, the trader initiates a short position. Whenever it is undervalued, the trader initiates a long position.
Market Anomalies
It is believed that markets are efficient, but some anomalies do exist. They represent exceptions, but do they really work?
Here is a list of some of the market anomalies covered in the next section of this article:
- Super Bowl pricing anomaly
- January effect
- Stock splits effect
- IPO effect
- Value line enigma anomaly
- Overreaction
- Time-of-day effect
- Size effect
- Value effect
- Weekend effect
- Holiday effect
- Momentum anomaly
- Turn-of-the-month effect
Super Bowl Pricing Anomaly
The Super Bowl anomaly is one of the most curious of them all. It says that the winner of the Super Bowl can predict the stock market's performance. More precisely, if the National Football Conference team wins the Super Bowl, the stock market would deliver a positive return that year. Conversely, if the American Football Conference team wins, then the stock market is expected to deliver negative returns.
Is this anomaly correct?
Discovered by Leonard Koppett in 1978, the Super Bowl pricing anomaly delivered a correct prediction in only 10 years in a period between 2000 and 2022.

January Effect
The January effect is a calendar anomaly witnessed in the stock market. The idea behind it is that investors believe the chances are big that the stock market will post gains in January every year.
While it sounds more like wishful thinking, the arguments behind this anomaly sound credible. One of them is that investors sell their stocks in the previous December to lock in capital losses for the year. Then, when January starts, they jump in into the stock market and buy back stocks at lower prices.
Another is that at the year's end, bonuses are paid by companies and received by employees. A big chunk of these bonuses is believed to end up in the stock market, thus triggering a rally.
Is this always true? Unlikely.
A quick look at the past three decades reveals that about 54% of the January months have delivered positive returns, while the rest delivered negative ones. Still, some argue that in the years when January delivered strong returns, the stock market outperformed for the entire year, too.
Earnings Surprise
All traders are familiar with the notion of an earnings surprise. The regulator requires publicly listed companies to announce their financial performance regularly. Investors and analysts do their job and estimate the earnings per share. It is a surprise if the company announces earnings that differ from the estimate. The announcement typically triggers massive moves in the stock market, especially because most of these earnings releases happen during hours when the stock market is closed.
If one accounts for the transaction costs and risks involved when trading earnings, the anomaly disappears, and no abnormal gains can be earned in the long run.
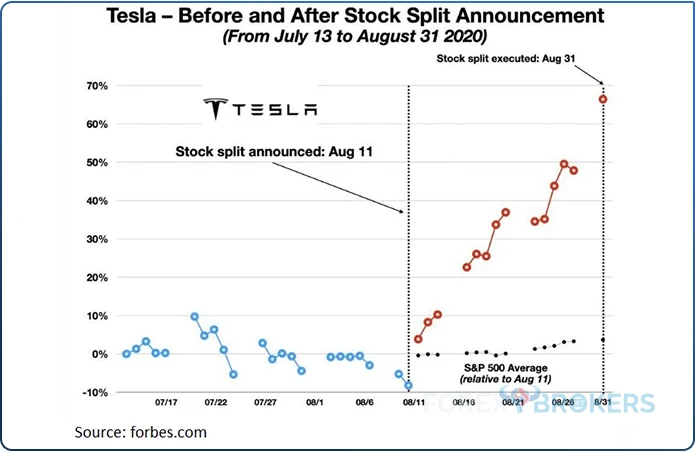
Stock Splits Effect
Sometimes, a publicly listed company may decide to split its stock. For instance, Apple, one of the largest corporations in the world, announced a 4-for-1 stock split in July 2020.
Effectively, the share price decreases four times, while each shareholder receives three additional shares. In doing so, the company's market capitalization (i.e., share price times the number of shares outstanding) does not change.
But what is the stock split anomaly?
Because the stock price usually rises before and after a stock split announcement, it is said that this is an anomaly. Apple and Tesla are recent famous examples, and their stock price advanced.
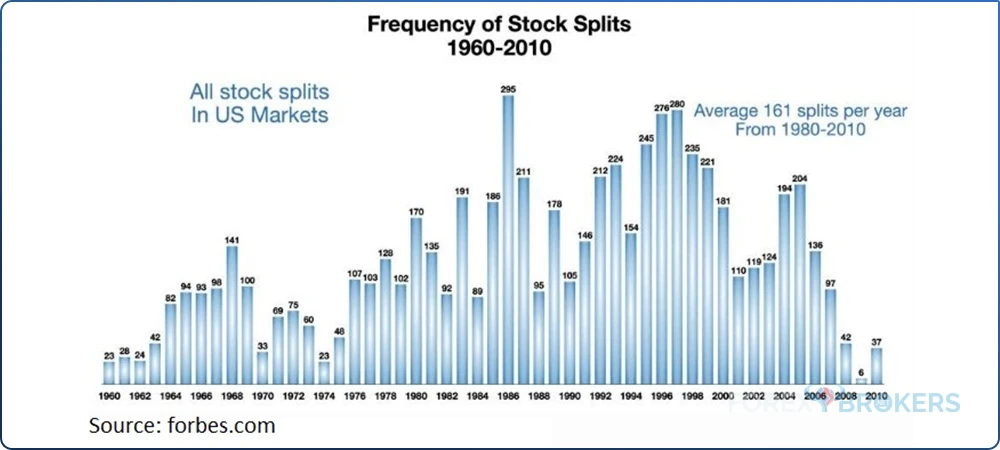
How often do companies announce stock splits? A look back at the period between 1960 and 2010 reveals that stock splits are quite common. For instance, in the three decades from 1980 until 2010, there were an average of 161 splits per year.
IPO Effect
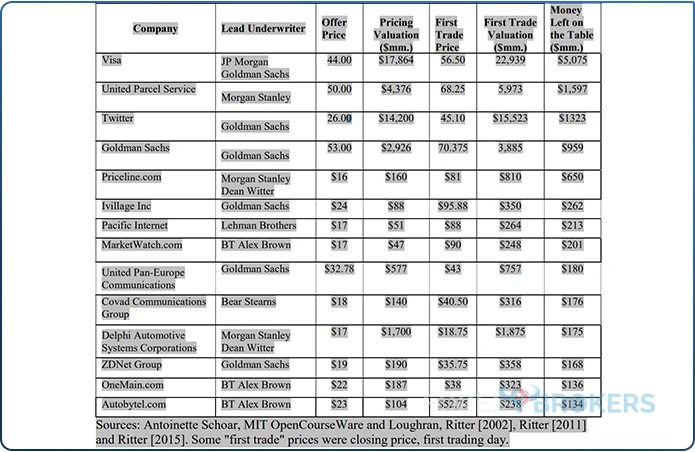
When a company decides to go public, it does so usually via an IPO or an Initial Public Offering. The underwriter, which is usually an investment bank or more than one, usually sets the initial price too low to reduce the risk of not selling all of the shares. The evidence suggests that buying shares at an IPO does lead to earning abnormal returns. However, in the long run, that is not always the case.
In time, IPOs led to unexplained pricing patterns. For example, short-term IPO returns are abnormally high compared to those of other stocks with comparable risk. Also, in a period of 3-5 years, IPOs seem to underperform the market.
As the table below shows, when Goldman Sachs, Twitter, UPS, and Visa were much higher than the IPO offer price.
Value Line Enigma Anomaly
The Value Line enigma anomaly refers to the timeliness given to stocks by the firm Value Line. Investors pay a subscription to access the data, and the company ranks stocks based on earnings expectations for a period between half a year and one year.
1 is the highest ranking, and 5 is the lowest, and the stocks ranked higher are believed to outperform the overall market.
Overreaction
Overreaction is a time series anomaly. It goes against momentum because it is believed that stocks that performed poorly in the past three to five years would outperform other stocks that performed well over the same period. In other words, it favors buying losers and selling past winners in the stock market.
Time-of-Day Effect
Also called the 10 am rule in the stock market, the time-of-day effect refers to stocks that open higher or lower than the previous daily close. The focus is on the first ten minutes of trading, as it is believed that those stocks will continue to rise to fall in the first five to ten minutes of the new trading session.
Size Effect
The size effect is a cross-sectional anomaly. It refers to small-cap companies. It is believed that shares of small-cap companies will outperform large-cap companies on a risk-adjusted basis.
Value Effect
Another cross-sectional anomaly is the value effect. It is believed that value stocks will outperform growth stocks over long periods of time. Value stocks are those with below-average price/earnings ratios, higher-than-average dividend yield, and below-average market-to-book value.
Weekend Effect
Also known as the Monday effect, the weekend effect refers to the price action in the stock market on the first day of a new trading week. The stock market is believed to continue in the same direction as it closed the previous Friday.
Therefore, if the market was in a bullish trend last Friday, on Monday, investors expect more of the same. Conversely, if the market was in a bearish trend the previous Friday, investors expect the weakness to continue on Monday.
Holiday Effect
As the name suggests, the holiday effect refers to the stock market's performance ahead of a holiday. It is believed that stock returns on the day before market holidays tend to be higher than on other days.
Momentum Anomaly
Momentum means continuity. Therefore, it is believed that stocks that performed strongly in the past will continue to do so and outperform other stocks that performed poorly in the past.
Turn-of-the-Month Anomaly
A seasonal anomaly, the turn-of-the-month effect, typically refers to the stock market. Stocks are believed to surge during the month's last trading day and the few first trading days of the new month.
Technical Analysis – Weak Form Market Efficiency
Technical analysis is based on studying historical price data to find patterns for predicting future market behavior. It is widely believed that it does not work in the long run because the market will find such inefficiencies and will arbitrage them away quickly.
For example, imagine a head and shoulders pattern forming on the larger timeframes, such as the daily chart or above. Such a pattern requires a lot of time to form, as it has two major consolidation areas – the left and the right shoulders. In the meantime, the price action rallies to the top and retraces to the consolidation areas just above the neckline.
The problem is that anyone doing technical analysis knows about the head and shoulders pattern. On such a large timeframe, it is literally impossible to miss. Therefore, such patterns rarely work because they are obvious, and the market will arbitrage them.
Does this mean that technical analysis is useless? No, it does not.
Traders quickly adapted. They use nowadays niche markets or very low timeframes to trade such patterns very quickly and often with the use of expert advisers or robots.
Put simply, there is no room for a technical trader to succeed in an efficient market. Yet, plenty of examples exist, and this raises, once again, the question – are markets efficient?
In a weak form of market efficiency, it is believed that all past data is already priced in. Abnormal gains based on pattern analysis are not possible in the long run. In such a market, future prices are believed to be random and have nothing to do with historical prices. Thus, studying past data on a chart should not provide any particular edge for forecasting future market movements.
In short – a weak form of market efficiency incorporates only past data. Hence, technical analysis is the preferred method used to analyze and exploit historical trading data – although the market should already incorporate the outcomes.
Fundamental Analysis – Semi-strong Form Market Efficiency
A semi-strong market form market efficiency is one where prices reflect all the past data and also all known and available public information. In other words, in such a market, traders use both technical and fundamental analysis to find the intrinsic value of an asset.
However, such efforts are pointless because all the information should already be incorporated in a semi-strong form efficient market.
Finally, there is another form of market efficiency known as the strong form of market efficiency. This type of market incorporates everything – all the past data, the public information, and the private information. In other words, not even insiders can earn from trading such markets.
Behavioral Finance
Behavioral finance deals with how psychology influences the outcome of trading. It is an area of great interest that has evolved to a great extent in the last several years because human nature plays an important role in the way people behave when putting capital at risk.
Here is a list of some of the behavioral biases covered in the next section of this article:
- Narrow framing
- Mental accounting
- Conservatism
- Representativeness
- Confirmation
- Illusion of control
- Hindsight
- Anchoring
- Availability
- Loss aversion
- Endowment
- Self-control
- Status quo
- Overconfidence
- Regret aversion
Narrow Framing
Narrow framing is a behavioral bias of investors. It is a myopic approach to investing because investors tend to overlook the full range of options available. More precisely, investors fail to consider the entire portfolio, thus missing the big picture.
One way to make bad investing decisions is by focusing on details while forgetting the big picture. Moreover, it is a fundamental shortcoming that many people are affected by. Narrow framers prefer to maintain the status quo, thus affecting the overall long-term performance of the portfolio.
Mental Accounting
Another behavioral bias is mental accounting. First introduced by Richard Thaler in 1999, mental accounting refers to people treating money differently.
The best example of mental accounting is birthday money. People would tend to spend it differently than money received as compensation for work. Other examples are tax refunds or bonuses.
In investing, mental accounting bias affects investors as they tend to keep track of gains and losses in different ways. As a result, investors think of losses and wins differently, thus impacting the portfolio's overall performance. In other words, investors tend to focus on one particular company or investment without considering the full range of the investments within the portfolio.
A direct consequence of mental accounting in investing is that investors neglect opportunities to reduce risk. Also, another consequence is that, very often, returns derived from income and returns derived from capital appreciation are treated similarly.
Conservatism
Conservatism is a behavioral bias typically considered positive. However, studies have found that it negatively impacts a portfolio because the investor tends to react very slowly to changes or new information. Conservatism differs from conservative. A conservative investor is one who favors capital preservation over market returns. In other words, it takes less risk.
However, conservatism as a behavioral bias refers to the investor's unwillingness or inability to react to new information. Thus, the investor maintains the prior investment idea or forecast, which may be the wrong decision with a negative impact on the portfolio.
Representativeness
When an investor lets past experiences affect the way new information is classified, it is said that the investor is influenced by a behavioral bias called representativeness. The problem comes from the so-called similarity of new information with old one.
It may seem that the information is the same, but in fact is very different. It is "representative" to the investor, so the portfolio's impact is believed to be known in advance. In reality, the new information deceives the investor, leading to an incorrect understanding of the impact on the portfolio.
Confirmation
As investors, when we tend to justify to ourselves what we want to believe, our judgment is affected by confirmation bias. This happens all the time.
Consider an investor looking at the EUR/USD exchange rate through the lens of the Elliott Waves theory. At the end of a top/down analysis, the investor has a directional bias regarding where the pair would go next. If the market does not move for a while, the trader tends to justify the positioning by adding to the initial entry. Consequently, the trader tends to focus only on positive information that supports the trades, ignore information that would invalidate the scenario, and overtrade by taking too much risk and disregarding money management.
Illusion of Control
The illusion of control behavioral bias is just like what it sounds. Investors sometimes tend to believe that they can influence a particular outcome. In reality, they can't.
The best example comes from the lottery. Many people prefer to choose their own numbers when buying a lottery ticket.
In investing, such a bias leads to an improperly diversified portfolio. Or, the forecasts are too detailed – like using too many moving averages on the same chart.
Hindsight
Hindsight as a behavioral bias is very common among investors. It refers to investors believing that past events were predictable.
Imagine that an investor bought a company's stocks, and the share price immediately jumped by 10% or more. Affected by the hindsight bias, the investor believes that it was easy to predict such a move when the decision to buy or go long may have been poorly reasoned, and the positive outcome was just random. As such, the investor believes that the process leading to the positive return was brilliant and will repeat it in the future, but with different results.
Anchoring
Anchoring is a behavioral bias that occurs when investors rely on their decision to buy or sell a security on a single piece of information. No matter what happens next, the investor sticks with the original decision, even though the new information may be material and impact the portfolio.
Availability
Availability as a behavioral bias is a bit more complicated than it sounds. It deals with information processing. One source of availability is the way investors deal with an idea or an answer. Typically, the first that comes to mind is considered to be the correct one. This is called retrievability.
Other sources of availability are resonance, categorization, and a narrow range of experience. Failing to diversify a portfolio may be a result of the investor being affected by the availability bias. Also, when choosing an investment from an advertisement.
Loss Aversion
Loss aversion refers to the tendency to prefer avoiding losses instead of achieving gains. Loss aversion is common among investors and every market participant has heard the phrase of letting the winners run while cutting the losses early.
In the case of loss aversion, the investor does exactly the opposite – holds investments in a loss position longer and sells investments in a gain position earlier.
Endowment
The endowment is a behavioral bias that influences the investors' view of an investment after they own it. They value the asset more.
The best example here comes from the cryptocurrency market. Many Bitcoin investors have decided to "hold" their Bitcoin holdings or to have "diamond hands". It means that they would not sell their Bitcoins no matter what.
Bitcoin rose to over $64k only to reverse gains and tumble back to $16k. Those investors' endowment bias led to the failure to sell on the way up and replace Bitcoin with other assets.
Even if they did sell their Bitcoins on the way up, if they invested in the cryptocurrency market in the same direction, they would still be affected by the endowment bias because they continued to hold classes of assets with which they were familiar.
Self-Control
Self-control is a behavioral bias affecting everyone. In theory, we as individuals like to believe that we have self-control – which we do have from time to time, but not always.
It refers to investors failing to act to reach their long-term goals. For example, failing to save sufficiently enough for the future. In doing so, the investor is willing to accept more risk for higher returns in the present. Also, the investor tends to borrow excessively to finance day-to-day consumption.
Status Quo
When investors choose to do nothing instead of making a change, it is said that they prefer to maintain the status quo. They fail to explore other opportunities, directly impacting the long-term portfolio performance.
Overconfidence
Overconfidence is a very common bias in the investment world. Whenever investors are overconfident, the market tends to humble them quickly. The bias refers to investors having too much or excessive faith in their own abilities. Overconfidence may lead to overtrading.
For example, imagine as a trader that you bought the EUR/USD at 1.05, believing it will next go to 1.12. But the market moves to 1.04 first. Overconfidence leads to overtrading because the investor tends to add to losing positions and ignore new information that might be important. In other words, the investor underestimates risk and overestimates expected returns.
Regret Aversion
Regret aversion is a behavioral bias affecting investors who are too afraid to make a decision out of fear of taking a loss. As a result, investors tend to be too conservative with their portfolios.
Also, herding behavior is present, as popular investments sound more comfortable than being a contrarian. Trading with the crowd may be perceived as a safer way of investing.
Conclusion
Evidence suggests that markets are efficient, but mispricing still exists. As a result, traders, investors, and speculators are always looking for the next opportunity or the market that might not reflect all the information available.
Technical and fundamental analysis, as well as insider trading, define different forms of market efficiency. Of course, anomalies do exist, relatively few of them, but evidence suggests that in the long run, they are arbitraged away.
The key to trading today's markets is to find an asset's intrinsic value – an estimate at best. Once close to it, traders will try to trade the markets by speculating on the difference between the market value and the intrinsic value. If an asset is overvalued, the traders will sell it or go short. If an asset is undervalued, traders will buy it or go long.
Behavioral finance biases affect investors' decisions directly impacting the portfolio. As humans, it is impossible to overcome all of these biases at the same time. Still, it does positively impact a portfolio if we are aware of them and what we can do to minimize their impact on the portfolio.
Related Lessons


See more from this category